Debt Collection Software Market by Component (Software, Services), Organization Size, Deployment Type, User Type (Financial Institutions, Collection Agencies, Healthcare, Government, Telecom & Utilities), and Region - Global Forecast to 2024


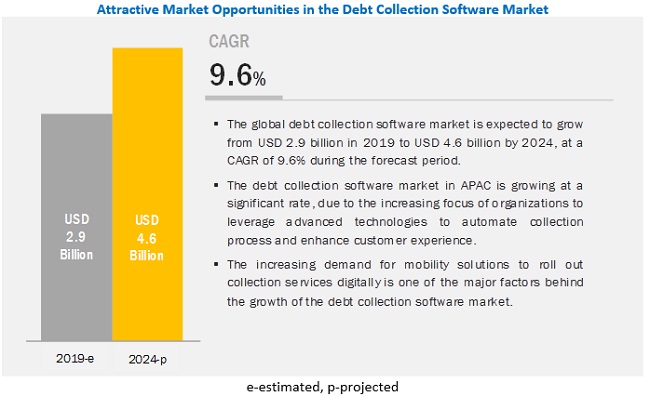
[128 Pages Report] The debt collection software market size to grow from USD 2.9 billion in 2019 to USD 4.6 billion by 2024, at a CAGR of 9.6% from 2019 to 2024. The increasing need for self-service payment models to speed up the collection process and automation in the debt collection process is expected to increase the adoption of debt collection software across the globe during the forecast period.
Source: Industry Experts and MarketsandMarkets Analysis
The large enterprises segment is expected to account for the larger market share during the forecast period.
The use of the debt collection in large enterprises is relatively higher as compared to that of small and medium-sized enterprises (SMEs). This higher use is due to the affordability and economies of scale, which enables large organizations to benefit from the debt collection. Large enterprises have left no stone unturned to compete in today�s cut-throat competitive industry. Moreover, the need for multichannel communication to reach debtors and improve the collection process through automation is likely to drive the growth of the debt collection software.
The services segment to grow at a higher CAGR during the forecast period as compared to the solutions segment
Debt collection services have a broad scope of usage, ranging from assistance to the client for the deployment of software, strategy, & implementation, to cater to the business-specific needs of organizations. Debt collection services help businesses bridge legacy systems to modern applications and take care of training and implementation work so that the client can focus on their core business. This has created opportunities for vendors to provide services to different stakeholders of debt collection ecosystem and help them deal with complexities while configuring modern debt collection software.
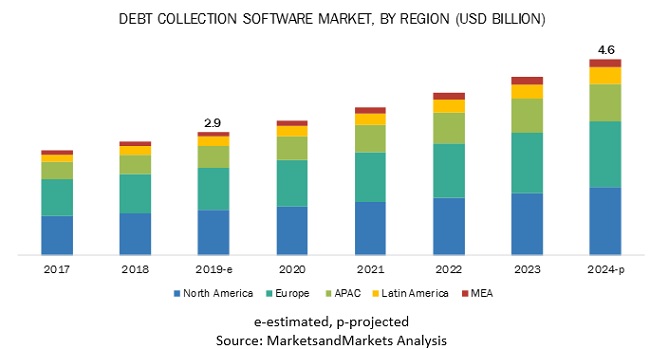
North America estimated to lead the debt collection software market during the forecast period
North America is expected to account for the largest share of the debt collection software market in 2019. The region comprises developed countries, such as the US and Canada, and is considered the most advanced region in terms of adopting digital technologies and cloud-based platforms to take hold of the increasing bad debt rates. The North American region exhibits a wide presence of key industry players offering debt collection software and services, and its financial position enables it to invest majorly in leading tools and technologies for effective business operations.
Major vendors providing cloud storage are It includes 15 major vendors, namely, FIS (US), FICO (US), Experian (Ireland), CGI (Canada), and TransUnion (US), and others.
Get online access to the report on the World's First Market Intelligence Cloud
- Easy to Download Historical Data & Forecast Numbers
- Company Analysis Dashboard for high growth potential opportunities
- Research Analyst Access for customization & queries
- Competitor Analysis with Interactive dashboard
- Latest News, Updates & Trend analysis
Request Sample Scope of the Report
Get online access to the report on the World's First Market Intelligence Cloud
- Easy to Download Historical Data & Forecast Numbers
- Company Analysis Dashboard for high growth potential opportunities
- Research Analyst Access for customization & queries
- Competitor Analysis with Interactive dashboard
- Latest News, Updates & Trend analysis

|
Report Metrics |
Details |
|
Market size available for years |
2017-2024 |
|
Base year considered |
2018 |
|
Forecast period |
2019-2024 |
|
Forecast units |
Value (USD) |
|
Segments covered |
Components (Software and Services), Deployment Type, Organization Size, User Type, and Region |
|
Geographies covered |
North America, Europe, APAC, Latin America, and MEA |
|
Companies covered |
It includes 15 major vendors namely FIS (US), FICO (US), Experian (Ireland), CGI (Canada), TransUnion (US), Pegasystems (US), Temenos (Switzerland), Intellect Design Arena (India), Nucleus Software (India), Chetu (US), AMEYO (India), Loxon Solutions (Hungary), EXUS (UK), Kuhlekt (Australia), and Katabat (US) |
This research report categorizes the Debt Collection Software market based on component, deployment model, organization size, vertical, and region.
By component, the debt collection software market is segmented as follows:
- Component
- Software
- Services
- Consulting
- Integration & implementation
- Training & support
By the deployment type, the debt collection software market has been segmented as follows:
- On-premises
- Cloud
By organization size, the debt collection software market has been segmented as follows:
- SMEs
- Large Enterprises
By user type, the debt collection software market has been segmented as follows:
- Financial Institutions
- Collection Agencies
- Healthcare
- Government
- Telecom & Utilities
- Others (Real estate and retail)
By region, the debt collection software market has been segmented as follows:
- North America
- US
- Canada
- Europe
- UK
- Germany
- France
- Rest of Europe
- APAC
- Australia and New Zealand (ANZ)
- Japan
- China
- Rest of APAC
- MEA
- Kingdom of Saudi Arabia (KSA)
- South Africa
- United Arab Emirates (UAE)
- Rest of MEA
- Latin America
- Brazil
- Mexico
- Rest of Latin America
Available Customizations
With the given market data, MarketsandMarkets offers customizations as per the company�s specific needs. The following customization options are available for the report:
Company Information
- Detailed analysis and profiling of additional market players up to 5
Frequently Asked Questions (FAQ):
What are debt collection software?
Who are the top companies providing Debt Collection Software?
Who are the end users of the Debt Collection Software?
How fast is the market for debt collection software expected to grow ?
To speak to our analyst for a discussion on the above findings, click Speak to Analyst
Table of Contents
1 Introduction
1.1 Objectives of the Study
1.2 Market Definition
1.3 Market Scope
1.4 Years Considered for the Study
1.5 Currency
1.6 Stakeholders
2 Research Methodology
2.1 Research Data
2.1.1 Secondary Data
2.1.2 Primary Data
2.1.2.1 Breakdown of Primaries
2.1.2.2 Key Industry Insights
2.2 Market Size Estimation
2.3 Research Assumptions
2.4 Limitations
3 Executive Summary
4 Premium Insights
5 Market Overview and Industry Trends
5.1 Introduction
5.2 Market Dynamics
5.2.1 Drivers
5.2.2 Restraints
5.2.3 Opportunities
5.2.4 Challenges
5.3 Enterprise Asset Management Market: Use Cases
5.3.1 Use Case #1
5.3.2 Use Case #2
5.3.3 Use Case #3
5.3.4 Use Case #4
5.3.5 Use Case #5
5.4 Regulatory Compliance
6 Debt Collection Software Market, By Component
6.1 Introduction
6.2 Software
6.2.1 Market Estimates and Forecasts, 2017 - 2024 (USD Million)
6.2.2 Market Estimates and Forecasts, By Region, 2017 - 2024 (USD Million)
6.3 Services
6.3.1 Consulting
6.3.1.1 Market Estimates and Forecasts, 2017 - 2024 (USD Million)
6.3.1.2 Market Estimates and Forecasts, By Region, 2017 - 2024 (USD Million)
6.3.2 Integration and Implementation
6.3.2.1 Market Estimates and Forecasts, 2017 - 2024 (USD Million)
6.3.2.2 Market Estimates and Forecasts, By Region, 2017 - 2024 (USD Million)
6.3.3 Training and Support
6.3.3.1 Market Estimates and Forecasts, 2017 - 2024 (USD Million)
6.3.3.2 Market Estimates and Forecasts, By Region, 2017 - 2024 (USD Million)
7 Debt Collection Software Market, By Deployment Type
7.1 Introduction
7.2 On-Premises
7.2.1 Market Estimates and Forecasts, 2017 - 2024 (USD Million)
7.2.2 Market Estimates and Forecasts, By Region, 2017 - 2024 (USD Million)
7.3 Cloud
7.3.1 Market Estimates and Forecasts, 2017 - 2024 (USD Million)
7.3.2 Market Estimates and Forecasts, By Region, 2017 - 2024 (USD Million)
8 Debt Collection Software Market, By Organization Size
8.1 Introduction
8.2 Large Enterprises
8.2.1 Market Estimates and Forecasts, 2017 - 2024 (USD Million)
8.2.2 Market Estimates and Forecasts, By Region, 2017 - 2024 (USD Million)
8.3 Small and Medium-Sized Enterprises
8.3.1 Market Estimates and Forecasts, 2017 - 2024 (USD Million)
8.3.2 Market Estimates and Forecasts, By Region, 2017 - 2024 (USD Million)
9 Debt Collection Software Market, By User Type
9.1 Introduction
9.2 Financial Institutions (Banks & Nbfc)
9.2.1 Market Estimates and Forecasts, 2017 - 2024 (USD Million)
9.2.2 Market Estimates and Forecasts, By Region, 2017 - 2024 (USD Million)
9.3 Collection Agencies
9.3.1 Market Estimates and Forecasts, 2017 - 2024 (USD Million)
9.3.2 Market Estimates and Forecasts, By Region, 2017 - 2024 (USD Million)
9.4 Healthcare
9.4.1 Market Estimates and Forecasts, 2017 - 2024 (USD Million)
9.4.2 Market Estimates and Forecasts, By Region, 2017 - 2024 (USD Million)
9.5 Government
9.5.1 Market Estimates and Forecasts, 2017 - 2024 (USD Million)
9.5.2 Market Estimates and Forecasts, By Region, 2017 - 2024 (USD Million)
9.6 Telecom and Utilities
9.6.1 Market Estimates and Forecasts, 2017 - 2024 (USD Million)
9.6.2 Market Estimates and Forecasts, By Region, 2017 - 2024 (USD Million)
9.7 Others (Real Estate, and Retail)
9.7.1 Market Estimates and Forecasts, 2017 - 2024 (USD Million)
9.7.2 Market Estimates and Forecasts, By Region, 2017 - 2024 (USD Million)
10 Debt Collection Software Market, By Region
10.1 Introduction
10.2 North America
10.2.1 Market Estimates and Forecasts By Component, 2017 - 2024 (USD Million)
10.2.2 Market Estimates and Forecasts, By Deployment Mode, 2017 - 2024 (USD Million)
10.2.3 Market Estimates and Forecasts, By Organization Size, 2017 - 2024 (USD Million)
10.2.4 Market Estimates and Forecasts, By User Type, 2017 - 2024 (USD Million)
10.2.5 Market Estimates and Forecasts, By Country, 2017 - 2024 (USD Million)
10.2.5.1 US
10.2.5.1.1 Market Estimates and Forecasts By Component, 2017 - 2024 (USD Million)
10.2.5.1.2 Market Estimates and Forecasts, By Deployment Mode, 2017 - 2024 (USD Million)
10.2.5.1.3 Market Estimates and Forecasts, By Organization Size, 2017 - 2024 (USD Million)
10.2.5.1.4 Market Estimates and Forecasts, By User Type, 2017 - 2024 (USD Million)
10.2.5.2 Canada
10.2.5.2.1 Market Estimates and Forecasts By Component, 2017 - 2024 (USD Million)
10.2.5.2.2 Market Estimates and Forecasts, By Deployment Mode, 2017 - 2024 (USD Million)
10.2.5.2.3 Market Estimates and Forecasts, By Organization Size, 2017 - 2024 (USD Million)
10.2.5.2.4 Market Estimates and Forecasts, By User Type, 2017 - 2024 (USD Million)
10.3 Europe
10.3.1 Market Estimates and Forecasts By Component, 2017 - 2024 (USD Million)
10.3.2 Market Estimates and Forecasts, By Deployment Mode, 2017 - 2024 (USD Million)
10.3.3 Market Estimates and Forecasts, By Organization Size, 2017 - 2024 (USD Million)
10.3.4 Market Estimates and Forecasts, By User Type, 2017 - 2024 (USD Million)
10.3.5 Market Estimates and Forecasts, By Country, 2017 - 2024 (USD Million)
10.3.5.1 UK
10.3.5.1.1 Market Estimates and Forecasts By Component, 2017 - 2024 (USD Million)
10.2.6.1.2 Market Estimates and Forecasts, By Deployment Mode, 2017 - 2024 (USD Million)
10.2.6.1.3 Market Estimates and Forecasts, By Organization Size, 2017 - 2024 (USD Million)
10.2.6.1.4 Market Estimates and Forecasts, By User Type, 2017 - 2024 (USD Million)
10.3.5.2 Germany
10.3.5.2.1 Market Estimates and Forecasts By Component, 2017 - 2024 (USD Million)
10.3.5.2.2 Market Estimates and Forecasts, By Deployment Mode, 2017 - 2024 (USD Million)
10.3.5.2.3 Market Estimates and Forecasts, By Organization Size, 2017 - 2024 (USD Million)
10.3.5.2.4 Market Estimates and Forecasts, By User Type, 2017 - 2024 (USD Million)
10.3.5.3 France
10.3.5.3.1 Market Estimates and Forecasts By Component, 2017 - 2024 (USD Million)
10.3.5.3.2 Market Estimates and Forecasts, By Deployment Mode, 2017 - 2024 (USD Million)
10.3.5.3.3 Market Estimates and Forecasts, By Organization Size, 2017 - 2024 (USD Million)
10.3.5.3.4 Market Estimates and Forecasts, By User Type, 2017 - 2024 (USD Million)
10.3.5.4 Rest of Europe
10.3.5.4.1 Market Estimates and Forecasts By Component, 2017 - 2024 (USD Million)
10.3.5.4.2 Market Estimates and Forecasts, By Deployment Mode, 2017 - 2024 (USD Million)
10.3.5.4.3 Market Estimates and Forecasts, By Organization Size, 2017 - 2024 (USD Million)
10.3.5.4.4 Market Estimates and Forecasts, By User Type, 2017 - 2024 (USD Million)
10.4 Asia Pacific
10.4.1 Market Estimates and Forecasts By Component, 2017 - 2024 (USD Million)
10.4.2 Market Estimates and Forecasts, By Deployment Mode, 2017 - 2024 (USD Million)
10.4.3 Market Estimates and Forecasts, By Organization Size, 2017 - 2024 (USD Million)
10.4.4 Market Estimates and Forecasts, By User Type, 2017 - 2024 (USD Million)
10.4.5 Market Estimates and Forecasts, By Country, 2017 - 2024 (USD Million)
10.4.5.1 ANZ
10.4.5.1.1 Market Estimates and Forecasts By Component, 2017 - 2024 (USD Million)
10.4.5.1.2 Market Estimates and Forecasts, By Deployment Mode, 2017 - 2024 (USD Million)
10.4.5.1.3 Market Estimates and Forecasts, By Organization Size, 2017 - 2024 (USD Million)
10.4.5.1.4 Market Estimates and Forecasts, By User Type, 2017 - 2024 (USD Million)
10.4.5.2 Japan
10.4.5.2.1 Market Estimates and Forecasts By Component, 2017 - 2024 (USD Million)
10.4.5.2.2 Market Estimates and Forecasts, By Deployment Mode, 2017 - 2024 (USD Million)
10.4.5.2.3 Market Estimates and Forecasts, By Organization Size, 2017 - 2024 (USD Million)
10.4.5.2.4 Market Estimates and Forecasts, By User Type, 2017 - 2024 (USD Million)
10.4.5.3 China
10.4.5.3.1 Market Estimates and Forecasts By Component, 2017 - 2024 (USD Million)
10.4.5.3.2 Market Estimates and Forecasts, By Deployment Mode, 2017 - 2024 (USD Million)
10.4.5.3.3 Market Estimates and Forecasts, By Organization Size, 2017 - 2024 (USD Million)
10.4.5.3.4 Market Estimates and Forecasts, By User Type, 2017 - 2024 (USD Million)
10.4.5.4 Rest of APAC
10.4.5.4.1 Market Estimates and Forecasts By Component, 2017 - 2024 (USD Million)
10.4.5.4.2 Market Estimates and Forecasts, By Deployment Mode, 2017 - 2024 (USD Million)
10.4.5.4.3 Market Estimates and Forecasts, By Organization Size, 2017 - 2024 (USD Million)
10.4.5.4.4 Market Estimates and Forecasts, By User Type, 2017 - 2024 (USD Million)
10.5 Middle East and Africa
10.5.1 Market Estimates and Forecasts By Component, 2017 - 2024 (USD Million)
10.5.2 Market Estimates and Forecasts, By Deployment Mode, 2017 - 2024 (USD Million)
10.5.3 Market Estimates and Forecasts, By Organization Size, 2017 - 2024 (USD Million)
10.5.4 Market Estimates and Forecasts, By User Type, 2017 - 2024 (USD Million)
10.5.5 Market Estimates and Forecasts, By Country, 2017 - 2024 (USD Million)
10.5.5.1 KSA
10.5.5.1.1 Market Estimates and Forecasts By Component, 2017 - 2024 (USD Million)
10.5.5.1.2 Market Estimates and Forecasts, By Deployment Mode, 2017 - 2024 (USD Million)
10.5.5.1.3 Market Estimates and Forecasts, By Organization Size, 2017 - 2024 (USD Million)
10.5.5.1.4 Market Estimates and Forecasts, By User Type, 2017 - 2024 (USD Million)
10.5.5.2 South Africa
10.5.5.2.1 Market Estimates and Forecasts By Component, 2017 - 2024 (USD Million)
10.5.5.2.2 Market Estimates and Forecasts, By Deployment Mode, 2017 - 2024 (USD Million)
10.5.5.2.3 Market Estimates and Forecasts, By Organization Size, 2017 - 2024 (USD Million)
10.5.5.2.4 Market Estimates and Forecasts, By User Type, 2017 - 2024 (USD Million)
10.5.5.3 UAE
10.5.5.3.1 Market Estimates and Forecasts By Component, 2017 - 2024 (USD Million)
10.5.5.3.2 Market Estimates and Forecasts, By Deployment Mode, 2017 - 2024 (USD Million)
10.5.5.3.3 Market Estimates and Forecasts, By Organization Size, 2017 - 2024 (USD Million)
10.5.5.3.4 Market Estimates and Forecasts, By User Type, 2017 - 2024 (USD Million)
10.5.5.4 Rest of MEA
10.5.5.4.1 Market Estimates and Forecasts By Component, 2017 - 2024 (USD Million)
10.5.5.4.2 Market Estimates and Forecasts, By Deployment Mode, 2017 - 2024 (USD Million)
10.5.5.4.3 Market Estimates and Forecasts, By Organization Size, 2017 - 2024 (USD Million)
10.5.5.4.4 Market Estimates and Forecasts, By User Type, 2017 - 2024 (USD Million)
10.6 Latin America
10.6.1 Market Estimates and Forecasts By Component, 2017 - 2024 (USD Million)
10.6.2 Market Estimates and Forecasts, By Deployment Mode, 2017 - 2024 (USD Million)
10.6.3 Market Estimates and Forecasts, By Organization Size, 2017 - 2024 (USD Million)
10.6.4 Market Estimates and Forecasts, By User Type, 2017 - 2024 (USD Million)
10.6.5 Market Estimates and Forecasts, By Country, 2017 - 2024 (USD Million)
10.6.5.1 Brazil
10.6.5.1.1 Market Estimates and Forecasts By Component, 2017 - 2024 (USD Million)
10.6.5.1.2 Market Estimates and Forecasts, By Deployment Mode, 2017 - 2024 (USD Million)
10.6.5.1.3 Market Estimates and Forecasts, By Organization Size, 2017 - 2024 (USD Million)
10.6.5.1.4 Market Estimates and Forecasts, By User Type, 2017 - 2024 (USD Million)
10.6.5.2 Mexico
10.6.5.2.1 Market Estimates and Forecasts By Component, 2017 - 2024 (USD Million)
10.6.5.2.2 Market Estimates and Forecasts, By Deployment Mode, 2017 - 2024 (USD Million)
10.6.5.2.3 Market Estimates and Forecasts, By Organization Size, 2017 - 2024 (USD Million)
10.6.5.2.4 Market Estimates and Forecasts, By User Type, 2017 - 2024 (USD Million)
10.6.5.3 Rest of Latin America
10.6.5.3.1 Market Estimates and Forecasts By Component, 2017 - 2024 (USD Million)
10.6.5.3.2 Market Estimates and Forecasts, By Deployment Mode, 2017 - 2024 (USD Million)
10.6.5.3.3 Market Estimates and Forecasts, By Organization Size, 2017 - 2024 (USD Million)
10.6.5.3.4 Market Estimates and Forecasts, By User Type, 2017 - 2024 (USD Million)
11 Competitive Landscape
11.1 Overview
11.2 Competitive Scenario
11.2.1 New Product/Solution Launches and Enhancements
11.2.2 Business Expansions
11.2.3 Acquisitions
11.2.4 Partnerships and Collaborations
11.3 Microquadrant Overview
11.2.1 Visionary Leaders
11.2.2 Dynamic Differentiators
11.2.3 Innovators
11.2.4 Emerging Companies
12 Company Profiles
12.1 Introduction
12.2 FIS
12.3 CGI
12.4 Experian
12.5 Fico
12.6 Transunion
12.7 Pegasystems
12.8 Temenos
12.9 Intellect Design Arena
12.10 Nucleus Software
12.11 Chetu
12.12 Ameyo
12.13 Exus
12.14 Kuhlekt
12.15 Loxon Solutions
12.16 Katabat
13 Appendix
13.1 Discussion Guide
13.2 Knowledge Store: Marketsandmarkets� Subscription Portal
13.3 Introduction RT: Real-Time Market Intelligence
13.4 Available Customizations
13.5 Related Reports
13.6 Author Details
List of Tables (143 Tables)
Table 1 United States Dollar Exchange Rate, 2016�2018
Table 2 Factor Analysis
Table 3 Debt Collection Software Market Size, By Component, 2017�2024 (USD Million)
Table 4 Software: Market Size By Region, 2017�2024 (USD Million)
Table 5 Services: Market Size By Type, 2017�2024 (USD Million)
Table 6 Services: Market Size By Region, 2017�2024 (USD Million)
Table 7 Consulting Market Size, By Region, 2017�2024 (USD Million)
Table 8 Integration and Implementation Market Size, By Region, 2017�2024 (USD Million)
Table 9 Training and Support Market Size, By Region, 2017�2024 (USD Thousand)
Table 10 Debt Collection Software Market Size, By Organization Size, 2017�2024 (USD Million)
Table 11 Large Enterprises: Market Size By Region, 2017�2024 (USD Million)
Table 12 Small and Medium-Sized Enterprises: Market Size By Region, 2017�2024 (USD Million)
Table 13 Debt Collection Software Market Size, By Deployment Type, 2017�2024 (USD Million)
Table 14 On-Premises: Market Size By Region, 2017�2024 (USD Million)
Table 15 Cloud: Market Size By Region, 2017�2024 (USD Million)
Table 16 Debt Collection Software Market Size, By User Type, 2017�2024 (USD Million)
Table 17 Financial Institutions: Market Size By Region, 2017�2024 (USD Million)
Table 18 Collection Agencies: Market Size By Region, 2017�2024 (USD Million)
Table 19 Healthcare: Market Size By Region, 2017�2024 (USD Million)
Table 20 Government: Market Size By Region, 2017�2024 (USD Thousand)
Table 21 Telecom and Utilities: Market Size By Region, 2017�2024 (USD Million)
Table 22 Others: Market Size By Region, 2017�2024 (USD Thousand)
Table 23 Debt Collection Software Market Size, By Region, 2017�2024 (USD Million)
Table 24 North America: Market Size By Component, 2017�2024 (USD Million)
Table 25 North America: Market Size By Service, 2017�2024 (USD Million)
Table 26 North America: Market Size By Organization Size, 2017�2024 (USD Million)
Table 27 North America: Market Size By Deployment Type, 2017�2024 (USD Million)
Table 28 North America: Market Size By User Type, 2017�2024 (USD Million)
Table 29 North America: Market Size By Country, 2017�2024 (USD Million)
Table 30 US: Market Size By Component, 2017�2024 (USD Million)
Table 31 US: Market Size By Service, 2017�2024 (USD Million)
Table 32 US: Market Size By Organization Size, 2017�2024 (USD Million)
Table 33 US: Market Size By Deployment Type, 2017�2024 (USD Million)
Table 34 US: Market Size By User Type, 2017�2024 (USD Million)
Table 35 Canada: Market Size By Component, 2017�2024 (USD Million)
Table 36 Canada: Market Size By Service, 2017�2024 (USD Million)
Table 37 Canada: Market Size By Organization Size, 2017�2024 (USD Million)
Table 38 Canada: Market Size By Deployment Type, 2017�2024 (USD Million)
Table 39 Canada: Market Size By User Type, 2017�2024 (USD Million)
Table 40 Europe: Debt Collection Software Market Size, By Component, 2017�2024 (USD Million)
Table 41 Europe: Market Size By Service, 2017�2024 (USD Million)
Table 42 Europe: Market Size By Organization Size, 2017�2024 (USD Million)
Table 43 Europe: Market Size By Deployment Type, 2017�2024 (USD Million)
Table 44 Europe: Market Size By User Type, 2017�2024 (USD Million)
Table 45 Europe: Market Size By Country, 2017�2024 (USD Million)
Table 46 UK: Market Size By Component, 2017�2024 (USD Million)
Table 47 UK: Market Size By Service, 2017�2024 (USD Million)
Table 48 UK: Market Size By Organization Size, 2017�2024 (USD Million)
Table 49 UK: Market Size By Deployment Type, 2017�2024 (USD Million)
Table 50 UK: Market Size By User Type, 2017�2024 (USD Million)
Table 51 Germany: Market Size By Component, 2017�2024 (USD Million)
Table 52 Germany: Market Size By Service, 2017�2024 (USD Million)
Table 53 Germany: Market Size By Organization Size, 2017�2024 (USD Million)
Table 54 Germany: Market Size By Deployment Type, 2017�2024 (USD Million)
Table 55 Germany: Market Size By User Type, 2017�2024 (USD Million)
Table 56 France: Market Size By Component, 2017�2024 (USD Million)
Table 57 France: Market Size By Service, 2017�2024 (USD Million)
Table 58 France: Market Size By Organization Size, 2017�2024 (USD Million)
Table 59 France: Market Size By Deployment Type, 2017�2024 (USD Million)
Table 60 France: Market Size By User Type, 2017�2024 (USD Million)
Table 61 Rest of Europe: Market Size By Component, 2017�2024 (USD Million)
Table 62 Rest of Europe: Market Size By Service, 2017�2024 (USD Million)
Table 63 Rest of Europe: Market Size By Organization Size, 2017�2024 (USD Million)
Table 64 Rest of Europe: Market Size By Deployment Type, 2017�2024 (USD Million)
Table 65 Rest of Europe: Market Size By User Type, 2017�2024 (USD Million)
Table 66 Asia Pacific: Debt Collection Software Market Size, By Component, 2017�2024 (USD Million)
Table 67 Asia Pacific: Market Size By Service, 2017�2024 (USD Million)
Table 68 Asia Pacific: Market Size By Organization Size, 2017�2024 (USD Million)
Table 69 Asia Pacific: Market Size By Deployment Type, 2017�2024 (USD Million)
Table 70 Asia Pacific: Market Size By User Type, 2017�2024 (USD Million)
Table 71 Asia Pacific: Debt Collection Software Size, By Country, 2017�2024 (USD Million)
Table 72 ANZ: Market Size By Component, 2017�2024 (USD Million)
Table 73 ANZ: Market Size By Service, 2017�2024 (USD Million)
Table 74 ANZ: Market Size By Organization Size, 2017�2024 (USD Million)
Table 75 ANZ: Market Size By Deployment Type, 2017�2024 (USD Million)
Table 76 ANZ: Market Size By User Type, 2017�2024 (USD Million)
Table 77 Japan: Market Size By Component, 2017�2024 (USD Million)
Table 78 Japan: Market Size By Service, 2017�2024 (USD Million)
Table 79 Japan: Market Size By Organization Size, 2017�2024 (USD Million)
Table 80 Japan: Market Size By Deployment Type, 2017�2024 (USD Million)
Table 81 Japan: Market Size By User Type, 2017�2024 (USD Million)
Table 82 China: Market Size By Component, 2017�2024 (USD Million)
Table 83 China: Market Size By Service, 2017�2024 (USD Million)
Table 84 China: Market Size By Organization Size, 2017�2024 (USD Million)
Table 85 China: Market Size By Deployment Type, 2017�2024 (USD Million)
Table 86 China: Market Size By User Type, 2017�2024 (USD Million)
Table 87 Rest of APAC: Market Size By Component, 2017�2024 (USD Million)
Table 88 Rest of APAC: Market Size By Service, 2017�2024 (USD Million)
Table 89 Rest of APAC: Market Size By Organization Size, 2017�2024 (USD Million)
Table 90 Rest of APAC: Market Size By Deployment Type, 2017�2024 (USD Million)
Table 91 Rest of APAC: Market Size By User Type, 2017�2024 (USD Million)
Table 92 Middle East and Africa: Debt Collection Software Market Size, By Component, 2017�2024 (USD Million)
Table 93 Middle East and Africa: Market Size By Service, 2017�2024 (USD Thousand)
Table 94 Middle East and Africa: Market Size By Organization Size, 2017�2024 (USD Million)
Table 95 Middle East and Africa: Market Size By Deployment Type, 2017�2024 (USD Million)
Table 96 Middle East and Africa: Market Size By User Type, 2017�2024 (USD Thousand)
Table 97 Middle East and Africa: Market Size By Country, 2017�2024 (USD Million)
Table 98 KSA: Market Size By Component, 2017�2024 (USD Million)
Table 99 KSA: Market Size By Service, 2017�2024 (USD Million)
Table 100 KSA: Market Size By Organization Size, 2017�2024 (USD Million)
Table 101 KSA: Market Size By Deployment Type, 2017�2024 (USD Million)
Table 102 KSA: Market Size By User Type, 2017�2024 (USD Million)
Table 103 South Africa: Market Size By Component, 2017�2024 (USD Million)
Table 104 South Africa: Market Size By Service, 2017�2024 (USD Million)
Table 105 South Africa: Market Size By Organization Size, 2017�2024 (USD Million)
Table 106 South Africa: Market Size By Deployment Type, 2017�2024 (USD Million)
Table 107 South Africa: Market Size By User Type, 2017�2024 (USD Million)
Table 108 UAE: Market Size By Component, 2017�2024 (USD Million)
Table 109 UAE: Market Size By Service, 2017�2024 (USD Million)
Table 110 UAE: Market Size By Organization Size, 2017�2024 (USD Million)
Table 111 UAE: Market Size By Deployment Type, 2017�2024 (USD Million)
Table 112 UAE: Market Size By User Type, 2017�2024 (USD Million)
Table 113 Rest of MEA: Market Size By Component, 2017�2024 (USD Million)
Table 114 Rest of MEA: Market Size By Service, 2017�2024 (USD Million)
Table 115 Rest of MEA: Market Size By Organization Size, 2017�2024 (USD Million)
Table 116 Rest of MEA: Market Size By Deployment Type, 2017�2024 (USD Million)
Table 117 Rest of MEA: Market Size By User Type, 2017�2024 (USD Million)
Table 118 Latin America: Debt Collection Software Market Size, By Component, 2017�2024 (USD Million)
Table 119 Latin America: Market Size By Service, 2017�2024 (USD Thousand)
Table 120 Latin America: Market Size By Organization Size, 2017�2024 (USD Million)
Table 121 Latin America: Market Size By Deployment Type, 2017�2024 (USD Million)
Table 122 Latin America: Market Size By User Type, 2017�2024 (USD Thousand)
Table 123 Latin America: Market Size By Country, 2017�2024 (USD Million)
Table 124 Brazil: Market Size By Component, 2017�2024 (USD Million)
Table 125 Brazil: Market Size By Service, 2017�2024 (USD Million)
Table 126 Brazil: Market Size By Organization Size, 2017�2024 (USD Million)
Table 127 Brazil: Market Size By Deployment Type, 2017�2024 (USD Million)
Table 128 Brazil: Market Size By User Type, 2017�2024 (USD Million)
Table 129 Mexico: Market Size By Component, 2017�2024 (USD Million)
Table 130 Mexico: Market Size By Service, 2017�2024 (USD Million)
Table 131 Mexico: Market Size By Organization Size, 2017�2024 (USD Million)
Table 132 Mexico: Market Size By Deployment Type, 2017�2024 (USD Million)
Table 133 Mexico: Market Size By User Type, 2017�2024 (USD Million)
Table 134 Rest of LATAM: Market Size By Component, 2017�2024 (USD Million)
Table 135 Rest of LATAM: Market Size By Service, 2017�2024 (USD Million)
Table 136 Rest of LATAM: Market Size By Organization Size, 2017�2024 (USD Million)
Table 137 Rest of LATAM: Market Size By Deployment Type, 2017�2024 (USD Million)
Table 138 Rest of LATAM: Market Size By User Type, 2017�2024 (USD Million)
Table 139 New Product/Solution Launches and Product Enhancements, 2017�2019
Table 140 Business Expansions, 2017�2018
Table 141 Acquisitions, 2018�2019
Table 142 Partnerships and Agreements, 2017�2019
Table 143 Evaluation Criteria
List of Figures (32 Figures)
Figure 1 Debt Collection Software Market: Research Design
Figure 2 Market Top-Down and Bottom-Up Approaches
Figure 3 On-Premises Segment to Account for a Higher Share in the Market in 2019
Figure 4 North America to Account for the Highest Share of the Market in 2019
Figure 5 Growing Focus of Organizations Toward Automating Collection Process to Drive the Growth
Figure 6 Financial Institutions Segment and the United States to Account for the Highest Shares
Figure 7 Debt Collection Software Market in Australia and New Zealand to Grow at the Highest Rat
Figure 8 Drivers, Restraints, Opportunities, and Challenges
Figure 9 Services Segment to Grow at a Higher CAGR During the Forecast Period
Figure 10 Integration and Implementation Segment to Grow at the Highest CAGR During the Forecast
Figure 11 Small and Medium-Sized Enterprises Segment to Grow at a Higher CAGR During the Forecas
Figure 12 Cloud Segment to Grow at a Higher CAGR During the Forecast Period
Figure 13 Telecom and Utilities Segment to Grow at the Highest CAGR During the Forecast Period
Figure 14 Asia Pacific to Witness Significant Growth During the Forecast Period
Figure 15 North America: Market Snapshot
Figure 16 Asia Pacific: Market Snapshot
Figure 17 Key Developments By the Leading Players in the Debt Collection Software Market, 2017�2
Figure 18 Debt Collection Software Market (Global) Competitive Leadership Mapping, 2019
Figure 19 CGI: Company Snapshot
Figure 20 CGI: SWOT Analysis
Figure 21 Experian: Company Snapshot
Figure 22 Experian: SWOT Analysis
Figure 23 FIS: Company Snapshot
Figure 24 FIS: SWOT Analysis
Figure 25 Fico: Company Snapshot
Figure 26 Fico: SWOT Analysis
Figure 27 TransUnion: Company Snapshot
Figure 28 TransUnion: SWOT Analysis
Figure 29 Intellect Design Arena: Company Snapshot
Figure 30 Nucleus Software: Company Snapshot
Figure 31 Pegasystems: Company Snapshot
Figure 32 Temenos: Company Snapshot
The study involved four major activities in estimating the current market size for the debt collection software market. Exhaustive secondary research was done to collect information on the debt collection software market. The next step was to validate these findings, assumptions, and sizing with industry experts across the value chain using primary research. Both top-down and bottom-up approaches were employed to estimate the complete market size. Thereafter, the market breakup and data triangulation procedures were used to estimate the market size of the segments and subsegments of the market.
Secondary Research
In the secondary research process, various secondary sources, such as D&B Hoovers, Bloomberg BusinessWeek, and Factiva, have been referred to, to identify and collect information for this study. These secondary sources included annual reports, press releases and investor presentations of companies, whitepapers, certified publications and articles by recognized authors, gold standard and silver standard websites, regulatory bodies, trade directories, and databases.
Primary Research
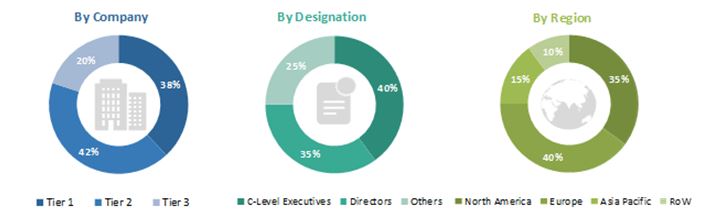
The debt collection software market comprises several stakeholders, such as debt collection software vendors, cloud solution providers, system integrators, professional service providers, resellers and distributors, government and research organizations, enterprise users, venture capitalists, private equity firms, and startup companies. The demand side of the debt collection software market consists of corporate users, such as financial institutions, collection agencies, healthcare, government, telecom and utilities, and others (real estate and retail). The supply-side includes debt collection software providers, offering debt collection software and services. Various primary sources from both the supply and demand sides of the market were interviewed to obtain qualitative and quantitative information. Following is the breakup of the primary respondents:
To know about the assumptions considered for the study, download the pdf brochure
Debt Collection Software Market Size Estimation
Both top-down and bottom-up approaches were used to estimate and validate the total size of the debt collection software market. These methods were also used extensively to estimate the size of various subsegments in the market. The research methodology used to estimate the market size includes the following:
- The key players in the industry and markets were identified through extensive secondary research.
- The industry�s supply chain and market size, in terms of value, were determined through primary and secondary research processes.
- All percentage shares, splits, and breakups were determined using secondary sources and verified through primary sources.
Data Triangulation
After arriving at the overall market size using the market size estimation processes as explained above, the market was split into several segments and subsegments. The data triangulation and market breakup procedures were employed, wherever applicable to complete the overall market engineering process and arrive at the exact statistics of each market segment and subsegments. The data was triangulated by studying various factors and trends from both the demand and supply sides.
Report Objectives
- To define, describe, and forecast the debt collection software market by component (software and services), deployment type, organization size, user type, and region
- To provide detailed information about the major factors (drivers, restraints, opportunities, and industry-specific challenges) influencing the growth of the debt collection software market
- To analyze the market with respect to individual growth trends, prospects, and contributions to the overall market
- To forecast the market size of five main regions, namely, North America, Europe, Asia Pacific (APAC), Middle East and Africa (MEA), and Latin America
- To analyze the opportunities in the market for stakeholders by identifying the high-growth segments of the market
- To profile the key players in the market and comprehensively analyze their core competencies in each subsegment
- To analyze the competitive developments, such as agreements, partnerships, acquisitions, and product/solution launches in the debt collection software market
Available Customizations
Along with the market data, MarketsandMarkets offers customizations as per the company�s specific needs. The following customization options are available for the report:
Product Analysis
- Product matrix gives a detailed comparison of the product portfolio of each company
Geographic Analysis
- Further breakup of the European debt collection software market into countries
- Further breakup of the APAC market into countries
- Further breakup of the MEA market into countries
- Further breakup of the Latin American market into countries
Company Information
- Detailed analysis and profiling of additional market players


Growth opportunities and latent adjacency in Debt Collection Software Market