Degaussing System Market

Degaussing System Market by Vessel Type (Small Vessel, Medium Vessel, Large Vessel), Solution (Ranging, Degaussing, Deperming), End User (OEM, Aftermarket & Services) and Region- Global Forecast to 2027

Report Code: AS 6411 Jan, 2023, by marketsandmarkets.com

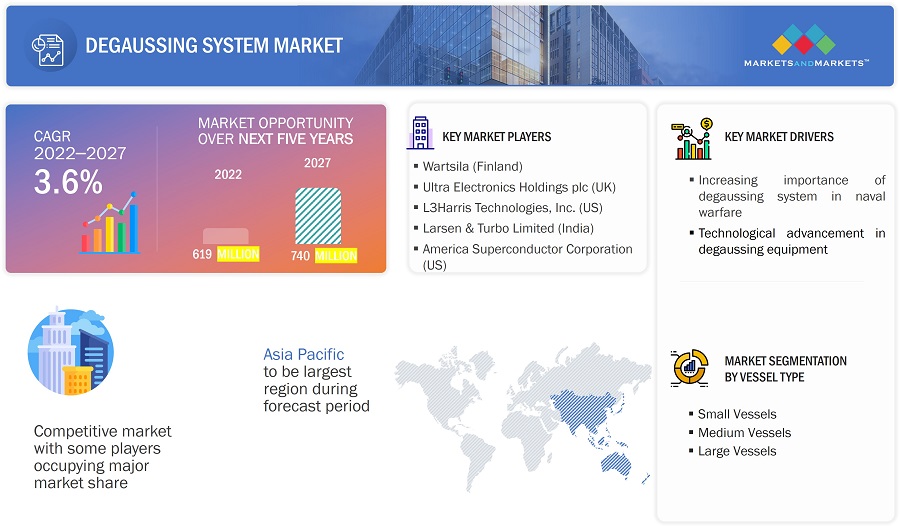
The Degaussing Systems Market size is projected to grow from USD 619 Million in 2022 to USD 740 Million by 2027, at a CAGR of 3.6% from 2022 to 2027.

A degaussing system enables neutralizing the ship's magnetic field and ensures that the magnetic field close to the ship is, as nearly as possible, just the same if the ship were not there. This, in turn, reduces the possibility of being targeted and increases the security of the ship and personnel.

Present day warships have built-in degaussing systems. The degaussing system aboard a naval vessel consists of interconnected coils of electrical cables in different locations within the hull, with a direct power source to energize the coils and a control system, via switchboards, to control the amount and polarity of current through the coils.
Degaussing System Market

Degaussing System Market Forecast to 2027

To know about the assumptions considered for the study, Request for Free Sample Report

Degaussing systems Market Dynamics:

Driver: Increasing importance of degaussing systems in naval warfare

Naval tactics, distinct from naval strategies, are methods to engage and defeat enemy ships in sea battles. The central concept of naval warfare is the battlespace, a zone around the naval force within which the commander can confidently detect, track, engage, and destroy threats before they pose a danger.

Ships and warships are detected due to their easy visibility and magnetic signatures. Submarines play a strategic role in naval tactics and are more vulnerable to mines, as they operate underwater where mines are placed. This vulnerability has increased the demand for degaussing and deperming systems used to demagnetize the magnetic signatures of submarines. There has been an increase in submarine deliveries in developing countries, such as India, China, and South Korea, which, in turn, has led to the increased use of degaussing and deperming systems. In June 2021, the defense ministry of India intended to execute an old plan to procure six units of conventional submarines. This proposed plan will expect to create a competition among leading shipbuilders namely Larsen & Toubro Ltd (India) and Mazagon Dock Shipbuilders Limited (India).

Restraint: Use of composite materials in warships

Traditionally, warships were made of stainless steel. New carbon fiber composite superstructures imported from the Kockums shipyard (Sweden) assist in developing lightweight warships. However, the enemy easily detects such lightweight warships. Stealth is the most important feature of composite materials, as they are less susceptible to detection, unlike steel. Warships that are likely to use new nonmagnetic materials include offshore patrol vessels (OPVs), fast attack crafts (FACs), and corvettes.

The use of composite materials in building warships hinders the influence of the Earth’s magnetic field, thereby restricting the ability of sea mines to detect these vessels. Thus, using composite materials is likely to restrain the growth of the Degaussing System Industry.

Opportunity: Increase in maritime warfare exercises

A maritime war exercise trains naval forces to explore the warfare effects or test strategies without actual combat. It is a full-scale rehearsal of navy maneuvers as a warfare practice. A maritime war exercise is a joint or combined exercise practiced between or more nations. Over the last decade, the number of maritime warfare exercises has been increasing exponentially, owing to the need to strengthen the combat capabilities of naval forces. For instance, in June 2022, Rim of the Pacific (RIMPAC), the world’s largest international biennial maritime warfare exercise, witnessed participation from 27 countries, including India. Such exercises have increased the use of degaussing, ranging, and deperming systems to demagnetize or nullify the magnetic field of naval vessels and protect them from sea mines.

Challenge: High cost of retrofit, installation, and calibration services

Naval vessels are high-technology platforms. Degaussing systems in these vessels encompass high-technology components and subcomponents, including degaussing control units, magnetometers, bipolar amplifiers, DC generators, and sensors. These components and subcomponents contribute to the high cost of degaussing systems.

Rapid technological developments have led to the obsolescence of older technologies. The retrofitting of naval vessels involves extensive system checks and replacement of older components with newer ones. During its life cycle, a naval vessel undergoes various refits and upgrades. Additionally, retrofit, installation, and calibration services are done annually, contributing to increased expenditure. Countries allocate huge budgets for retrofit costs to maintain their technological lead and extend the life of their naval vessels.

Based on Solution, the ranging segment witness strong growth during 2022-2027

Based on solution, the degaussing systems market has been segmented into ranging, degaussing and deperming. Ranging segment further subdivided into fixed and onboard. The onboard offering subsegment of the ranging solution segment has been classified into aerial ranging devices, transmitted data buoys, sensors, magnetometers, coils, software, and monitors. Onboard ranging of naval vessels is performed away from onshore.

Based on End User, Aftermarket witness significant growth during forecast period

Based on end user, the degaussing systems market has been segmented into OEM, aftermarket and services. In the aftermarket, companies offer complete maintenance, repair, and overhaul services for degaussing systems. These companies specialize in both, metallic and composite repair techniques used in degaussing systems. For instance, damaged components of degaussing systems such as conductors and degaussing coils are sent to service centers for maintenance, repair, and overhaul. Aftermarket also offers over-the-counter products in cases, wherein components of degaussing systems are damaged beyond repair.

Based on end user, OEM segment registered largest share in base year

Based on end user, the degaussing systems market has been classified into OEM, aftermarket, and services. Original Equipment Manufacturers (OEMs) offer line-fit and retrofit options for naval vessels, thereby saving the time consumed in the installation of degaussing systems in ships post their delivery. They also eliminate the requirement to maintain a separate workforce for the installation of retrofit components in naval vessels.

The North America region is projected to Grow at highest CAGR during the forecast period

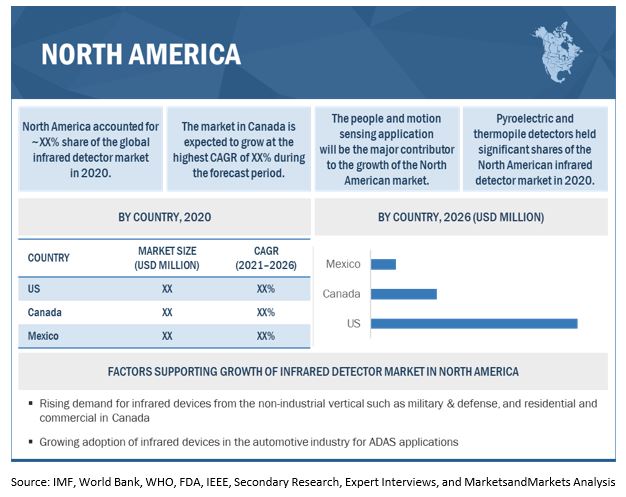
The growth of the North America degaussing system market can be attributed to increased investments in defense equipment and naval warfare capabilities and the implementation of network-centric infrastructure across this region. Among American countries, the US is projected to lead the degaussing system market in the North American region. The growth of the degaussing system market in the US can be attributed to increased military spending by the US government and the expansion of the shipbuilding industry. The US government is broadening its defense capabilities by funding new technologies, which include ship protection equipment, UAVs, and drone systems that safeguard the US naval fleet.
Infrared Detector Market by Region

Degaussing System Market by Region

To know about the assumptions considered for the study, download the pdf brochure

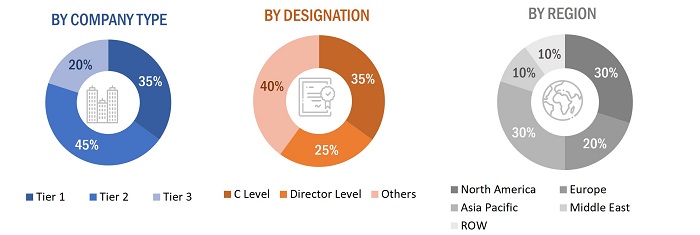
The break-up of the profiles of primary participants in the Degaussing systems Market is as follows:

  • By Company Type: Tier 1–35%; Tier 2–45%; and Tier 3–20%
  • By Designation: C Level Executives–35%; Directors–25%; and Others–40%
  • By Region: Asia Pacific–30%; North America–30%; Europe–20%; Middle East–10%; and Rest of the World–10%

Key Market Players

The major players in the Degaussing Systems Companies are Wartsila (Finland), Larsen & Turbo Limited (India), Ultra Electronics Holdings plc (UK), L3Harris Technologies, Inc. (US), and American Superconductor Corporation (US). These players have adopted various growth strategies such as contracts, acquisitions, agreements, expansions, investments, and new product launches to further expand their presence in the degaussing systems market.

Get online access to the report on the World's First Market Intelligence Cloud

  • Easy to Download Historical Data & Forecast Numbers
  • Company Analysis Dashboard for high growth potential opportunities
  • Research Analyst Access for customization & queries
  • Competitor Analysis with Interactive dashboard
  • Latest News, Updates & Trend analysis
Request Sample

Scope of the Report

Report Metric

Details

Growth Rate

3.6%

Estimated Market Size in 2022

USD 619 Million

Projected Market Size in 2027

USD 740 Million

Market size available for years

2019-2027

Base year considered

2021

Forecast period

2022-2027

Forecast units

Value (USD Million)

Segments covered

By Vessel Type, By Solution, By End User, and By Region

Geographies covered

North America, Asia Pacific, Europe, and Rest of the World

Companies covered

Wartsila (Finland), Ultra Electronics Holdings plc (UK), L3Harris Technologies, Inc. (US), Larsen & Turbo Limited (India), and American Superconductor Corporation (US)

Companies covered (Degaussing systems market start-ups and degaussing system market ecosystem)

ECA Group (France), Dayatech Merin Sdn Bhd, IFEN S.p.A. (Italy), STL Systems AG (Switzerland), DA-Group (Finland)

Degaussing System Market Highlights

This research report categorizes the degaussing system market based on vessel type, solution, end user, and region

Aspect

Details

By Vessel Type

  • Small Vessel
    • OPV
    • MCMV / Minesweeper
    • FAC (Fast attack Craft)
  • Medium Vessel
    • Submarines
    • Corvettes
    • Destroyers
  • Large Vessel
    • Frigates
    • Aircraft Carriers
    • Amphibious Vessels

By Solution

  • Ranging
    • Fixed
    • Onboard
      • Transmitted Data Buoys
      • Magnetometers
      • Monitors
      • Software
      • Coils
      • Aerial Ranging Devices
  • Degaussing
    • Products
      • Hardware
        • Degaussing Coil Units
        • Magnetometers
        • Degaussing Control Units
        • Bipolar Amplifiers
        • DG Generators
        • Conductors
        • Course Monitor Units
        • Compass Compensating Equipment
      • Software
    • Services
  • Deperming

By End User

  • OEM
  • Aftermarket
  • Services

By Region

  • North America
  • Europe
  • Asia Pacific
  • Rest of the World

Recent Developments

  • In January 2022, Larsen & Turbo Limited announced the development of advanced defense technologies for Indian defense forces. The company degausses the hulls of cargo and oil tanker vessels and also provides repair and installation services.
  • In November 2021, The Marine Electrical Systems, a division of Wartsila SAM Electronics GmbH, received a contract under the F126 project from Damen (Netherland) to deliver degaussing system, switchgear, lighting system, power distribution system, and special equipment for an energy supply

Frequently Asked Questions (FAQ):

To speak to our analyst for a discussion on the above findings, click Speak to Analyst

TABLE OF CONTENTS
 
1 INTRODUCTION (Page No. - 23)
    1.1 STUDY OBJECTIVES 
    1.2 MARKET DEFINITION 
    1.3 MARKET SCOPE 
           1.3.1 MARKETS COVERED
                    FIGURE 1 DEGAUSSING SYSTEM MARKET SEGMENTATION
           1.3.2 YEARS CONSIDERED
           1.3.3 REGIONAL SCOPE
    1.4 INCLUSIONS AND EXCLUSIONS 
           TABLE 1 DEGAUSSING SYSTEM MARKET: INCLUSIONS AND EXCLUSIONS
    1.5 CURRENCY CONSIDERED 
           TABLE 2 USD EXCHANGE RATES
    1.6 STAKEHOLDERS 
    1.7 LIMITATIONS 
    1.8 SUMMARY OF CHANGES 
 
2 RESEARCH METHODOLOGY (Page No. - 28)
    2.1 RESEARCH DATA 
           FIGURE 2 RESEARCH PROCESS FLOW
           FIGURE 3 DEGAUSSING SYSTEM MARKET: RESEARCH DESIGN
           2.1.1 SECONDARY DATA
                    2.1.1.1 Key data from secondary sources
           2.1.2 PRIMARY DATA
                    2.1.2.1 Key data from primary sources
                    2.1.2.2 Key primary sources
                    2.1.2.3 Breakdown of primaries
                               FIGURE 4 BREAKDOWN OF PRIMARY INTERVIEWS: BY COMPANY TYPE, DESIGNATION, AND REGION
    2.2 RECESSION IMPACT ANALYSIS 
           2.2.1 DEMAND-SIDE INDICATORS
                    FIGURE 5 NAVAL DEFENSE BUDGET BY US
                    FIGURE 6 BREAKDOWN OF US NAVAL DEFENSE BUDGET
           2.2.2 SUPPLY-SIDE INDICATORS
    2.3 MARKET SIZE ESTIMATION 
    2.4 RESEARCH APPROACH AND METHODOLOGY 
           2.4.1 BOTTOM-UP APPROACH
                    FIGURE 7 MARKET SIZE ESTIMATION METHODOLOGY: BOTTOM-UP APPROACH
           2.4.2 TOP-DOWN APPROACH
                    FIGURE 8 MARKET SIZE ESTIMATION METHODOLOGY: TOP-DOWN APPROACH
    2.5 MARKET BREAKDOWN AND DATA TRIANGULATION 
           FIGURE 9 DATA TRIANGULATION
    2.6 GROWTH RATE ASSUMPTIONS 
    2.7 RESEARCH ASSUMPTIONS 
           FIGURE 10 RESEARCH ASSUMPTIONS FOR DEGAUSSING SYSTEM MARKET
           2.7.1 MARKET SIZE AND FORECAST
 
3 EXECUTIVE SUMMARY (Page No. - 40)
    FIGURE 11 SUBMARINES SEGMENT TO ACCOUNT FOR LARGEST MARKET SHARE DURING FORECAST PERIOD
    FIGURE 12 ONBOARD SEGMENT TO HAVE LARGER MARKET SHARE THAN FIXED SEGMENT
    FIGURE 13 DEGAUSSING COIL UNITS SEGMENT TO DOMINATE MARKET DURING FORECAST PERIOD
    FIGURE 14 ASIA PACIFIC TO COMMAND MAJOR MARKET SHARE FROM 2022 TO 2027
 
4 PREMIUM INSIGHTS (Page No. - 43)
    4.1 ATTRACTIVE GROWTH OPPORTUNITIES FOR PLAYERS IN DEGAUSSING SYSTEM MARKET 
    4.2 DEGAUSSING SYSTEM MARKET, BY VESSEL TYPE 
           FIGURE 16 SUBMARINES SEGMENT TO LEAD MARKET DURING FORECAST PERIOD
    4.3 DEGAUSSING SYSTEM MARKET, BY DEGAUSSING SOLUTION 
           FIGURE 17 PRODUCTS SEGMENT TO HAVE HIGHER CAGR DURING FORECAST PERIOD
    4.4 DEGAUSSING SYSTEM MARKET, BY END USER 
           FIGURE 18 OEM SEGMENT TO DOMINATE MARKET DURING FORECAST PERIOD
 
5 MARKET OVERVIEW (Page No. - 46)
    5.1 INTRODUCTION 
    5.2 MARKET DYNAMICS 
           FIGURE 19 DEGAUSSING SYSTEM MARKET DYNAMICS
           5.2.1 DRIVERS
                    5.2.1.1 Increasing importance of degaussing systems in naval warfare
                    5.2.1.2 Technological advancements in degaussing equipment to protect naval vessels
                    5.2.1.3 Increasing defense budget to procure advanced warships
                               FIGURE 20 DEFENSE SPENDING OF KEY COUNTRIES
           5.2.2 RESTRAINTS
                    5.2.2.1 Use of composite material in warships to restrain market growth
           5.2.3 OPPORTUNITIES
                    5.2.3.1 Increase in maritime warfare exercises to protect naval vessels from sea mines
           5.2.4 CHALLENGES
                    5.2.4.1 High cost of retrofit, installation, and calibration services to affect market growth
                    5.2.4.2 Lack of skilled professionals to pose challenges for end users
                    5.2.4.3 Limited number of ranging and deperming stations to affect deperming services
    5.3 TRENDS/DISRUPTIONS IMPACTING CUSTOMER BUSINESS 
           FIGURE 21 REVENUE SHIFT IN DEGAUSSING SYSTEM MARKET
    5.4 DEGAUSSING SYSTEM MARKET ECOSYSTEM 
           FIGURE 22 ECOSYSTEM MAP: DEGAUSSING SYSTEM MARKET
           5.4.1 PROMINENT COMPANIES
           5.4.2 PRIVATE AND SMALL ENTERPRISES
           5.4.3 END USERS
                    TABLE 3 DEGAUSSING SYSTEM MARKET ECOSYSTEM
    5.5 VALUE CHAIN ANALYSIS 
           FIGURE 23 VALUE CHAIN ANALYSIS: DEGAUSSING SYSTEM MARKET
    5.6 PORTER’S FIVE FORCES ANALYSIS 
           TABLE 4 IMPACT OF PORTER’S FIVE FORCES ON DEGAUSSING SYSTEM MARKET
           FIGURE 24 DEGAUSSING SYSTEM MARKET: PORTER’S FIVE FORCES ANALYSIS
           5.6.1 THREAT OF NEW ENTRANTS
           5.6.2 THREAT OF SUBSTITUTES
           5.6.3 BARGAINING POWER OF SUPPLIERS
           5.6.4 BARGAINING POWER OF BUYERS
           5.6.5 INTENSITY OF COMPETITIVE RIVALRY
    5.7 TARIFF AND REGULATORY LANDSCAPE 
           TABLE 5 NORTH AMERICA: REGULATORY BODIES, GOVERNMENT AGENCIES, AND OTHER ORGANIZATIONS
           TABLE 6 EUROPE: REGULATORY BODIES, GOVERNMENT AGENCIES, AND OTHER ORGANIZATIONS
           TABLE 7 ASIA PACIFIC: REGULATORY BODIES, GOVERNMENT AGENCIES, AND OTHERS
           TABLE 8 MIDDLE EAST: REGULATORY BODIES, GOVERNMENT AGENCIES, AND OTHERS
           TABLE 9 REST OF THE WORLD: REGULATORY BODIES, GOVERNMENT AGENCIES, AND OTHER ORGANIZATIONS
    5.8 KEY STAKEHOLDERS AND BUYING CRITERIA 
           5.8.1 KEY STAKEHOLDERS IN BUYING PROCESS
                    FIGURE 25 INFLUENCE OF STAKEHOLDERS ON BUYING DEGAUSSING SYSTEMS, BY END USER
                    TABLE 10 KEY STAKEHOLDERS INVOLVED IN BUYING DEGAUSSING SYSTEMS, BY END USER (%)
           5.8.2 BUYING CRITERIA
                    FIGURE 26 KEY BUYING CRITERIA FOR DEGAUSSING SYSTEMS, BY END USER
                    TABLE 11 INFLUENCE OF KEY BUYING CRITERIA ON DEGAUSSING SYSTEMS, BY END USER
    5.9 USE CASES 
           5.9.1 MAGNETIC STEALTH DEGAUSSING SYSTEM
    5.10 RECESSION IMPACT ON DEGAUSSING SYSTEM MARKET 
           FIGURE 27 RECESSION IMPACT ANALYSIS OF DEGAUSSING SYSTEM MARKET
 
6 INDUSTRY TRENDS (Page No. - 60)
    6.1 INTRODUCTION 
    6.2 POWER SUPPLY ARCHITECTURE 
           6.2.1 FULLY DISTRIBUTED DEGAUSSING SYSTEM
           6.2.2 SEMI-DISTRIBUTED DEGAUSSING SYSTEM
           6.2.3 CENTRALIZED DEGAUSSING SYSTEM
    6.3 CONTROL MODE 
           6.3.1 CURRENT CONTROLLER MAGNETOMETER
    6.4 TECHNOLOGICAL TRENDS 
           FIGURE 28 TECHNOLOGICAL ADVANCEMENTS IN DEGAUSSING SYSTEMS
           6.4.1 COPPER COILS
           6.4.2 HTS MATERIAL
           6.4.3 ONBOARD AERIAL RANGING DEVICE
           6.4.4 MULTI-INFLUENCE RANGING SYSTEM
    6.5 STRATEGIC BENCHMARKING 
           FIGURE 29 STRATEGIC BENCHMARKING
    6.6 INNOVATIONS AND PATENT REGISTRATIONS 
           TABLE 12 INNOVATIONS AND PATENT REGISTRATIONS, 2019–2022
    6.7 KEY CONFERENCES AND EVENTS, 2023 
           TABLE 13 DEGAUSSING SYSTEM MARKET: CONFERENCES AND EVENTS
 
7 DEGAUSSING SYSTEM MARKET, BY VESSEL TYPE (Page No. - 64)
    7.1 INTRODUCTION 
           FIGURE 30 MEDIUM VESSELS SEGMENT TO DOMINATE DEGAUSSING SYSTEM MARKET FROM 2022 TO 2027
           TABLE 14 DEGAUSSING SYSTEM MARKET, BY VESSEL TYPE, 2019–2021 (USD MILLION)
           TABLE 15 DEGAUSSING SYSTEM MARKET, BY VESSEL TYPE, 2022–2027 (USD MILLION)
    7.2 SMALL VESSELS 
           7.2.1 GROWING ADOPTION OF OPVS FOR STRENGTHENING NAVAL SECURITY TO DRIVE MARKET
                    TABLE 16 SMALL VESSELS: DEGAUSSING SYSTEM MARKET, BY TYPE, 2019–2021 (USD MILLION)
                    TABLE 17 SMALL VESSELS: DEGAUSSING SYSTEM MARKET, BY TYPE, 2022–2027 (USD MILLION)
           7.2.2 MCMV
           7.2.3 OPV
           7.2.4 FAC
    7.3 MEDIUM VESSELS 
           7.3.1 RISING MARITIME BORDER DISPUTES TO DRIVE DEMAND FOR MODERN WARSHIPS
                    TABLE 18 MEDIUM VESSELS: DEGAUSSING SYSTEM MARKET, BY TYPE, 2019–2021 (USD MILLION)
                    TABLE 19 MEDIUM VESSELS: DEGAUSSING SYSTEM MARKET, BY TYPE, 2022–2027 (USD MILLION)
           7.3.2 SUBMARINES
           7.3.3 DESTROYERS
           7.3.4 CORVETTES
    7.4 LARGE VESSELS 
           7.4.1 RISING INVESTMENTS IN LARGE WARSHIPS TO STRENGTHEN NAVAL FORCES
                    TABLE 20 LARGE VESSELS: DEGAUSSING SYSTEM MARKET, BY TYPE, 2019–2021 (USD MILLION)
                    TABLE 21 LARGE VESSELS: DEGAUSSING SYSTEM MARKET, BY TYPE, 2022–2027 (USD MILLION)
           7.4.2 FRIGATES
           7.4.3 AIRCRAFT CARRIERS
           7.4.4 AMPHIBIOUS VESSELS
 
8 DEGAUSSING SYSTEM MARKET, BY SOLUTION (Page No. - 70)
    8.1 INTRODUCTION 
           FIGURE 31 DEGAUSSING SEGMENT ESTIMATED TO DOMINATE MARKET IN 2022
           TABLE 22 DEGAUSSING SYSTEM MARKET, BY SOLUTION, 2019–2021 (USD MILLION)
           TABLE 23 DEGAUSSING SYSTEM MARKET, BY SOLUTION, 2022–2027 (USD MILLION)
    8.2 DEGAUSSING 
           8.2.1 RISING INTEGRATION OF DEGAUSSING SYSTEMS IN ADVANCED WARSHIPS TO DRIVE SEGMENT
                    TABLE 24 DEGAUSSING SOLUTION: DEGAUSSING SYSTEM MARKET, BY OFFERING, 2019–2021 (USD MILLION)
                    TABLE 25 DEGAUSSING SOLUTION: DEGAUSSING SYSTEM MARKET, BY OFFERING, 2022–2027 (USD MILLION)
           8.2.2 PRODUCTS
                    TABLE 26 DEGAUSSING OFFERING: DEGAUSSING SYSTEM MARKET, BY PRODUCT, 2019–2021 (USD MILLION)
                    TABLE 27 DEGAUSSING OFFERING: DEGAUSSING SYSTEM MARKET, BY PRODUCT, 2022–2027 (USD MILLION)
                    8.2.2.1 Hardware
                               TABLE 28 DEGAUSSING PRODUCT: DEGAUSSING SYSTEM MARKET, BY HARDWARE, 2019–2021 (USD MILLION)
                               TABLE 29 DEGAUSSING PRODUCT: DEGAUSSING SYSTEM MARKET, BY HARDWARE, 2022–2027 (USD MILLION)
                               8.2.2.1.1 Degaussing coil units
                               8.2.2.1.2 Magnetometers
                               8.2.2.1.3 Degaussing control units
                               8.2.2.1.4 Bipolar amplifiers
                               8.2.2.1.5 DC generators
                               8.2.2.1.6 Conductors
                               8.2.2.1.7 Course monitor units
                               8.2.2.1.8 Compass compensating equipment
                    8.2.2.2 Software
           8.2.3 SERVICES
    8.3 RANGING 
           8.3.1 RISING DEMAND FOR ADVANCED ONBOARD-RANGING SOLUTIONS TO BOOST SEGMENT GROWTH
                    TABLE 30 RANGING: DEGAUSSING SYSTEM MARKET, BY OFFERING, 2019–2021 (USD MILLION)
                    TABLE 31 RANGING: DEGAUSSING SYSTEM MARKET, BY OFFERING, 2022–2027 (USD MILLION)
           8.3.2 FIXED
           8.3.3 ONBOARD
                    TABLE 32 RANGING ONBOARD: DEGAUSSING SYSTEM MARKET, BY PRODUCT, 2019–2021 (USD MILLION)
                    TABLE 33 RANGING ONBOARD: DEGAUSSING SYSTEM MARKET, BY PRODUCT, 2022–2027 (USD MILLION)
                    8.3.3.1 Transmitted data buoys
                    8.3.3.2 Magnetometers
                    8.3.3.3 Monitors
                    8.3.3.4 Software
                    8.3.3.5 Coils
                    8.3.3.6 Aerial ranging devices
    8.4 DEPERMING 
           8.4.1 DEMAND FOR IMPROVED SAFETY OF SHIPS DURING OPERATIONS TO DRIVE SEGMENT
 
9 DEGAUSSING SYSTEM MARKET, BY END USER (Page No. - 79)
    9.1 INTRODUCTION 
           FIGURE 32 OEM SEGMENT TO LEAD DEGAUSSING SYSTEM MARKET FROM 2022 TO 2027
    9.2 OEM 
           9.2.1 RISING INVESTMENT IN DEVELOPING DEFENSE SHIPS TO DRIVE SEGMENT
    9.3 AFTERMARKET 
           9.3.1 RISING FOCUS ON MODERNIZING NAVAL WARFARE SYSTEMS TO DRIVE SEGMENT
    9.4 SERVICES 
           9.4.1 MAINTENANCE REQUIREMENT FOR DEGAUSSING SYSTEM PRODUCTS TO DRIVE SEGMENT
 
10 DEGAUSSING SYSTEM MARKET, BY REGION (Page No. - 82)
     10.1 INTRODUCTION 
             FIGURE 33 DEGAUSSING SYSTEM MARKET IN NORTH AMERICA TO REGISTER HIGHEST CAGR DURING FORECAST PERIOD
             10.1.1 REGIONAL RECESSION IMPACT ANALYSIS
                        FIGURE 34 NAVAL BUDGET TREND, BY REGION, 2019–2022
                        FIGURE 35 RECESSION IMPACT ANALYSIS, BY REGION
                        TABLE 34 DEGAUSSING SYSTEM MARKET, BY REGION, 2019–2021 (USD MILLION)
                        TABLE 35 DEGAUSSING SYSTEM MARKET, BY REGION, 2022–2027 (USD MILLION)
     10.2 NORTH AMERICA 
             10.2.1 PESTLE ANALYSIS: NORTH AMERICA
                        FIGURE 36 NORTH AMERICA: DEGAUSSING SYSTEM MARKET SNAPSHOT
                        TABLE 36 NORTH AMERICA: DEGAUSSING SYSTEM MARKET, BY COUNTRY, 2019–2021 (USD MILLION)
                        TABLE 37 NORTH AMERICA: DEGAUSSING SYSTEM MARKET, BY COUNTRY, 2022–2027 (USD MILLION)
                        TABLE 38 NORTH AMERICA: DEGAUSSING SYSTEM MARKET, BY SOLUTION, 2019–2021 (USD MILLION)
                        TABLE 39 NORTH AMERICA: DEGAUSSING SYSTEM MARKET, BY SOLUTION, 2022–2027 (USD MILLION)
                        TABLE 40 NORTH AMERICA: DEGAUSSING SYSTEM MARKET, BY VESSEL TYPE, 2019–2021 (USD MILLION)
                        TABLE 41 NORTH AMERICA: DEGAUSSING SYSTEM MARKET, BY VESSEL TYPE, 2022–2027 (USD MILLION)
                        TABLE 42 NORTH AMERICA: DEGAUSSING SYSTEM MARKET, BY SUB-VESSEL TYPE, 2019–2021 (USD MILLION)
                        TABLE 43 NORTH AMERICA: DEGAUSSING SYSTEM MARKET, BY SUB-VESSEL TYPE, 2022–2027 (USD MILLION)
                        TABLE 44 NORTH AMERICA: DEGAUSSING SYSTEM MARKET, BY END USER, 2019–2021 (USD MILLION)
                        TABLE 45 NORTH AMERICA: DEGAUSSING SYSTEM MARKET, BY END USER, 2022–2027 (USD MILLION)
             10.2.2 US
                        10.2.2.1 Increasing naval budget to fuel demand for degaussing systems
                                     TABLE 46 US: DEGAUSSING SYSTEM MARKET, BY SOLUTION, 2019–2021 (USD MILLION)
                                     TABLE 47 US: DEGAUSSING SYSTEM MARKET, BY SOLUTION, 2022–2027 (USD MILLION)
                                     TABLE 48 US: DEGAUSSING SYSTEM MARKET, BY VESSEL TYPE, 2019–2021 (USD MILLION)
                                     TABLE 49 US: DEGAUSSING SYSTEM MARKET, BY VESSEL TYPE, 2022–2027 (USD MILLION)
                                     TABLE 50 US: DEGAUSSING SYSTEM MARKET, BY SUB-VESSEL TYPE, 2019–2021 (USD MILLION)
                                     TABLE 51 US: DEGAUSSING SYSTEM MARKET, BY SUB-VESSEL TYPE, 2022–2027 (USD MILLION)
                                     TABLE 52 US: DEGAUSSING SYSTEM MARKET, BY END USER, 2019–2021 (USD MILLION)
                                     TABLE 53 US: DEGAUSSING SYSTEM MARKET, BY END USER, 2022–2027 (USD MILLION)
             10.2.3 CANADA
                        10.2.3.1 Increasing focus on naval vessel development to drive demand for degaussing systems
                                     TABLE 54 CANADA: DEGAUSSING SYSTEM MARKET, BY SOLUTION, 2019–2021 (USD MILLION)
                                     TABLE 55 CANADA: DEGAUSSING SYSTEM MARKET, BY SOLUTION, 2022–2027 (USD MILLION)
                                     TABLE 56 CANADA: DEGAUSSING SYSTEM MARKET, BY VESSEL TYPE, 2019–2021 (USD MILLION)
                                     TABLE 57 CANADA: DEGAUSSING SYSTEM MARKET, BY VESSEL TYPE, 2022–2027 (USD MILLION)
                                     TABLE 58 CANADA: DEGAUSSING SYSTEM MARKET, BY SUB-VESSEL TYPE, 2019–2021 (USD MILLION)
                                     TABLE 59 CANADA: DEGAUSSING SYSTEM MARKET, BY SUB-VESSEL TYPE, 2022–2027 (USD MILLION)
                                     TABLE 60 CANADA: DEGAUSSING SYSTEM MARKET, BY END USER, 2019–2021 (USD MILLION)
                                     TABLE 61 CANADA: DEGAUSSING SYSTEM MARKET, BY END USER, 2022–2027 (USD MILLION)
     10.3 EUROPE 
             10.3.1 PESTLE ANALYSIS: EUROPE
                        FIGURE 37 EUROPE: DEGAUSSING SYSTEM MARKET SNAPSHOT
                        TABLE 62 EUROPE: DEGAUSSING SYSTEM MARKET, BY COUNTRY, 2019–2021 (USD MILLION)
                        TABLE 63 EUROPE: DEGAUSSING SYSTEM MARKET, BY COUNTRY, 2022–2027 (USD MILLION)
                        TABLE 64 EUROPE: DEGAUSSING SYSTEM MARKET, BY SOLUTION, 2019–2021 (USD MILLION)
                        TABLE 65 EUROPE: DEGAUSSING SYSTEM MARKET, BY SOLUTION, 2022–2027 (USD MILLION)
                        TABLE 66 EUROPE: DEGAUSSING SYSTEM MARKET, BY VESSEL TYPE, 2019–2021 (USD MILLION)
                        TABLE 67 EUROPE: DEGAUSSING SYSTEM MARKET, BY VESSEL TYPE, 2022–2027 (USD MILLION)
                        TABLE 68 EUROPE: DEGAUSSING SYSTEM MARKET, BY SUB-VESSEL TYPE, 2019–2021 (USD MILLION)
                        TABLE 69 EUROPE: DEGAUSSING SYSTEM MARKET, BY SUB-VESSEL TYPE, 2022–2027 (USD MILLION)
                        TABLE 70 EUROPE: DEGAUSSING SYSTEM MARKET, BY END USER, 2019–2021 (USD MILLION)
                        TABLE 71 EUROPE: DEGAUSSING SYSTEM MARKET, BY END USER, 2022–2027 (USD MILLION)
             10.3.2 UK
                        10.3.2.1 Defense shipbuilding industry to boost degaussing system needs
                                     TABLE 72 UK: DEGAUSSING SYSTEM MARKET, BY SOLUTION, 2019–2021 (USD MILLION)
                                     TABLE 73 UK: DEGAUSSING SYSTEM MARKET, BY SOLUTION, 2022–2027 (USD MILLION)
                                     TABLE 74 UK: DEGAUSSING SYSTEM MARKET, BY VESSEL TYPE, 2019–2021 (USD MILLION)
                                     TABLE 75 UK: DEGAUSSING SYSTEM MARKET, BY VESSEL TYPE, 2022–2027 (USD MILLION)
                                     TABLE 76 UK: DEGAUSSING SYSTEM MARKET, BY SUB-VESSEL TYPE, 2019–2021 (USD MILLION)
                                     TABLE 77 UK: DEGAUSSING SYSTEM MARKET, BY SUB-VESSEL TYPE, 2022–2027 (USD MILLION)
                                     TABLE 78 UK: DEGAUSSING SYSTEM MARKET, BY END USER, 2019–2021 (USD MILLION)
                                     TABLE 79 UK: DEGAUSSING SYSTEM MARKET, BY END USER, 2022–2027 (USD MILLION)
             10.3.3 GERMANY
                        10.3.3.1 Government reforms to strengthen technology adoption to drive market
                                     TABLE 80 GERMANY: DEGAUSSING SYSTEM MARKET, BY SOLUTION, 2019–2021 (USD MILLION)
                                     TABLE 81 GERMANY: DEGAUSSING SYSTEM MARKET, BY SOLUTION, 2022–2027 (USD MILLION)
                                     TABLE 82 GERMANY: DEGAUSSING SYSTEM MARKET, BY VESSEL TYPE, 2019–2021 (USD MILLION)
                                     TABLE 83 GERMANY: DEGAUSSING SYSTEM MARKET, BY VESSEL TYPE, 2022–2027 (USD MILLION)
                                     TABLE 84 GERMANY: DEGAUSSING SYSTEM MARKET, BY SUB-VESSEL TYPE, 2019–2021 (USD MILLION)
                                     TABLE 85 GERMANY: DEGAUSSING SYSTEM MARKET, BY SUB-VESSEL TYPE, 2022–2027 (USD MILLION)
                                     TABLE 86 GERMANY: DEGAUSSING SYSTEM MARKET, BY END USER, 2019–2021 (USD MILLION)
                                     TABLE 87 GERMANY: DEGAUSSING SYSTEM MARKET, BY END USER, 2022–2027 (USD MILLION)
             10.3.4 FRANCE
                        10.3.4.1 Rising focus on strengthening naval capabilities to propel degaussing system adoption
                                     TABLE 88 FRANCE: DEGAUSSING SYSTEM MARKET, BY SOLUTION, 2019–2021 (USD MILLION)
                                     TABLE 89 FRANCE: DEGAUSSING SYSTEM MARKET, BY SOLUTION, 2022–2027 (USD MILLION)
                                     TABLE 90 FRANCE: DEGAUSSING SYSTEM MARKET, BY VESSEL TYPE, 2019–2021 (USD MILLION)
                                     TABLE 91 FRANCE: DEGAUSSING SYSTEM MARKET, BY VESSEL TYPE, 2022–2027 (USD MILLION)
                                     TABLE 92 FRANCE: DEGAUSSING SYSTEM MARKET, BY SUB-VESSEL TYPE, 2019–2021 (USD MILLION)
                                     TABLE 93 FRANCE: DEGAUSSING SYSTEM MARKET, BY SUB-VESSEL TYPE, 2022–2027 (USD MILLION)
                                     TABLE 94 FRANCE: DEGAUSSING SYSTEM MARKET, BY END USER, 2019–2021 (USD MILLION)
                                     TABLE 95 FRANCE: DEGAUSSING SYSTEM MARKET, BY END USER, 2022–2027 (USD MILLION)
             10.3.5 RUSSIA
                        10.3.5.1 Rising investment in defense technologies to boost degaussing system demand
                                     TABLE 96 RUSSIA: DEGAUSSING SYSTEM MARKET, BY SOLUTION, 2019–2021 (USD MILLION)
                                     TABLE 97 RUSSIA: DEGAUSSING SYSTEM MARKET, BY SOLUTION, 2022–2027 (USD MILLION)
                                     TABLE 98 RUSSIA: DEGAUSSING SYSTEM MARKET, BY VESSEL TYPE, 2019–2021 (USD MILLION)
                                     TABLE 99 RUSSIA: DEGAUSSING SYSTEM MARKET, BY VESSEL TYPE, 2022–2027 (USD MILLION)
                                     TABLE 100 RUSSIA: DEGAUSSING SYSTEM MARKET, BY SUB-VESSEL TYPE, 2019–2021 (USD MILLION)
                                     TABLE 101 RUSSIA: DEGAUSSING SYSTEM MARKET, BY SUB-VESSEL TYPE, 2022–2027 (USD MILLION)
                                     TABLE 102 RUSSIA: DEGAUSSING SYSTEM MARKET, BY END USER, 2019–2021 (USD MILLION)
                                     TABLE 103 RUSSIA: DEGAUSSING SYSTEM MARKET, BY END USER, 2022–2027 (USD MILLION)
             10.3.6 ITALY
                        10.3.6.1 Focus on expanding domestic maritime industry to increase investment in maritime technologies
                                     TABLE 104 ITALY: DEGAUSSING SYSTEM MARKET, BY SOLUTION, 2019–2021 (USD MILLION)
                                     TABLE 105 ITALY: DEGAUSSING SYSTEM MARKET, BY SOLUTION, 2022–2027 (USD MILLION)
                                     TABLE 106 ITALY: DEGAUSSING SYSTEM MARKET, BY VESSEL TYPE, 2019–2021 (USD MILLION)
                                     TABLE 107 ITALY: DEGAUSSING SYSTEM MARKET, BY VESSEL TYPE, 2022–2027 (USD MILLION)
                                     TABLE 108 ITALY: DEGAUSSING SYSTEM MARKET, BY SUB-VESSEL TYPE, 2019–2021 (USD MILLION)
                                     TABLE 109 ITALY: DEGAUSSING SYSTEM MARKET, BY SUB-VESSEL TYPE, 2022–2027 (USD MILLION)
                                     TABLE 110 ITALY: DEGAUSSING SYSTEM MARKET, BY END USER, 2019–2021 (USD MILLION)
                                     TABLE 111 ITALY: DEGAUSSING SYSTEM MARKET, BY END USER, 2022–2027 (USD MILLION)
             10.3.7 SPAIN
                        10.3.7.1 Increasing defense budget to drive market
                                     TABLE 112 SPAIN: DEGAUSSING SYSTEM MARKET, BY SOLUTION, 2019–2021 (USD MILLION)
                                     TABLE 113 SPAIN: DEGAUSSING SYSTEM MARKET, BY SOLUTION, 2022–2027 (USD MILLION)
                                     TABLE 114 SPAIN: DEGAUSSING SYSTEM MARKET, BY VESSEL TYPE, 2019–2021 (USD MILLION)
                                     TABLE 115 SPAIN: DEGAUSSING SYSTEM MARKET, BY VESSEL TYPE, 2022–2027 (USD MILLION)
                                     TABLE 116 SPAIN: DEGAUSSING SYSTEM MARKET, BY SUB-VESSEL TYPE, 2019–2021 (USD MILLION)
                                     TABLE 117 SPAIN: DEGAUSSING SYSTEM MARKET, BY SUB-VESSEL TYPE, 2022–2027 (USD MILLION)
                                     TABLE 118 SPAIN: DEGAUSSING SYSTEM MARKET, BY END USER, 2019–2021 (USD MILLION)
                                     TABLE 119 SPAIN: DEGAUSSING SYSTEM MARKET, BY END USER, 2022–2027 (USD MILLION)
             10.3.8 REST OF EUROPE
                        TABLE 120 REST OF EUROPE: DEGAUSSING SYSTEM MARKET, BY SOLUTION, 2019–2021 (USD MILLION)
                        TABLE 121 REST OF EUROPE: DEGAUSSING SYSTEM MARKET, BY SOLUTION, 2022–2027 (USD MILLION)
                        TABLE 122 REST OF EUROPE: DEGAUSSING SYSTEM MARKET, BY VESSEL TYPE, 2019–2021 (USD MILLION)
                        TABLE 123 REST OF EUROPE: DEGAUSSING SYSTEM MARKET, BY VESSEL TYPE, 2022–2027 (USD MILLION)
                        TABLE 124 REST OF EUROPE: DEGAUSSING SYSTEM MARKET, BY SUB-VESSEL TYPE, 2019–2021 (USD MILLION)
                        TABLE 125 REST OF EUROPE: DEGAUSSING SYSTEM MARKET, BY SUB-VESSEL TYPE, 2022–2027 (USD MILLION)
                        TABLE 126 REST OF EUROPE: DEGAUSSING SYSTEM MARKET, BY END USER, 2019–2021 (USD MILLION)
                        TABLE 127 REST OF EUROPE: DEGAUSSING SYSTEM MARKET, BY END USER, 2022–2027 (USD MILLION)
     10.4 ASIA PACIFIC 
             10.4.1 PESTLE ANALYSIS: ASIA PACIFIC
                        FIGURE 38 ASIA PACIFIC: DEGAUSSING SYSTEM MARKET SNAPSHOT
                        TABLE 128 ASIA PACIFIC: DEGAUSSING SYSTEM MARKET, BY COUNTRY, 2019–2021 (USD MILLION)
                        TABLE 129 ASIA PACIFIC: DEGAUSSING SYSTEM MARKET, BY COUNTRY, 2022–2027 (USD MILLION)
                        TABLE 130 ASIA PACIFIC: DEGAUSSING SYSTEM MARKET, BY SOLUTION, 2019–2021 (USD MILLION)
                        TABLE 131 ASIA PACIFIC: DEGAUSSING SYSTEM MARKET, BY SOLUTION, 2022–2027 (USD MILLION)
                        TABLE 132 ASIA PACIFIC: DEGAUSSING SYSTEM MARKET, BY VESSEL TYPE, 2019–2021 (USD MILLION)
                        TABLE 133 ASIA PACIFIC: DEGAUSSING SYSTEM MARKET, BY VESSEL TYPE, 2022–2027 (USD MILLION)
                        TABLE 134 ASIA PACIFIC: DEGAUSSING SYSTEM MARKET, BY SUB-VESSEL TYPE, 2019–2021 (USD MILLION)
                        TABLE 135 ASIA PACIFIC: DEGAUSSING SYSTEM MARKET, BY SUB-VESSEL TYPE, 2022–2027 (USD MILLION)
                        TABLE 136 ASIA PACIFIC: DEGAUSSING SYSTEM MARKET, BY END USER, 2019–2021 (USD MILLION)
                        TABLE 137 ASIA PACIFIC: DEGAUSSING SYSTEM MARKET, BY END USER, 2022–2027 (USD MILLION)
             10.4.2 CHINA
                        10.4.2.1 Extensive investment in production and modernization of warships to strengthen naval force
                                     TABLE 138 CHINA: DEGAUSSING SYSTEM MARKET, BY SOLUTION, 2019–2021 (USD MILLION)
                                     TABLE 139 CHINA: DEGAUSSING SYSTEM MARKET, BY SOLUTION, 2022–2027 (USD MILLION)
                                     TABLE 140 CHINA: DEGAUSSING SYSTEM MARKET, BY VESSEL TYPE, 2019–2021 (USD MILLION)
                                     TABLE 141 CHINA: DEGAUSSING SYSTEM MARKET, BY VESSEL TYPE, 2022–2027 (USD MILLION)
                                     TABLE 142 CHINA: DEGAUSSING SYSTEM MARKET, BY SUB-VESSEL TYPE, 2019–2021 (USD MILLION)
                                     TABLE 143 CHINA: DEGAUSSING SYSTEM MARKET, BY SUB-VESSEL TYPE, 2022–2027 (USD MILLION)
                                     TABLE 144 CHINA: DEGAUSSING SYSTEM MARKET, BY END USER, 2019–2021 (USD MILLION)
                                     TABLE 145 CHINA: DEGAUSSING SYSTEM MARKET, BY END USER, 2022–2027 (USD MILLION)
             10.4.3 INDIA
                        10.4.3.1 Increasing defense shipbuilding activities to boost degaussing system demand
                                     TABLE 146 INDIA: DEGAUSSING SYSTEM MARKET, BY SOLUTION, 2019–2021 (USD MILLION)
                                     TABLE 147 INDIA: DEGAUSSING SYSTEM MARKET, BY SOLUTION, 2022–2027 (USD MILLION)
                                     TABLE 148 INDIA: DEGAUSSING SYSTEM MARKET, BY VESSEL TYPE, 2019–2021 (USD MILLION)
                                     TABLE 149 INDIA: DEGAUSSING SYSTEM MARKET, BY VESSEL TYPE, 2022–2027 (USD MILLION)
                                     TABLE 150 INDIA: DEGAUSSING SYSTEM MARKET, BY SUB-VESSEL TYPE, 2019–2021 (USD MILLION)
                                     TABLE 151 INDIA: DEGAUSSING SYSTEM MARKET, BY SUB-VESSEL TYPE, 2022–2027 (USD MILLION)
                                     TABLE 152 INDIA: DEGAUSSING SYSTEM MARKET, BY END USER, 2019–2021 (USD MILLION)
                                     TABLE 153 INDIA: DEGAUSSING SYSTEM MARKET, BY END USER, 2022–2027 (USD MILLION)
             10.4.4 JAPAN
                        10.4.4.1 Innovation of naval technologies to fuel demand for degaussing systems
                                     TABLE 154 JAPAN: DEGAUSSING SYSTEM MARKET, BY SOLUTION, 2019–2021 (USD MILLION)
                                     TABLE 155 JAPAN: DEGAUSSING SYSTEM MARKET, BY SOLUTION, 2022–2027 (USD MILLION)
                                     TABLE 156 JAPAN: DEGAUSSING SYSTEM MARKET, BY VESSEL TYPE, 2019–2021 (USD MILLION)
                                     TABLE 157 JAPAN: DEGAUSSING SYSTEM MARKET, BY VESSEL TYPE, 2022–2027 (USD MILLION)
                                     TABLE 158 JAPAN: DEGAUSSING SYSTEM MARKET, BY SUB-VESSEL TYPE, 2019–2021 (USD MILLION)
                                     TABLE 159 JAPAN: DEGAUSSING SYSTEM MARKET, BY SUB-VESSEL TYPE, 2022–2027 (USD MILLION)
                                     TABLE 160 JAPAN: DEGAUSSING SYSTEM MARKET, BY END USER, 2019–2021 (USD MILLION)
                                     TABLE 161 JAPAN: DEGAUSSING SYSTEM MARKET, BY END USER, 2022–2027 (USD MILLION)
             10.4.5 SOUTH KOREA
                        10.4.5.1 Increasing shipbuilding activities to drive demand for advanced vessel systems
                                     TABLE 162 SOUTH KOREA: DEGAUSSING SYSTEM MARKET, BY SOLUTION, 2019–2021 (USD MILLION)
                                     TABLE 163 SOUTH KOREA: DEGAUSSING SYSTEM MARKET, BY SOLUTION, 2022–2027 (USD MILLION)
                                     TABLE 164 SOUTH KOREA: DEGAUSSING SYSTEM MARKET, BY VESSEL TYPE, 2019–2021 (USD MILLION)
                                     TABLE 165 SOUTH KOREA: DEGAUSSING SYSTEM MARKET, BY VESSEL TYPE, 2022–2027 (USD MILLION)
                                     TABLE 166 SOUTH KOREA: DEGAUSSING SYSTEM MARKET, BY SUB-VESSEL TYPE, 2019–2021 (USD MILLION)
                                     TABLE 167 SOUTH KOREA: DEGAUSSING SYSTEM MARKET, BY SUB-VESSEL TYPE, 2022–2027 (USD MILLION)
                                     TABLE 168 SOUTH KOREA: DEGAUSSING SYSTEM MARKET, BY END USER, 2019–2021 (USD MILLION)
                                     TABLE 169 SOUTH KOREA: DEGAUSSING SYSTEM MARKET, BY END USER, 2022–2027 (USD MILLION)
             10.4.6 NORTH KOREA
                        10.4.6.1 Development and modernization of advanced submarines to drive market growth
                                     TABLE 170 NORTH KOREA: DEGAUSSING SYSTEM MARKET, BY SOLUTION, 2019–2021 (USD MILLION)
                                     TABLE 171 NORTH KOREA: DEGAUSSING SYSTEM MARKET, BY SOLUTION, 2022–2027 (USD MILLION)
                                     TABLE 172 NORTH KOREA: DEGAUSSING SYSTEM MARKET, BY VESSEL TYPE, 2019–2021 (USD MILLION)
                                     TABLE 173 NORTH KOREA: DEGAUSSING SYSTEM MARKET, BY VESSEL TYPE, 2022–2027 (USD MILLION)
                                     TABLE 174 NORTH KOREA: DEGAUSSING SYSTEM MARKET, BY SUB-VESSEL TYPE, 2019–2021 (USD MILLION)
                                     TABLE 175 NORTH KOREA: DEGAUSSING SYSTEM MARKET, BY SUB-VESSEL TYPE, 2022–2027 (USD MILLION)
                                     TABLE 176 NORTH KOREA: DEGAUSSING SYSTEM MARKET, BY END USER, 2019–2021 (USD MILLION)
                                     TABLE 177 NORTH KOREA: DEGAUSSING SYSTEM MARKET, BY END USER, 2022–2027 (USD MILLION)
             10.4.7 REST OF ASIA PACIFIC
                        TABLE 178 REST OF ASIA PACIFIC: DEGAUSSING SYSTEM MARKET, BY SOLUTION, 2019–2021 (USD MILLION)
                        TABLE 179 REST OF ASIA PACIFIC: DEGAUSSING SYSTEM MARKET, BY SOLUTION, 2022–2027 (USD MILLION)
                        TABLE 180 REST OF ASIA PACIFIC: DEGAUSSING SYSTEM MARKET, BY VESSEL TYPE, 2019–2021 (USD MILLION)
                        TABLE 181 REST OF ASIA PACIFIC: DEGAUSSING SYSTEM MARKET, BY VESSEL TYPE, 2022–2027 (USD MILLION)
                        TABLE 182 REST OF ASIA PACIFIC: DEGAUSSING SYSTEM MARKET, BY SUB-VESSEL TYPE, 2019–2021 (USD MILLION)
                        TABLE 183 REST OF ASIA PACIFIC: DEGAUSSING SYSTEM MARKET, BY SUB-VESSEL TYPE, 2022–2027 (USD MILLION)
                        TABLE 184 REST OF ASIA PACIFIC: DEGAUSSING SYSTEM MARKET, BY END USER, 2019–2021 (USD MILLION)
                        TABLE 185 REST OF ASIA PACIFIC: DEGAUSSING SYSTEM MARKET, BY END USER, 2022–2027 (USD MILLION)
     10.5 REST OF THE WORLD 
             10.5.1 PESTLE ANALYSIS: REST OF THE WORLD
                        TABLE 186 REST OF THE WORLD: DEGAUSSING SYSTEM MARKET, BY REGION, 2019–2021 (USD MILLION)
                        TABLE 187 REST OF THE WORLD: DEGAUSSING SYSTEM MARKET, BY REGION, 2022–2027 (USD MILLION)
                        TABLE 188 REST OF THE WORLD: DEGAUSSING SYSTEM MARKET, BY SOLUTION, 2019–2021 (USD MILLION)
                        TABLE 189 REST OF THE WORLD: DEGAUSSING SYSTEM MARKET, BY SOLUTION, 2022–2027 (USD MILLION)
                        TABLE 190 REST OF THE WORLD: DEGAUSSING SYSTEM MARKET, BY VESSEL TYPE, 2019–2021 (USD MILLION)
                        TABLE 191 REST OF THE WORLD: DEGAUSSING SYSTEM MARKET, BY VESSEL TYPE, 2022–2027 (USD MILLION)
                        TABLE 192 REST OF THE WORLD: DEGAUSSING SYSTEM MARKET, BY SUB-VESSEL TYPE, 2019–2021 (USD MILLION)
                        TABLE 193 REST OF THE WORLD: DEGAUSSING SYSTEM MARKET, BY SUB-VESSEL TYPE, 2022–2027 (USD MILLION)
                        TABLE 194 REST OF THE WORLD: DEGAUSSING SYSTEM MARKET, BY END USER, 2019–2021 (USD MILLION)
                        TABLE 195 REST OF THE WORLD: DEGAUSSING SYSTEM MARKET, BY END USER, 2022–2027 (USD MILLION)
             10.5.2 MIDDLE EAST & AFRICA
                        10.5.2.1 Rising modernization of existing fleet to integrate modern warfare solutions to drive growth
                                     TABLE 196 MIDDLE EAST & AFRICA: DEGAUSSING SYSTEM MARKET, BY SOLUTION, 2019–2021 (USD MILLION)
                                     TABLE 197 MIDDLE EAST & AFRICA: DEGAUSSING SYSTEM MARKET, BY SOLUTION, 2022–2027 (USD MILLION)
                                     TABLE 198 MIDDLE EAST & AFRICA: DEGAUSSING SYSTEM MARKET, BY VESSEL TYPE, 2019–2021 (USD MILLION)
                                     TABLE 199 MIDDLE EAST & AFRICA: DEGAUSSING SYSTEM MARKET, BY VESSEL TYPE, 2022–2027 (USD MILLION)
                                     TABLE 200 MIDDLE EAST & AFRICA: DEGAUSSING SYSTEM MARKET, BY SUB-VESSEL TYPE, 2019–2021 (USD MILLION)
                                     TABLE 201 MIDDLE EAST & AFRICA: DEGAUSSING SYSTEM MARKET, BY SUB-VESSEL TYPE, 2022–2027 (USD MILLION)
                                     TABLE 202 MIDDLE EAST & AFRICA: DEGAUSSING SYSTEM MARKET, BY END USER, 2019–2021 (USD MILLION)
                                     TABLE 203 MIDDLE EAST & AFRICA: DEGAUSSING SYSTEM MARKET, BY END USER, 2022–2027 (USD MILLION)
             10.5.3 SOUTH AMERICA
                        10.5.3.1 Modernization of old fleets to strengthen naval capabilities to drive market
                                     TABLE 204 SOUTH AMERICA: DEGAUSSING SYSTEM MARKET, BY SOLUTION, 2019–2021 (USD MILLION)
                                     TABLE 205 SOUTH AMERICA: DEGAUSSING SYSTEM MARKET, BY SOLUTION, 2022–2027 (USD MILLION)
                                     TABLE 206 SOUTH AMERICA: DEGAUSSING SYSTEM MARKET, BY VESSEL TYPE, 2019–2021 (USD MILLION)
                                     TABLE 207 SOUTH AMERICA: DEGAUSSING SYSTEM MARKET, BY VESSEL TYPE, 2022–2027 (USD MILLION)
                                     TABLE 208 SOUTH AMERICA: DEGAUSSING SYSTEM MARKET, BY SUB-VESSEL TYPE, 2019–2021 (USD MILLION)
                                     TABLE 209 SOUTH AMERICA: DEGAUSSING SYSTEM MARKET, BY SUB-VESSEL TYPE, 2022–2027 (USD MILLION)
                                     TABLE 210 SOUTH AMERICA: DEGAUSSING SYSTEM MARKET, BY END USER, 2019–2021 (USD MILLION)
                                     TABLE 211 SOUTH AMERICA: DEGAUSSING SYSTEM MARKET, BY END USER, 2022–2027 (USD MILLION)
 
11 COMPETITIVE LANDSCAPE (Page No. - 153)
     11.1 INTRODUCTION 
     11.2 COMPANY OVERVIEW 
             TABLE 212 KEY DEVELOPMENTS OF LEADING PLAYERS IN DEGAUSSING SYSTEM MARKET (2019–2021)
     11.3 RANKING ANALYSIS OF KEY PLAYERS IN DEGAUSSING SYSTEM MARKET, 2021 
             FIGURE 39 RANKING OF KEY PLAYERS IN DEGAUSSING SYSTEM MARKET, 2021
     11.4 REVENUE ANALYSIS, 2021 
             FIGURE 40 REVENUE ANALYSIS FOR KEY COMPANIES IN DEGAUSSING SYSTEM MARKET, 2021
     11.5 MARKET SHARE ANALYSIS, 2021 
             FIGURE 41 MARKET SHARE ANALYSIS FOR KEY COMPANIES IN DEGAUSSING SYSTEM MARKET, 2021
             TABLE 213 DEGAUSSING SYSTEM MARKET: DEGREE OF COMPETITION
     11.6 COMPETITIVE EVALUATION QUADRANT 
             11.6.1 STARS
             11.6.2 EMERGING LEADERS
             11.6.3 PERVASIVE COMPANIES
             11.6.4 PARTICIPANTS
                        FIGURE 42 COMPETITIVE LEADERSHIP MAPPING, 2021
     11.7 COMPETITIVE BENCHMARKING 
                        TABLE 214 DEGAUSSING SYSTEM MARKET: DETAILED LIST OF KEY STARTUPS/SMES
                        TABLE 215 DEGAUSSING SYSTEM MARKET: COMPETITIVE BENCHMARKING OF KEY PLAYERS (STARTUPS/SMES)
     11.8 COMPETITIVE SCENARIO 
             11.8.1 PRODUCT LAUNCHES
                        TABLE 216 DEGAUSSING SYSTEM MARKET: PRODUCT LAUNCHES, MARCH 2017–APRIL 2020
             11.8.2 DEALS
                        TABLE 217 DEGAUSSING SYSTEM MARKET: DEALS, APRIL 2019–OCTOBER 2022
             11.8.3 OTHERS
                        TABLE 218 DEGAUSSING SYSTEM MARKET: OTHERS, JANUARY 2019–JANUARY 2022
 
12 COMPANY PROFILES (Page No. - 162)
     12.1 INTRODUCTION 
(Business overview, Products/Services/Solutions offered, Recent developments & MnM View)*  
     12.2 KEY PLAYERS 
             12.2.1 LARSEN & TOUBRO LIMITED
                        TABLE 219 LARSEN & TOUBRO LIMITED: BUSINESS OVERVIEW
                        FIGURE 43 LARSEN & TOUBRO LIMITED: COMPANY SNAPSHOT
                        TABLE 220 LARSEN & TOUBRO LIMITED: PRODUCTS/SOLUTIONS/SERVICES OFFERED
                        TABLE 221 LARSEN & TOUBRO LIMITED: PRODUCT LAUNCH
                        TABLE 222 LARSEN & TOUBRO LIMITED: DEALS
             12.2.2 POLYAMP AB
                        TABLE 223 POLYAMP AB: BUSINESS OVERVIEW
                        TABLE 224 POLYAMP AB: PRODUCTS/SOLUTIONS/SERVICES OFFERED
             12.2.3 WARTSILA
                        TABLE 225 WARTSILA: BUSINESS OVERVIEW
                        FIGURE 44 WARTSILA: COMPANY SNAPSHOT
                        TABLE 226 WARTSILA: PRODUCTS/SOLUTIONS/SERVICES OFFERED
                        TABLE 227 WARTSILA: DEALS
             12.2.4 ULTRA ELECTRONICS HOLDINGS PLC
                        TABLE 228 ULTRA ELECTRONICS HOLDINGS PLC: BUSINESS OVERVIEW
                        FIGURE 45 ULTRA ELECTRONICS HOLDINGS PLC: COMPANY SNAPSHOT
                        TABLE 229 ULTRA ELECTRONICS HOLDINGS PLC: PRODUCTS/SOLUTIONS/SERVICES OFFERED
                        TABLE 230 ULTRA ELECTRONICS HOLDINGS PLC: DEALS
             12.2.5 ECA GROUP
                        TABLE 231 ECA GROUP: BUSINESS OVERVIEW
                        FIGURE 46 ECA GROUP: COMPANY SNAPSHOT
                        TABLE 232 ECA GROUP: PRODUCTS/SOLUTIONS/SERVICES OFFERED
                        TABLE 233 ECA GROUP: DEALS
                        TABLE 234 ECA GROUP: OTHERS
             12.2.6 IFEN S.P.A.
                        TABLE 235 IFEN S.P.A.: BUSINESS OVERVIEW
                        TABLE 236 IFEN S.P.A.: PRODUCTS/SOLUTIONS/SERVICES OFFERED
             12.2.7 DAYATECH MERIN SDN. BHD.
                        TABLE 237 DAYATECH MERIN SDN. BHD.: BUSINESS OVERVIEW
                        TABLE 238 DAYATECH MERIN SDN. BHD.: PRODUCTS/SOLUTIONS/SERVICES OFFERED
             12.2.8 AMERICAN SUPERCONDUCTOR CORPORATION
                        TABLE 239 AMERICAN SUPERCONDUCTOR CORPORATION: BUSINESS OVERVIEW
                        FIGURE 47 AMERICAN SUPERCONDUCTOR CORPORATION: COMPANY SNAPSHOT
                        TABLE 240 AMERICAN SUPERCONDUCTOR CORPORATION: PRODUCTS/SOLUTIONS/SERVICES OFFERED
                        TABLE 241 AMERICAN SUPERCONDUCTOR CORPORATION: DEALS
             12.2.9 STL SYSTEMS AG
                        TABLE 242 STL SYSTEMS AG: BUSINESS OVERVIEW
                        TABLE 243 STL SYSTEMS AG: PRODUCTS/SOLUTIONS/SERVICES OFFERED
                        TABLE 244 STL SYSTEMS AG: PRODUCT LAUNCHES
             12.2.10 DA-GROUP
                        TABLE 245 DA-GROUP: BUSINESS OVERVIEW
                        TABLE 246 DA-GROUP: PRODUCTS/SOLUTIONS/SERVICES OFFERED
                        TABLE 247 DA-GROUP: OTHER
             12.2.11 L3HARRIS TECHNOLOGIES, INC.
                        TABLE 248 L3HARRIS TECHNOLOGIES, INC.: BUSINESS OVERVIEW
                        FIGURE 48 L3HARRIS TECHNOLOGIES, INC.: COMPANY SNAPSHOT
                        TABLE 249 L3HARRIS TECHNOLOGIES, INC.: PRODUCTS/SOLUTIONS/SERVICES OFFERED
                        TABLE 250 L3HARRIS TECHNOLOGIES, INC.: DEALS
                        TABLE 251 L3HARRIS TECHNOLOGIES, INC.: OTHERS
*Details on Business overview, Products/Services/Solutions offered, Recent developments & MnM View might not be captured in case of unlisted companies.  
 
13 APPENDIX (Page No. - 190)
     13.1 DISCUSSION GUIDE 
     13.2 KNOWLEDGESTORE: MARKETSANDMARKETS’ SUBSCRIPTION PORTAL 
     13.3 CUSTOMIZATION OPTIONS 
     13.4 RELATED REPORTS 
     13.5 AUTHOR DETAILS 


This research study on the degaussing system market involved extensive use of secondary sources, directories, and databases such as Hoovers, Bloomberg BusinessWeek, and Factiva to identify and collect information relevant to the market. The primary sources considered included industry experts as well as service providers, manufacturers, solution providers, technology developers, alliances, and organizations related to all segments of the value chain of this market. In-depth interviews with various primary respondents, including key industry participants, subject matter experts (SMEs), industry consultants, and C-level executives, were conducted to obtain and verify critical qualitative and quantitative information pertaining to the degaussing system market as well as assess its growth prospects.

Secondary Research

The secondary sources referred for this research study on the degaussing system market included financial statements of companies offering degaussing system and solutions along with various trade, business, and professional associations, among others. The secondary data was collected and analyzed to arrive at the overall size of the degaussing system market, which was validated by primary respondents.

Primary Research

In the primary research process, various sources from the supply and demand sides were interviewed to obtain qualitative and quantitative information on the market. The primary sources from the supply side included industry experts such as chief X officers (CXOs), vice presidents (VPs), directors, regional managers, and business development and product development teams, distributors, and vendors.

Extensive primary research was conducted to obtain qualitative and quantitative information such as market statistics, average selling price, market breakdowns, market size estimations, market forecasting, and data triangulation. Primary research also helped in understanding the various trends related to vessel type, solution, end user, and regions. Stakeholders from the demand side include naval forces, government agencies, and ship-building companies who are willing to adopt degaussing systems to enhance ship protection and warfare capabilities. These interviews were conducted to gather insights such as market statistics, data of revenue collected from the hardware systems and software solutions, market breakdowns, market size estimations, market size forecasting, and data triangulation. These interviews also helped analyze the solution adoption by vessel type, solution, and end user segments of the market for key regions such as North America, Europe, Asia Pacific, and Rest of the world.
Degaussing System Market Size, and Share

To know about the assumptions considered for the study, download the pdf brochure

Market Size Estimation

The top-down and bottom-up approaches were used to estimate and validate the size of the degaussing system market. The figure in the section below is a representation of the overall market size estimation process employed for the purpose of this study. The research methodology used to estimate the market size also includes the following details.

  • Key players in the market were identified through secondary research, and their market values were determined through primary and secondary research. These included a study of annual and financial reports of top market players and extensive interviews with leaders, including CEOs, directors, and marketing executives.
  • All percentage shares, splits, and breakdowns were determined using secondary sources and verified through primary sources.
  • All possible parameters that affect the markets covered in this research study were considered, viewed in extensive detail, verified through primary research, and analyzed to obtain the final quantitative and qualitative data. This data was consolidated, added with detailed inputs, and analyzed and presented in this report.

This data was compiled, enhanced with detailed inputs, analyzed by MarketsandMarkets, and presented in this report.

Market size Estimation Methodology: Bottom-up Approach
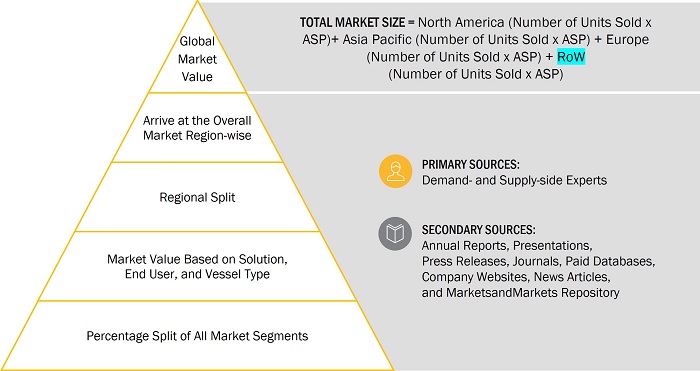
Degaussing System Market Size, and Bottom-up approach

Market size Estimation Methodology: Top- Down approach
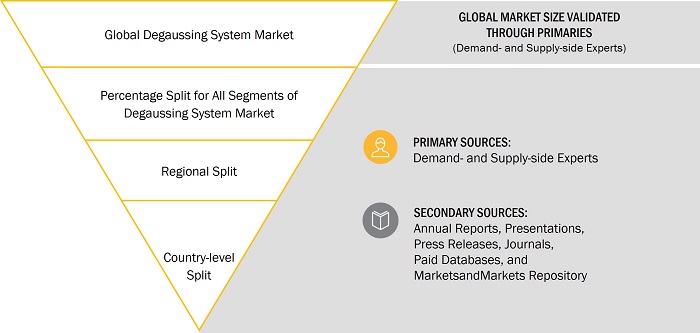
Degaussing System Market Size, and Top- Down Approach

Data Triangulation

After arriving at the overall market size, the total market was split into several segments and subsegments. Data triangulation and market breakdown procedures were implemented, wherever applicable, to complete the overall market engineering process and arrive at the exact statistics for all segments and subsegments. Data was triangulated by studying various factors from the demand- and supply sides. In addition, the market size was validated using top-down and bottom-up approaches.

The following figure indicates the market breakdown structure and data triangulation procedure implemented in the market engineering process for developing this report.

Report Objectives

  • To define, describe, segment, and forecast the degaussing system market based on end user, solution, vessel type, and region
  • To identify and analyze key drivers, restraints, opportunities, and industry-specific challenges influencing the market growth
  • To identify industry, market, and technology trends that prevail in the degaussing system market
  • To analyze micromarkets concerning individual growth trends, prospects, and their market contribution
  • To forecast the size of different market segments with respect to various regions, including North America, Europe, Asia Pacific, and Rest of the World, in addition to key countries in each of these regions
  • To profile leading market players based on their product portfolios, financial positions, and key growth strategies
  • To analyze the degree of competition in the degaussing system market by identifying key growth strategies, such as contracts, acquisitions, agreements, expansions, investments, and new product launches adopted by leading market players
  • To provide a detailed competitive landscape of the market, in addition to the rank analysis of key players
  • To provide a comprehensive analysis of business and corporate strategies adopted by key market players
  • To strategically profile key market players and comprehensively analyze their core competencies

Available customizations

Along with the market data, MarketsandMarkets offers customizations as per the specific needs of companies. The following customization options are available for the report:

Product Analysis

  • Product matrix, which gives a detailed comparison of the product portfolio of each company

Regional Analysis

  • Further breakdown of the market segments at country-level

Company Information

  • Detailed analysis and profiling of additional market players (up to 5)
Custom Market Research Services

We will customize the research for you, in case the report listed above does not meet with your exact requirements. Our custom research will comprehensively cover the business information you require to help you arrive at strategic and profitable business decisions.

Request Customization

Instant Answers with GPT - Ask Now!

Ask real questions. Get complete answers !
Report Code
AS 6411
Published ON
Jan, 2023
Choose License Type
BUY NOW
  • SHARE
X
Request Customization
Speak to Analyst
Speak to Analyst
OR FACE-TO-FACE MEETING
PERSONALIZE THIS RESEARCH
  • Triangulate with your Own Data
  • Get Data as per your Format and Definition
  • Gain a Deeper Dive on a Specific Application, Geography, Customer or Competitor
  • Any level of Personalization
REQUEST A FREE CUSTOMIZATION
LET US HELP YOU!
  • What are the Known and Unknown Adjacencies Impacting the Degaussing System Market
  • What will your New Revenue Sources be?
  • Who will be your Top Customer; what will make them switch?
  • Defend your Market Share or Win Competitors
  • Get a Scorecard for Target Partners
CUSTOMIZED WORKSHOP REQUEST
+1-888-600-6441
  • Call Us
  • +1-888-600-6441 (Corporate office hours)
  • +1-888-600-6441 (US/Can toll free)
  • +44-800-368-9399 (UK office hours)
CONNECT WITH US
ABOUT TRUST ONLINE
©2024 MarketsandMarkets Research Private Ltd. All rights reserved
DMCA.com Protection Status Website Feedback