DevSecOps Market by Component (Solution and Services), Deployment Type (On-premises and Cloud), Organization Size, Vertical (BFSI, IT and Telecommunications, Manufacturing, and Government and Public Sector), and Region - Global Forecast to 2023


DevSecOps Market Overview
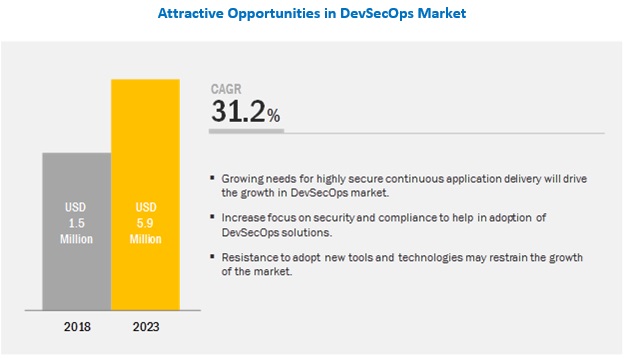
[148 Pages Report] The DevSecOps market size is expected to grow from USD 1.5 billion in 2018 to USD 5.9 billion by 2023, at a Compound Annual Growth Rate (CAGR) of 31.2% during the forecast period. The growing need for higher secure continuous application delivery and the increased focus on security on security and compliance are the major growth factors for the DevSecOps market. The report provides detailed insights into the market by component (solutions and services). Deployment type, organization size, vertical, and region. Among components, the services segment is inclusive of professional services and managed services.
By Deployment type, the cloud segment is estimated to be a larger contributor to the DevSecOps market growth during the forecast period
Deploying DevSecOps solutions on the cloud helps organizations deploy their codes in their production process, along with enhanced security, performance, and scalability. The cloud deployment type benefits organizations with increased scalability, speed, 24/7 services, and enhanced IT security. DevSecOps practices will help reduce Operational Expenditure (OPEX) using process standardization and automation processes, along with complete control and availability of an environment based on users� needs.
Enhanced security, increased agility, and improved efficiency benefits are expected to encourage the adoption of DevSecOps solutions among SMEs
The DevSecOps market has been segmented by organization size, which has further been segmented into large enterprises and Small and Medium-sized Enterprises (SMEs). The growing awareness of the benefits of DevOps and cloud solutions, the rise of threats and vulnerabilities leading organizations to increase their focus on the security of their applications, and the business expansions by global vendors are expected to be the driving factors for the growth of the overall market.
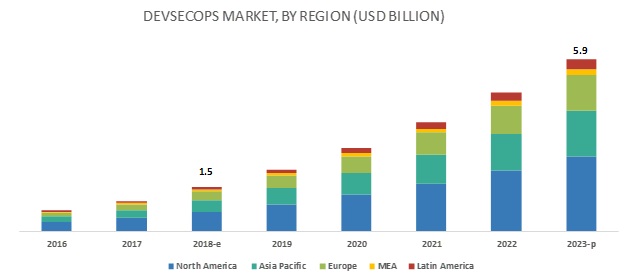
APAC is estimated to account for the largest DevSecOps market size during the forecast period
The APAC region is expected to offer extensive growth opportunities for the market during the forecast period. Rapid advancements in cloud computing, IT infrastructure services, and Internet of Things (IoT) have led many organizations to adopt DevSecOps solutions and services. With the increasing adoption of cloud technologies and the rising IT demands for business functions, the adoption of secure software development and deployment tools is expected to increase rapidly during the forecast year. Due to the huge customer potential of this region, organizations around the globe want to set their footprint here. Such factors encourage the adoption of DevSecOps solutions and services, which, in turn, would prove to be beneficial for enterprises.
Key Market Players
The major vendors in the DevSecOps market are CA Technologies (US), IBM (US), MicroFocus (UK), Synopsys (US), Microsoft (US), Google (US), Dome9 (US), PaloAltoNetworks (US), Qualys (US), Chef Software (US), Threat Modeler (US), Contrast Security (US), CyberArk (Israel), Entersoft (Australia), Rough Wave Software (US), Splunk (US), 4Armed (UK), Aqua Security (Israel), Check Marx (Israel), Continuum Security (Spain), Whitehat Security (US), Sumologic (US), Puppetlabs (UK), and Algo Sec (US).
IBM is one of the key players in the market that provides a comprehensive range of solutions. IBM has also adopted inorganic growth strategies to maintain its leading position in the market. For instance, in October 2018, IBM acquired Red Hat. The acquisition was aimed to increase the market share of IBM in the DevOps market. Moreover, IBM is focused on partnering with other potential market players in this market to offer enhanced and integrated solutions that would meet the growing customers� demands.
Recent Developments
- In June 2018, ThreatModeler announced the launch of Threat-Modeling-as-a-Service (TMaaS) solution. TMaaS is a managed solution that aims to transform organizations� cybersecurity and risk management needs using the automated, collaborative threat modeling solution.
- In September 2018, Aqua Security introduced risk assessment controls for server-less functions and container encryption.
- In May 2018, Micro Focus launched the ITOM Platform, which integrates DevOps with AIOps to speed up service delivery across large-scale hybrid IT environments.
Get online access to the report on the World's First Market Intelligence Cloud
- Easy to Download Historical Data & Forecast Numbers
- Company Analysis Dashboard for high growth potential opportunities
- Research Analyst Access for customization & queries
- Competitor Analysis with Interactive dashboard
- Latest News, Updates & Trend analysis
Request Sample Scope of the Report
Get online access to the report on the World's First Market Intelligence Cloud
- Easy to Download Historical Data & Forecast Numbers
- Company Analysis Dashboard for high growth potential opportunities
- Research Analyst Access for customization & queries
- Competitor Analysis with Interactive dashboard
- Latest News, Updates & Trend analysis

|
Report Metric |
Details |
|
Market size available for years |
2016�2023 |
|
Base year considered |
2017 |
|
Forecast period |
2018�2023 |
|
Forecast unit |
Value (USD) |
|
Segments covered |
Components, Deployment Types, Organization Size, Verticals, and Region |
|
Geographies covered |
North America, Asia Pacific (APAC), Europe, Latin America, and Middle East and Africa (MEA) |
|
Companies covered |
CA Technologies (US), IBM (US), MicroFocus (UK), Synopsys (US), Microsoft (US), Google (US), Dome9 (US), Riverbed Technologies (US), Fastly (US), Dialogic (US), Avi Networks (US), Joyent (US), Inlab Software (Germany), Cloudflare, Inc. (US), Zevenet (Spain), Array Networks (US), and 20 more companies. |
The research report categorizes the DevSecOps market to forecast the revenues and analyze the trends in each of the following subsegments:
By Component
- Solution
- Services
By Service
- Professional Services
- Managed Services
By Deployment Type
- On-premises
- Cloud
By Organization Size
- Small and Medium-sized Enterprises (SMEs)
- Large Enterprises
By Vertical
- Banking, Financial Services, and Insurance (BFSI)
- IT and Telecom
- Government and Public Sector
- Retail and Consumer goods
- Manufacturing
- Energy and Utilities
- Healthcare and Lifesciences
- Media and Entertainment
- Others (Education, and Travel and Hospitality)
DevSecOps Market By Region
- North America
- US
- Canada
- Europe
- UK
- France
- Germany
- Other European Countries
- APAC
- China
- Japan
- Australia and New Zealand (ANZ)
- Other APAC Countries
- MEA
- Kingdom of Saudi Arabia (KSA)
- South Africa
- United Arab Emirates (UAE)
- Other MEA Countries
- Latin America
- Brazil
- Mexico
- Other Latin American Countries
Critical questions the report answers:
- Where will all these developments take the industry in the mid- to long-term?
- What are the upcoming industry applications for the DevSecOps market?
- Which segment provides the most opportunity for growth?
- Who are the leading vendors operating in this market?
- What are the opportunities for new market entrants?
To speak to our analyst for a discussion on the above findings, click Speak to Analyst
Table of Contents
1 Introduction (Page No. - 16)
1.1 Objectives of the Study
1.2 Market Definition
1.3 Market Segmentation
1.4 Years Considered for the Study
1.5 Currency
1.6 Stakeholders
2 Research Methodology (Page No. - 19)
2.1 Research Data
2.1.1 Secondary Data
2.1.2 Primary Data
2.1.2.1 Breakup of Primaries
2.1.2.2 Key Industry Insights
2.2 Market Breakup and Data Triangulation
2.3 Market Size Estimation
2.3.1 Bottom-Up Approach
2.3.2 Top-Down Approach
2.4 Assumptions for the Study
2.5 Limitations of the Study
3 Executive Summary (Page No. - 26)
4 Premium Insights (Page No. - 29)
4.1 Attractive Growth Opportunities in the DevSecOps Market
4.2 Market By Component, 2018
4.3 Market By Deployment Type, 2018
4.4 Market By Vertical, 2018
4.5 Market Investment Scenario, 2018�2023
5 Market Overview (Page No. - 32)
5.1 Introduction
5.2 Market Dynamics
5.2.1 Drivers
5.2.1.1 Growing Need for Highly Secure and Continuous Application Delivery
5.2.1.2 Increasing Focus on Security and Compliance
5.2.1.3 Growing Awareness of Benefits of DevOps Among Enterprises
5.2.2 Restraints
5.2.2.1 Resistance to the Adoption of New Tools and Technologies
5.2.3 Opportunities
5.2.3.1 Huge Opportunity for Adoption Among SMEs
5.2.4 Challenges
5.2.4.1 Lack of Skilled Professionals
5.2.4.2 Dependency on Obsolete Application Development Processes
6 DevSecOps Market, By Component (Page No. - 36)
6.1 Introduction
6.2 Solution
6.2.1 Companies With DevOps Framework to Adopt DevSecOps Solutions to Deliver Higher Level of Security and Efficiency in Their Applications
6.3 Services
6.3.1 Professional Services
6.3.1.1 Professional Services Help Organizations Align Their DevOps Processes Efficiently With Required Security Tools
6.3.2 Managed Services
6.3.2.1 Managed Services to Enable Efficient and Smooth Functioning of DevSecOps Processes
7 Market, By Deployment Type (Page No. - 41)
7.1 Introduction
7.2 Cloud
7.2.1 Cloud Deployment Type to Enable Enhanced Infrastructure Scalability and Business Performance
7.3 On-Premises
7.3.1 On-Premises Deployment to Eliminate Third-Party Involvement and Access to Business-Critical Data
8 DevSecOps Market, By Organization Size (Page No. - 45)
8.1 Introduction
8.2 Small and Medium-Sized Enterprises
8.2.1 Enhanced Security, Increased Agility, and Improved Efficiency Benefits to Encourage the Adoption of DevSecOps Solutions
8.3 Large Enterprises
8.3.1 DevSecOps Solutions to Deliver Applications Faster and Efficiently and Reduce Vulnerabilities and Attacks to A Great Extent
9 DevSecOps Market, By Vertical (Page No. - 49)
9.1 Introduction
9.2 Banking, Financial Services, and Insurance
9.2.1 DevSecOps Solutions to Provide Faster and Reliable Deployment of Applications and Enhanced Security
9.3 IT and Telecommunications
9.3.1 DevSecOps Solutions to Enhance Product Portfolios and assist in Quickly Launching Them
9.4 Government and Public Sector
9.4.1 DevSecOps Solutions to Provide Faster Response Time to Quickly Respond to Citizens� Grievances and Issues
9.5 Retail and Consumer Goods
9.5.1 DevSecOps Solutions to Align Application Security Process With Cloud-Native Application Development and Deployment Process to Embrace A Security-Minded Business Culture
9.6 Manufacturing
9.6.1 DevSecOps Solutions to Enable Secure and Reliable Development and Release of Software
9.7 Energy and Utilities
9.7.1 Lower CAPEX and OPEX, DevOps Compliance, and Better Resource Utilization Benefits to Lead to the Adoption of DevSecOps Solutions
9.8 Media and Entertainment
9.8.1 Enhanced Application Security and Effective Time and Cost Management Features of DevSecOps to Enhance Customer Experience
9.9 Healthcare and Life Sciences
9.9.1 Faster and Efficient Application Delivery Benefits to Result in Advanced Medication and Faster Response Time to Emergency Situations
9.10 Others
10 DevSecOps Market, By Region (Page No. - 60)
10.1 Introduction
10.2 North America
10.2.1 United States
10.2.1.1 Growing Need to Address the Rising Amount of Security Breaches
10.2.2 Canada
10.2.2.1 Awareness of Cloud and Its Benefits to Drive the Adoption of DevSecOps Solutions
10.3 Europe
10.3.1 United Kingdom
10.3.1.1 UK to Adopt More Security-Related Services for Enhanced Application Security and Other Such Benefits
10.3.2 Germany
10.3.2.1 Existing Cloud Infrastructure to Make It Easier and Cheaper to Operate Business Activities Locally
10.3.3 France
10.3.3.1 Leading Cloud Players to Expand Their Cloud and Infrastructure Businesses in France
10.3.4 Rest of Europe
10.4 Asia Pacific
10.4.1 China
10.4.1.1 Government Initiatives to Expand and Develop the Cloud Industry
10.4.2 Japan
10.4.2.1 Enterprises� Constant Focus to Upgrade Their IT Infrastructures and Enhance Business Applications
10.4.3 Australia and New Zealand
10.4.3.1 Advanced and Reliable IT Infrastructure and Trade-Friendly Policies to Increase the Adoption Rate of DevSecOps Solutions
10.4.4 Rest of Asia Pacific
10.5 Middle East and Africa
10.5.1 Kingdom of Saudi Arabia
10.5.1.1 KSA to Gain A Positive Outlook Toward Regulatory Compliances
10.5.2 United Arab Emirates
10.5.2.1 Government Initiatives to Develop More Electronic Services and Embrace Smart Services
10.5.3 South Africa
10.5.3.1 South Africa to Focus More on Reducing Deployment Constraints
10.5.4 Rest of Middle East and Africa
10.6 Latin America
10.6.1 Brazil
10.6.1.1 Growing Need to Modernize Enterprises� Infrastructure
10.6.2 Mexico
10.6.2.1 Need to Become Digitally Advanced and Technically Well-Established
10.6.3 Rest of Latin America
11 Competitive Landscape (Page No. - 86)
11.1 Overview
11.2 Competitive Scenario
11.2.1 New Product Launches/Product Enhancements
11.2.2 Partnerships, Agreements, and Collaborations
11.2.3 Mergers and Acquisitions
12 Company Profiles (Page No. - 91)
(Business Overview, Products Offered, Recent Developments, SWOT Analysis, MnM View)*
12.1 Introduction
12.2 CA Technologies
12.3 IBM
12.4 MicroFocus
12.5 Synopsys
12.6 Microsoft
12.7 Google
12.8 Dome9
12.9 PaloAltoNetworks
12.10 Qualys
12.11 Chef Software
12.12 Threatmodeler
12.13 Contrast Security
12.14 CyberArk
12.15 Entersoft
12.16 Rogue Wave Software
12.17 Splunk
12.18 4Armed
12.19 Aqua Security
12.20 Check Marx
12.21 Cloudpassage
12.22 Continuum Security
12.23 Puppet
12.24 Sumo Logic
12.25 Whitehat
12.26 Algosec
*Details on Business Overview, Products Offered, Recent Developments, SWOT Analysis, MnM View Might Not Be Captured in Case of Unlisted Companies.
13 Appendix (Page No. - 141)
13.1 Discussion Guide
13.2 Knowledge Store: MarketsandMarkets� Subscription Portal
13.3 Available Customizations
13.4 Related Reports
13.5 Author Details
List of Tables (65 Tables)
Table 1 DevSecOps Market Size, By Component, 2016�2023 (USD Million)
Table 2 Solution: Market Size By Region, 2016�2023 (USD Million)
Table 3 Services: Market Size By Region, 2016�2023 (USD Million)
Table 4 Market Size, By Deployment Type, 2016�2023 (USD Million)
Table 5 Cloud: Market Size By Region, 2016�2023 (USD Million)
Table 6 On-Premises: Market Size By Region, 2016�2023 (USD Million)
Table 7 Market Size, By Organization Size, 2016�2023 (USD Million)
Table 8 Small and Medium-Sized Enterprises: Market Size By Region, 2016�2023 (USD Million)
Table 9 Large Enterprises: Market Size By Region, 2016�2023 (USD Million)
Table 10 DevSecOps Market Size, By Vertical, 2016�2023 (USD Million)
Table 11 Banking, Financial Services, and Insurance: Market Size By Region, 2016�2023 (USD Million)
Table 12 IT and Telecommunications: Market Size By Region, 2016�2023 (USD Million)
Table 13 Government and Public Sector: Market Size By Region, 2016�2023 (USD Million)
Table 14 Retail and Consumer Goods: Market Size By Region, 2016�2023 (USD Million)
Table 15 Manufacturing: Market Size By Region, 2016�2023 (USD Million)
Table 16 Energy and Utilities: Market Size By Region, 2016�2023 (USD Million)
Table 17 Media and Entertainment: Market Size By Region, 2016�2023 (USD Million)
Table 18 Healthcare and Life Sciences: Market Size By Region, 2016�2023 (USD Million)
Table 19 Others: Market Size By Region, 2016�2023 (USD Million)
Table 20 DevSecOps Market Size, By Region, 2016�2023 (USD Million)
Table 21 North America: Market Size By Component, 2016�2023 (USD Million)
Table 22 North America: Market Size By Deployment Type, 2016�2023 (USD Million)
Table 23 North America: Market Size By Organization Size, 2016�2023 (USD Million)
Table 24 North America: Market Size By Vertical, 2016�2023 (USD Million)
Table 25 North America: Market Size By Country, 2016�2023 (USD Million)
Table 26 United States: Market Size, By Organization Size, 2016�2023 (USD Million)
Table 27 Canada: DevSecOps Market Size, By Organization Size, 2016�2023 (USD Million)
Table 28 Europe: Market Size By Component, 2016�2023 (USD Million)
Table 29 Europe: Market Size By Deployment Type, 2016�2023 (USD Million)
Table 30 Europe: Market Size By Organization Size, 2016�2023 (USD Million)
Table 31 Europe: Market Size By Vertical, 2016�2023 (USD Million)
Table 32 Europe: Market Size By Country, 2016�2023 (USD Million)
Table 33 United Kingdom: DevSecOps Market Size, By Organization Size, 2016�2023 (USD Million)
Table 34 Germany: Market Size By Organization Size, 2016�2023 (USD Million)
Table 35 France: Market Size By Organization Size, 2016�2023 (USD Million)
Table 36 Rest of Europe: Market Size By Organization Size, 2016�2023 (USD Million)
Table 37 Asia Pacific: Market Size By Component, 2016�2023 (USD Million)
Table 38 Asia Pacific: Market Size By Deployment Type, 2016�2023 (USD Million)
Table 39 Asia Pacific: Market Size By Organization Size, 2016�2023 (USD Million)
Table 40 Asia Pacific: Market Size By Vertical, 2016�2023 (USD Million)
Table 41 Asia Pacific: Market Size By Country, 2016�2023 (USD Million)
Table 42 China: Market Size By Organization Size, 2016�2023 (USD Million)
Table 43 Japan: Market Size By Organization Size, 2016�2023 (USD Million)
Table 44 Australia and New Zealand: DevSecOps Market Size, By Organization Size, 2016�2023 (USD Million)
Table 45 Rest of Asia Pacific: Market Size By Organization Size, 2016�2023 (USD Million)
Table 46 Middle East and Africa: Market Size By Component, 2016�2023 (USD Million)
Table 47 Middle East and Africa: Market Size By Deployment Type, 2016�2023 (USD Million)
Table 48 Middle East and Africa: Market Size By Organization Size, 2016�2023 (USD Million)
Table 49 Middle East and Africa: Market Size By Vertical, 2016�2023 (USD Million)
Table 50 Middle East and Africa: Market Size By Country, 2016�2023 (USD Million)
Table 51 Kingdom of Saudi Arabia: Market Size By Organization Size, 2016�2023 (USD Million)
Table 52 United Arab Emirates: Market Size, By Organization Size, 2016�2023 (USD Million)
Table 53 South Africa: DevSecOps Market Size, By Organization Size, 2016�2023 (USD Million)
Table 54 Rest of Middle East and Africa: Market Size By Organization Size, 2016�2023 (USD Million)
Table 55 Latin America: Market Size By Component, 2016�2023 (USD Million)
Table 56 Latin America: Market Size By Deployment Type, 2016�2023 (USD Million)
Table 57 Latin America: Market Size By Organization Size, 2016�2023 (USD Million)
Table 58 Latin America: Market Size By Vertical, 2016�2023 (USD Million)
Table 59 Latin America: Market Size By Country, 2016�2023 (USD Million)
Table 60 Brazil: Market Size By Organization Size, 2016�2023 (USD Million)
Table 61 Mexico: Market Size By Organization Size, 2016�2023 (USD Million)
Table 62 Rest of Latin America: DevSecOps Market Size, By Organization Size, 2016�2023 (USD Million)
Table 63 New Product Launches/Product Enhancements, 2018
Table 64 Partnerships, Agreements, and Collaborations, 2017�2018
Table 65 Mergers and Acquisitions, 2018
List of Figures (37 Figures)
Figure 1 Regions Covered
Figure 2 Market Research Design
Figure 3 Market Bottom-Up Approach
Figure 4 Market Top-Down Approach
Figure 5 Global DevSecOps Market Size, 2016�2023 (USD Million)
Figure 6 Segments With the Highest CAGRs in the Market
Figure 7 North America Accounted for the Largest Market Size in 2018
Figure 8 Growing Need for Highly Secure and Continuous Application Delivery to Drive the DevSecOps Market
Figure 9 Solutions Segment to Have A Higher Market Share in 2018
Figure 10 On-Premises Deployment Type to Have A Higher Market Share in 2018
Figure 11 Banking, Financial Services, and Insurance Vertical to Hold the Largest Market Size in 2018
Figure 12 Asia Pacific to Emerge as the Best Market for Investments in the Next 5 Years
Figure 13 Drivers, Restraints, Opportunities, and Challenges: DevSecOps Market
Figure 14 Services Segment to Grow at A Higher Rate During the Forecast Period
Figure 15 Cloud Deployment Type to Grow at A Higher Rate During the Forecast Period
Figure 16 Small and Medium-Sized Enterprises Segment to Grow at A Higher Rate During the Forecast Period
Figure 17 Retail and Consumer Goods Vertical to Grow at the Highest Rate During the Forecast Period
Figure 18 Asia Pacific to Grow at the Highest Rate During the Forecast Period
Figure 19 North America: Market Snapshot
Figure 20 Asia Pacific: Market Snapshot
Figure 21 Key Developments in the DevSecOps Market During 2017�2018
Figure 22 Geographic Revenue Mix of Top 5 Players
Figure 23 CA Technologies: Company Snapshot
Figure 24 SWOT Analysis: CA Technologies
Figure 25 IBM: Company Snapshot
Figure 26 SWOT Analysis: IBM
Figure 27 Micro Focus: Company Snapshot
Figure 28 SWOT Analysis: Micro Focus
Figure 29 Synopsys: Company Snapshot
Figure 30 Synopsys: SWOT Analysis
Figure 31 Microsoft: Company Snapshot
Figure 32 SWOT Analysis: Microsoft
Figure 33 Google: Company Snapshot
Figure 34 Palo Alto Networks: Company Snapshot
Figure 35 Qualys: Company Snapshot
Figure 36 CyberArk: Company Snapshot
Figure 37 Splunk: Company Snapshot
The study involved 4 major activities to estimate the current market size of the DevSecOps solutions. Exhaustive secondary research was done to collect information on the market, the peer market, and the parent market. The next step was to validate these findings, assumptions, and sizing with industry experts across the value chain through primary research. Both top-down and bottom-up approaches were employed to estimate the complete market size. After that, the market breakup and data triangulation procedures were used to estimate the market size of the segments and subsegments.
Secondary Research
In the secondary research process, various secondary sources were referred to for identifying and collecting information for this study. The secondary sources included annual reports, press releases, and investor presentations of companies; whitepapers such as Cisco Cloud Index; certified publications; and articles from recognized associations, such as data center knowledge and government publishing sources. Secondary sources such as Factiva and D&B hoovers were also considered for this study. Secondary research was mainly used to obtain key information about the industry�s value chain, the total pool of key players, market classification and segmentation as per the industry trends to the bottom-most level, regional markets, and key developments from both market and technology-oriented perspectives.
Primary Research
In the primary research process, various primary sources from both the supply and demand sides were interviewed to obtain qualitative and quantitative information for this report. Primary sources from the supply-side included industry experts, such as Chief Executive Officers (CEOs), Vice Presidents (VPs), marketing directors, technology and innovation directors, and related key executives from various key companies and organizations providing load balancer software and services. The primary sources from the demand-side included the end-users of DevSecOps solutions, which included Chief Information Officers (CIOs), IT technicians and technologists, and IT managers at public and investor-owned utilities.
The following figure depicts the breakup of the primary profiles:
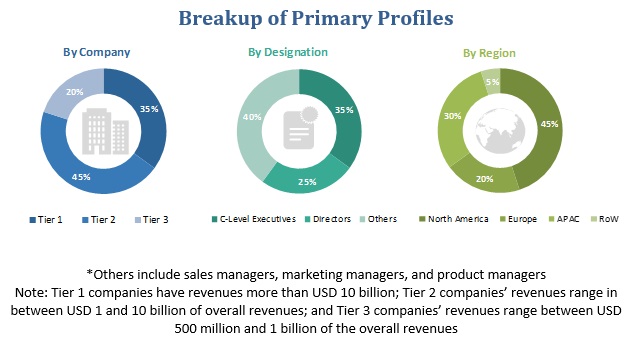
To know about the assumptions considered for the study, download the pdf brochure
Market Size Estimation
Both top-down and bottom-up approaches were used to estimate and validate the total size of the DevSecOps market. They were also used extensively to estimate the size of various subsegments in the market. The research methodology used to estimate the market size includes the following:
- The key players in the industry and markets have been identified through extensive secondary research.
- The industry�s supply chain and market size, in terms of value, have been determined through primary and secondary research processes.
- All percentage shares, splits, and breakdowns have been determined using secondary sources and verified through primary sources.
Data Triangulation
After arriving at the overall market size using the market size estimation processes as explained above�the market was split into several segments and subsegments. To complete the overall market engineering process and arrive at the exact statistics of each market segment and subsegment, the data triangulation and market breakup procedures were employed, wherever applicable. The data was triangulated by studying several factors and trends from both, the demand and supply sides, in the DevSecOps market.
Report Objectives
- To define, segment, and project the global market size of the DevSecOps market
- To understand the structure of the market by identifying its various subsegments
- To provide detailed information about the key factors (drivers, restraints, opportunities, and industry-specific challenges) influencing the growth of the market
- To analyze the micromarkets with respect to individual growth trends, prospects, and their contribution to the total market
- To project the size of the market and its submarkets, in terms of value, with respect to the 5 major regions (along with their respective key countries)
- To profile key players and comprehensively analyze their core competencies
- To understand the competitive landscape and identify major growth strategies adopted by players across key regions
- To analyze the competitive developments, such as expansions and investments, new product launches, mergers and acquisitions, joint ventures, and agreements, in the market
Available Customizations
With the given market data, MarketsandMarkets offers customizations as per the company�s specific needs and on best effort basis for profiling of additional market players.


Growth opportunities and latent adjacency in DevSecOps Market
What are the potentially exploring opportunities in the DevSecOps Market?