Digital Twin in Finance Market

Digital Twin in Finance Market by Offering (Platforms & Solutions and Services), End-use Industry (BFSI (Banking, Financial Services, and Insurance), Manufacturing, Transportation & Logistics, Healthcare), Application and Region - Global Forecast to 2028

Report Code: TC 8625 Apr, 2023, by marketsandmarkets.com

[163 Pages Report] The digital twin in finance market size is projected to grow from USD 0.1 billion in 2023 to USD 0.5 billion by 2028, at a CAGR of 34.8% during the forecast period. The primary factor driving the growth of digital twin in finance market is the growing need to meet compliance requirements in financial institutions. Digital twin platforms help financial institutions in meeting their regulatory requirements, engaging with customers, and optimizing business operations.
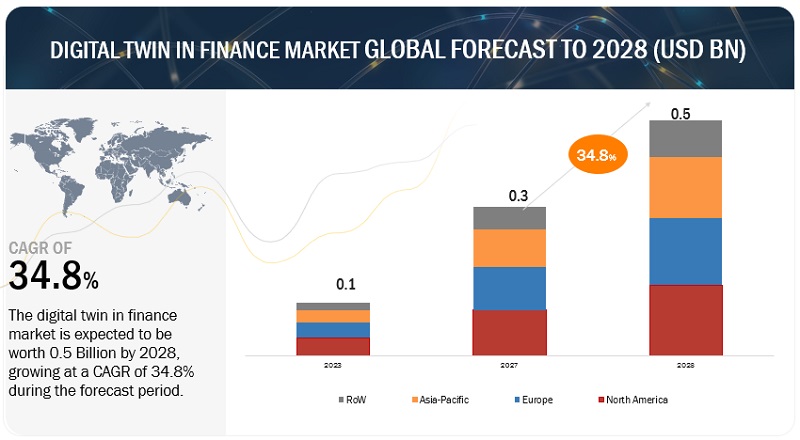
Digital Twin in Finance Market

To know about the assumptions considered for the study, Request for Free Sample Report
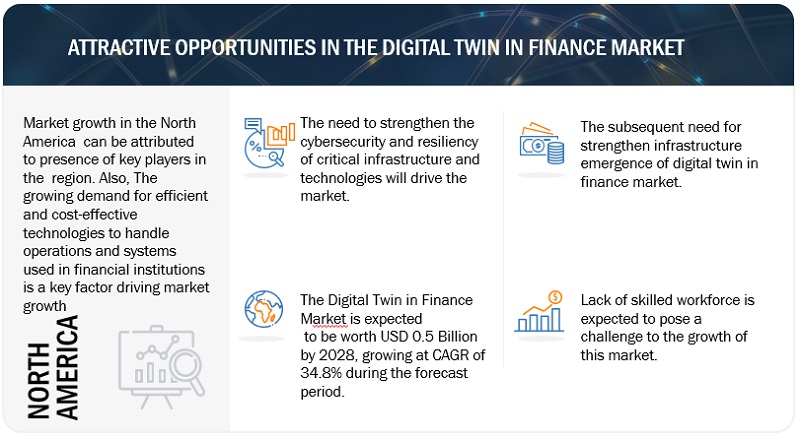
Digital Twin in Finance Market

To know about the assumptions considered for the study, download the pdf brochure

Digital Twin in Finance Market Dynamics

Driver:  Growing adoption of industry 4.0

In the banking sector, Industry 4.0 technologies have unlocked new dimensions. With Industry 4.0, new banking services and opportunities can be launched to improve business performance and end customer experiences. In the finance sector, digital twins can be used to simulate financial scenarios and analyze the impact of different market conditions on financial performance. For example, a digital twin of a portfolio on investments can be used to test different investment strategies and assess the potential risks and rewards.

Restraint: High cost of digital twin deployment

The high investments required for the deployment of digital twin solutions act as a restraint for the growth of the market. The high installation costs of information and enabling technology systems are due to the requirement for consultation, acquisition, and implementation of these systems and services. The implementation of digital twins requires the adoption of advanced smart sensors, IoT, IIoT devices, and several software solutions. The communication between these technologies can be done with the help of more advanced and latest functions such as voice recognition, gesture recognition, or multitouch responsive screens. These technologies are still quite expensive and may lead to an additional financial burden on companies operating in price-sensitive economies.

Opportunity: Growing demand for open banking

The increasing use of open banking systems globally provides opportunities for innovation and implementation of digital twin technologies. Open banking provides open access to third-party financial service providers for consumer banking, transactions, and other financial data from banks and non-bank financial institutions. To add more security layers and minimize risks related to open banking, the need for digital twins has increased in this sector. Digital twins ensure the elimination of unauthorized access such as fake cards or any other object that can be duplicated. Using a virtual environment will also help to develop quick incident response plans.

Challenge:  Growing threat of cyberattacks

The implementation of digital technologies, such as the cloud, big data, IoT, and artificial intelligence, has increased in various industries and businesses. Digital twins integrate various IoT sensors and other digital technologies in order to create a virtual copy of the physical twin. However, increasing occurrences of viruses and cyberattacks have raised concerns regarding data security. Digital twins gather sensitive data related to banking customers. With the growing number of cyberattacks on critical infrastructure over the past decade, cybersecurity has become a major concern among financial institutions. Thus, the increasing threat pertaining to data security is expected to be a major challenge for the growth of the digital twin in finance market.

Digital Twin in Finance Market Ecosystem

Prominent companies in this market include well-established, financially stable provider of digital twin solutions and services. These companies have been operating in the market for several years and possess a diversified product portfolio, state-of-the-art technologies, and strong global sales and marketing networks. Prominent companies in this market include IBM (US), Microsoft (US), Capgemini (France), SAP (Germany), and Ansys (US).
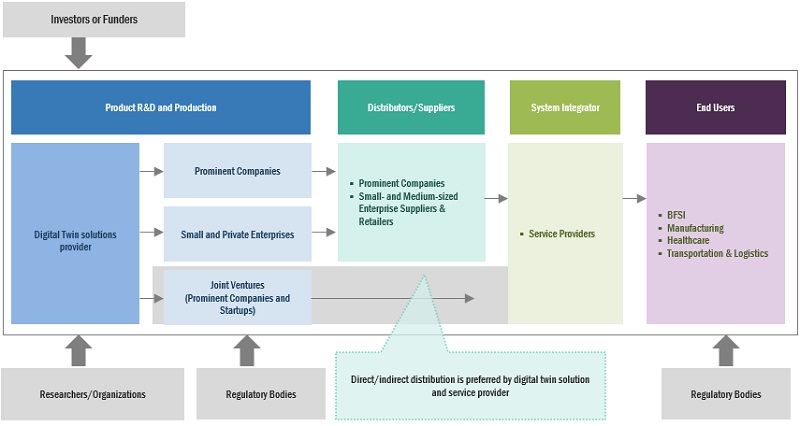
Digital Twin in Finance Market Size, and Share

By BFSI, the insurance segment to hold the largest market size during the forecast period

With the advent of new technologies such as AI, IoT, and ML, modern insurance companies are seeking to adopt new technological solutions to visualize and conceptualize the data obtained from physical assets and apply digital twin tools to analyze more favorable outcomes. Digital twins can benefit insurers by estimating the risk involved in specific situations before giving insurance policies to customers. These solutions also help insurance companies calculate dynamic premiums based on risk factors. Insurance companies are adopting digital twin technologies at a rapid pace so as to enhance their abilities to assess and manage risks

Based on  offering segment, the platforms & solutions segment to hold the largest market size during the forecast period

The rising adoption of Industry 4.0 technologies and the need for digital transformation in several industries have increased the demand for digital twin platforms in various verticals. With the integration of IoT, artificial intelligence, and other advanced technologies, companies can create virtual replicas of their physical assets and processes, providing insights into the performance and behavior of these assets. In the finance sector, digital twin platforms & solutions are becoming increasingly important as financial institutions seek to leverage digital technologies to improve efficiency, reduce costs, and provide better services to customers.

Based on end-use industries segment, the healthcare segment is expected to grow with the highest CAGR during the forecast period

The use of digital twins in the healthcare industry will reduce the complexities and costs associated with handling and operating medical devices, such as MRI and X-ray instruments as well as CT scanners. Digital twins have the capability to simulate and enhance clinical workflows, which includes the movement of patients in and out of hospitals or outpatient clinics. This technology can pinpoint areas of congestion and inefficiency in the process, allowing healthcare institutions to minimize waiting times and enhance patient contentment, while simultaneously reducing expenses.

Based on region North America is expected to hold the largest market size during the forecast period.

North America, being an early adopter of digital twin solutions, is a major revenue-generating region in the global digital twin in finance market. Increasing adoption of cloud-based solutions in financial institutions is responsible for the growing demand for digital twins in the finance market in this region. The increasing number of internet subscribers, expanding mobile data traffic, and growing government emphasis on the enhancement of digital infrastructures to meet the demand for seamless connectivity are expected drive growth in the overall digital twin in finance market.
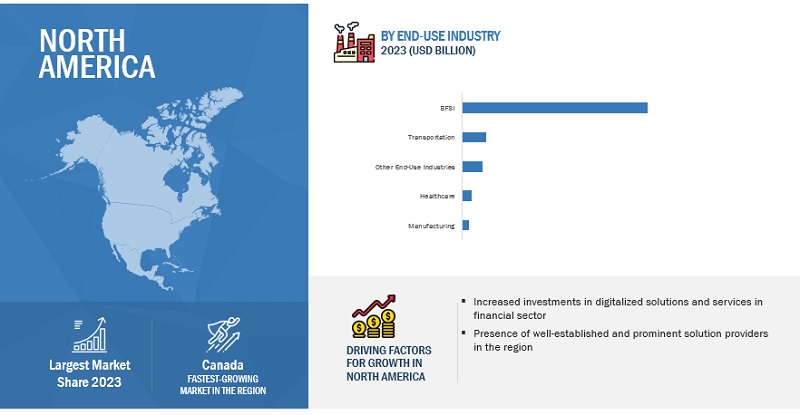
Digital Twin in Finance Market Size, and Share

Market Players:

The major players in the digital twin in finance market are IBM (US), Microsoft (US), Capgemini (France), SAP (Germany), Ansys (US), Altair (US), NVIDIA (US), NTT Data (Japan), Oracle (US), Deloitte (UK), Verisk (US), Cosmo Tech (France), NayaOne (UK), VSOptima (US), Merlynn (US), Piprate (Ireland), and TADA (US). These players have adopted various growth strategies, such as partnerships, agreements and collaborations, new product launches and product enhancements, and acquisitions to expand their footprint in the digital twin in finance market.

Get online access to the report on the World's First Market Intelligence Cloud

  • Easy to Download Historical Data & Forecast Numbers
  • Company Analysis Dashboard for high growth potential opportunities
  • Research Analyst Access for customization & queries
  • Competitor Analysis with Interactive dashboard
  • Latest News, Updates & Trend analysis
Request Sample

Scope of the Report

Report Metrics

Details

Market size available for years

2023-2028

Forecast period

2023–2028

Forecast units

Value (USD) Million/Billion

Segments covered

Offering, Applications, and End-Use Industry

Region covered

North America, Europe, Asia Pacific, Rest of the World

Companies covered

IBM (US), Microsoft (US), Capgemini (France), SAP (Germany), Ansys (US), Altair (US), NVIDIA (US), NTT Data (Japan), Oracle (US), Deloitte (UK), Verisk (US), Cosmo Tech (France), NayaOne (UK), VSOptima (US), Merlynn (US), Piprate (Ireland), and TADA (US).

This research report categorizes the digital twin in finance market to forecast revenues and analyze trends in each of the following submarkets:

Based on Offering:
  • Platforms & Solutions
  • Services
    • Professional Services
    • Managed Services
Based on Application:
  • Risk Assessment & Compliance
  • Process Optimization
  • Insurance Claims Management
  • Testing & Simulation
  • Other Applications
Based on End-Use Industry:
  • BFSI
    • Banking
    • Financial Services
    • Insurance
  • Manufacturing
  • Transportation & Logistics
  • Healthcare
  • Other End-Use Industries
By Region:
  • North America
    • United States (US)
    • Canada
  • Europe
    • United Kingdom (UK)
    • Germany
    • Rest of Europe
  • Asia Pacific
    • China
    • Singapore
    • Rest of Asia Pacific
  • Rest of the World

Recent Developments

  • In April 2023, IBM and Cosmo Tech announced their integration. The Cosmo Tech platform connects to asset information from the IBM Maximo Application Suite. Through this integration, asset managers can simulate the complete physical and financial life cycle of their asset network, even under conditions that have never occurred before.
  • In  July 2022, Microsoft and Cosmo Tech collaborated to merge their digital twin platforms to deliver practical insights for organizations to achieve net-zero carbon emissions. This partnership brings together Microsoft Azure Digital Twins and the 360° Simulation Digital Twin platform from Cosmo Tech. By integrating these platforms, the enterprise customers of Microsoft Azure can track emissions from their systems almost instantly and model future outcomes of various sustainability initiatives.
  • In September 2022, Altair announced the completion of the acquisition of RapidMiner.
  • In September 2022, NVIDIA and Deloitte announced an expansion of their cooperation to make it easier for businesses all over the world to develop, integrate, and deploy hybrid-cloud solutions.
  • In February 2022, Ansys upgraded the ANSYS Twin Builder 2022 R1. By merging physical and virtual sensors, ANSYS Twin Builder 2022 R1 provides predictive analytics with unrivaled accuracy. New features enable faster deployment of users’ digital twins, easier workflows, and web applications for online interaction with the user model.

Frequently Asked Questions (FAQ):

To speak to our analyst for a discussion on the above findings, click Speak to Analyst

TABLE OF CONTENTS
 
1 INTRODUCTION (Page No. - 19)
    1.1 STUDY OBJECTIVES 
    1.2 MARKET DEFINITION 
           1.2.1 INCLUSIONS & EXCLUSIONS
    1.3 MARKET SCOPE 
           1.3.1 MARKET SEGMENTATION
           1.3.2 REGIONS COVERED
           1.3.3 YEARS CONSIDERED
    1.4 CURRENCY CONSIDERED 
    1.5 STAKEHOLDERS 
    1.6 RECESSION IMPACT 
 
2 RESEARCH METHODOLOGY (Page No. - 23)
    2.1 RESEARCH DATA 
           FIGURE 1 GLOBAL DIGITAL TWIN IN FINANCE MARKET: RESEARCH DESIGN
           2.1.1 SECONDARY DATA
                    2.1.1.1 Secondary sources
           2.1.2 PRIMARY DATA
                    2.1.2.1 Primary interviews with experts
                    2.1.2.2 List of key primary interview participants
                    2.1.2.3 Breakup of primary interviews
                               FIGURE 2 BREAKUP OF PRIMARY INTERVIEWS: BY COMPANY, DESIGNATION, AND REGION
                    2.1.2.4 Key industry insights
    2.2 DATA TRIANGULATION 
    2.3 MARKET SIZE ESTIMATION 
           FIGURE 3 MARKET SIZE ESTIMATION METHODOLOGY – APPROACH 1 (SUPPLY SIDE): REVENUE OF PLATFORMS/SOLUTIONS AND SERVICES
           2.3.1 BOTTOM-UP APPROACH
                    FIGURE 4 BOTTOM-UP APPROACH
                    FIGURE 5 MARKET SIZE ESTIMATION METHODOLOGY – APPROACH 2: TOP-DOWN APPROACH (DEMAND SIDE)
           2.3.2 TOP-DOWN APPROACH
                    FIGURE 6 TOP-DOWN APPROACH
    2.4 MARKET FORECAST 
           TABLE 1 FACTOR ANALYSIS
    2.5 STUDY ASSUMPTIONS 
    2.6 STUDY LIMITATIONS 
 
3 EXECUTIVE SUMMARY (Page No. - 31)
    FIGURE 7 DIGITAL TWIN IN FINANCE MARKET, 2023–2028 (USD MILLION) 
    FIGURE 8 MARKET, BY OFFERING, 2023 VS. 2028 (USD MILLION) 
    FIGURE 9 MARKET, BY END-USE INDUSTRY, 2023 VS. 2028 (USD MILLION) 
    FIGURE 10 MARKET, BY REGION, 2023 VS. 2028 (USD MILLION) 
 
4 PREMIUM INSIGHTS (Page No. - 34)
    4.1 DIGITAL TWIN IN FINANCE MARKET OVERVIEW 
           FIGURE 11 INCREASING USE OF DIGITALIZED PLATFORMS TO DRIVE MARKET GROWTH
    4.2 NORTH AMERICA: MARKET, BY OFFERING AND END-USE INDUSTRY (2023) 
           FIGURE 12 BFSI SEGMENT TO ACCOUNT FOR LARGEST MARKET SHARE IN 2023
    4.3 ASIA PACIFIC: MARKET, BY OFFERING AND END-USE INDUSTRY (2023) 
           FIGURE 13 PLATFORMS & SOLUTIONS TO DOMINATE MARKET IN ASIA PACIFIC IN 2023
    4.4 EUROPE: MARKET, BY OFFERING AND END-USE INDUSTRY (2023) 
           FIGURE 14 BFSI SEGMENT TO HOLD LARGEST MARKET SHARE IN 2023
    4.5 GEOGRAPHICAL SNAPSHOT OF MARKET 
           FIGURE 15 ASIA PACIFIC TO REGISTER HIGHEST GROWTH RATE DURING FORECAST PERIOD
 
5 MARKET OVERVIEW AND INDUSTRY TRENDS (Page No. - 37)
    5.1 MARKET OVERVIEW 
    5.2 MARKET DYNAMICS 
           FIGURE 16 DIGITAL TWIN IN FINANCE MARKET: DRIVERS, RESTRAINTS, OPPORTUNITIES, AND CHALLENGES
           5.2.1 DRIVERS
                    5.2.1.1 Growing adoption of Industry 4.0
                    5.2.1.2 Growing need to test new market scenarios in real-time to reduce risks
                    5.2.1.3 Increasing demand for secure infrastructure
                    5.2.1.4 Growing need to meet compliance requirements
           5.2.2 RESTRAINTS
                    5.2.2.1 High cost of digital twin deployment
           5.2.3 OPPORTUNITIES
                    5.2.3.1 Increasing adoption of real-time data analytical tools
                    5.2.3.2 Growing demand for open banking
                    5.2.3.3 Rising emphasis on financial crime risk alert management
           5.2.4 CHALLENGES
                    5.2.4.1 Lack of skilled workforce
                    5.2.4.2 Growing threat of cyberattacks
    5.3 EVOLUTION OF DIGITAL TWIN TECHNOLOGY 
    5.4 ECOSYSTEM ANALYSIS 
           5.4.1 RESEARCH & DEVELOPMENT
           5.4.2 PLANNING & DESIGN
           5.4.3 DIGITAL TWIN ENABLERS
           5.4.4 SOLUTION/PLATFORM/SERVICE PROVIDERS
           5.4.5 END USERS
                    TABLE 2 DIGITAL TWIN IN FINANCE MARKET: ECOSYSTEM
    5.5 VALUE CHAIN ANALYSIS 
           FIGURE 17 MARKET: VALUE CHAIN ANALYSIS
    5.6 PRICING ANALYSIS 
           5.6.1 AVERAGE SELLING PRICE OF KEY PLAYERS, BY OFFERING
                    TABLE 3 PRICING MODELS AND INDICATIVE PRICE POINTS, 2022–2023
           5.6.2 AVERAGE SELLING PRICE TREND
    5.7 TECHNOLOGY ANALYSIS 
           5.7.1 RELATED TECHNOLOGIES
                    5.7.1.1 Artificial intelligence and machine learning
                    5.7.1.2 Big data and analytics
                    5.7.1.3 IoT & IIoT
                    5.7.1.4 Augmented reality and virtual reality
                    5.7.1.5 Blockchain
                    5.7.1.6 5G
           5.7.2 IMPACT OF DIGITAL TWINS ON ADJACENT TECHNOLOGIES
    5.8 INDUSTRY USE CASES 
           5.8.1 USE CASE 1: INSURANCE COMPANIES ARE ADOPTING DIGITAL TWINS TO MANAGE RISK
           5.8.2 USE CASE 2: COMPANIES ADOPT DIGITAL TWINS TO ADDRESS LEGAL AND COMPLIANCE RISKS IN FINANCIAL DATA
    5.9 PATENT ANALYSIS 
           5.9.1 DOCUMENT TYPES
                    TABLE 4 PATENTS FILED, 2020–2023
           5.9.2 INNOVATION AND PATENT APPLICATIONS
                    FIGURE 18 TOTAL NUMBER OF PATENTS GRANTED IN A YEAR, 2020–2023
                    FIGURE 19 TOP 10 COMPANIES WITH HIGHEST NUMBER OF PATENT APPLICATIONS
                    TABLE 5 TOP TEN PATENT OWNERS IN DIGITAL TWIN IN FINANCE MARKET, 2020–2023
                    TABLE 6 LIST OF PATENTS IN MARKET, 2020–2022
    5.10 TRENDS/DISRUPTIONS IMPACTING BUYERS/CLIENTS 
           FIGURE 20 TRENDS/DISRUPTIONS IMPACTING BUYERS/CLIENTS IN MARKET
    5.11 PORTER’S FIVE FORCES ANALYSIS 
                    TABLE 7 DIGITAL TWIN IN FINANCE MARKET: PORTER’S FIVE FORCES MODEL
           5.11.1 THREAT FROM NEW ENTRANTS
           5.11.2 THREAT FROM SUBSTITUTES
           5.11.3 BARGAINING POWER OF BUYERS
           5.11.4 BARGAINING POWER OF SUPPLIERS
           5.11.5 DEGREE OF COMPETITION
    5.12 REGULATORY LANDSCAPE 
                    TABLE 8 NORTH AMERICA: REGULATORY BODIES, GOVERNMENT AGENCIES, AND OTHER ORGANIZATIONS
                    TABLE 9 EUROPE: REGULATORY BODIES, GOVERNMENT AGENCIES, AND OTHER ORGANIZATIONS
                    TABLE 10 ASIA PACIFIC: REGULATORY BODIES, GOVERNMENT AGENCIES, AND OTHER ORGANIZATIONS
                    TABLE 11 MIDDLE EAST & AFRICA: REGULATORY BODIES, GOVERNMENT AGENCIES, AND OTHER ORGANIZATIONS
                    TABLE 12 LATIN AMERICA: REGULATORY BODIES, GOVERNMENT AGENCIES, AND OTHER ORGANIZATIONS
           5.12.1 ISO/TC 184/SC 4
           5.12.2 ISO/TC 184
           5.12.3 GENERAL PERSONAL DATA PROTECTION LAW (GPDP)
           5.12.4 AUSTRALIAN DIGITAL CURRENCY COMMERCE ASSOCIATION (ADCCA)
           5.12.5 DIGITAL SIGNATURE ACT
           5.12.6 GDPR
           5.12.7 FINANCIAL SERVICES MODERNIZATION ACT
           5.12.8 SOX ACT
           5.12.9 PAYMENT CARD INDUSTRY-DATA SECURITY STANDARD
                    5.12.10 HEALTH INSURANCE PORTABILITY AND ACCOUNTABILITY ACT
                    5.12.11 FEDERAL INFORMATION SECURITY MANAGEMENT ACT
    5.13 KEY STAKEHOLDERS AND BUYING CRITERIA 
           5.13.1 KEY STAKEHOLDERS IN BUYING PROCESS
                    FIGURE 21 INFLUENCE OF STAKEHOLDERS ON BUYING PROCESS
                    TABLE 13 INFLUENCE OF STAKEHOLDERS ON BUYING PROCESS
           5.13.2 BUYING CRITERIA
                    FIGURE 22 KEY BUYING CRITERIA
                    TABLE 14 KEY BUYING CRITERIA
    5.14 KEY CONFERENCES AND EVENTS, 2023–2024 
                    TABLE 15 DIGITAL TWIN IN FINANCE MARKET: DETAILED LIST OF CONFERENCES AND EVENTS
    5.15 BEST PRACTICES IN MARKET 
    5.16 FUTURE OUTLOOK OF MARKET 
           5.16.1 DIGITAL TWIN TECHNOLOGY ROADMAP TILL 2030
                    5.16.1.1 Short-term roadmap (2023–2025)
                    5.16.1.2 Mid-term roadmap (2026–2028)
                    5.16.1.3 Long-term roadmap (2029–2030)
 
6 DIGITAL TWIN IN FINANCE MARKET, BY OFFERING (Page No. - 63)
    6.1 INTRODUCTION 
           6.1.1 MARKET, BY OFFERING: MARKET DRIVERS
                    FIGURE 23 SERVICES SEGMENT TO GROW AT HIGHEST CAGR DURING FORECAST PERIOD
                    TABLE 16 MARKET, BY OFFERING, 2023–2028 (USD MILLION)
    6.2 PLATFORMS & SOLUTIONS 
           6.2.1 BENEFITS SUCH AS REAL-TIME MONITORING AND PREDICTIVE MAINTENANCE TO DRIVE DEMAND FOR DIGITAL TWIN PLATFORMS & SOLUTIONS
    6.3 SERVICES 
           TABLE 17 MARKET, BY TYPE, 2023–2028 (USD MILLION)
           6.3.1 PROFESSIONAL SERVICES
                    6.3.1.1 Growing need for ongoing technical support to boost demand for professional services
                               TABLE 18 PROFESSIONAL SERVICES: MARKET, BY REGION, 2023–2028 (USD MILLION)
           6.3.2 MANAGED SERVICES
                    6.3.2.1 Ability of managed services to improve client experiences to drive growth
                               TABLE 19 MANAGED SERVICES: MARKET, BY REGION, 2023–2028 (USD MILLION)
 
7 DIGITAL TWIN IN FINANCE MARKET, BY APPLICATION (Page No. - 67)
    7.1 INTRODUCTION 
           7.1.1 MARKET, BY APPLICATION: MARKET DRIVERS
    7.2 RISK ASSESSMENT & COMPLIANCE 
           7.2.1 GROWING NEED FOR REAL-TIME ASSET MONITORING FOR RISK ESTIMATION TO DRIVE MARKET GROWTH
    7.3 PROCESS OPTIMIZATION 
           7.3.1 ABILITY OF DIGITAL TWINS TO CHECK AND REDUCE BOTTLENECKS TO BOOST ADOPTION
    7.4 INSURANCE CLAIMS MANAGEMENT 
           7.4.1 GROWING USE OF DIGITAL TWINS TO PREVENT DELAYS IN CLAIMS MANAGEMENT PROCESSES TO FAVOR GROWTH
    7.5 TESTING & SIMULATION 
           7.5.1 NEED FOR DIGITAL TWINS TO TEST AND ANALYZE SYSTEM BEHAVIOR IN COMPLEX SITUATIONS TO BOOST MARKET
    7.6 OTHER APPLICATIONS 
 
8 DIGITAL TWIN IN FINANCE MARKET, BY END-USE INDUSTRY (Page No. - 70)
    8.1 INTRODUCTION 
           8.1.1 MARKET, BY END-USE INDUSTRY: MARKET DRIVERS
                    FIGURE 24 HEALTHCARE INDUSTRY TO GROW AT HIGHEST CAGR DURING FORECAST PERIOD
                    TABLE 20 MARKET, BY END-USE INDUSTRY, 2023–2028 (USD MILLION)
    8.2 BFSI 
           FIGURE 25 FINANCIAL SERVICES SEGMENT TO GROW AT HIGHEST CAGR DURING FORECAST PERIOD
           TABLE 21 BFSI: MARKET, BY TYPE, 2023–2028 (USD MILLION)
           TABLE 22 BFSI: MARKET, BY REGION, 2023–2028 (USD MILLION)
           8.2.1 BANKING
                    8.2.1.1 Growing need to improve customer experiences to drive use of digital twins in banking sector
                               TABLE 23 BANKING: MARKET, BY REGION, 2023–2028 (USD MILLION)
                               8.2.1.1.1 Use cases
                                             8.2.1.1.1.1 To check and enhance performance of ATMs in real-time
                                             8.2.1.1.1.2 To manage and monitor customer buying preferences in banks
           8.2.2 FINANCIAL SERVICES
                    8.2.2.1 Need for virtual assistants to solve consumer problems through simulated interactions to drive demand for digital twins
                               TABLE 24 FINANCIAL SERVICES: DIGITAL TWIN IN FINANCE MARKET, BY REGION, 2023–2028 (USD MILLION)
                               8.2.2.1.1 Use cases
                                             8.2.2.1.1.1 To check performance of portfolio in various conditions before investing
           8.2.3 INSURANCE
                    8.2.3.1 Growing need for risk assessment in insurance sector to boost demand for digital twins
                               TABLE 25 INSURANCE: MARKET, BY REGION, 2023–2028 (USD MILLION)
                               8.2.3.1.1 Use cases
                                             8.2.3.1.1.1 To estimate and settle claims quickly
                                             8.2.3.1.1.2 To detect fraudulent claims
                                             8.2.3.1.1.3 To address legal and compliance risks
    8.3 MANUFACTURING 
           8.3.1 NEED TO CUT TIME AND COST IN MANUFACTURING SECTOR TO DRIVE GROWTH
                    TABLE 26 MANUFACTURING: DIGITAL TWIN IN FINANCE MARKET, BY REGION, 2023–2028 (USD MILLION)
                    8.3.1.1 Use cases
                               8.3.1.1.1 To reduce costs involved in manufacturing operations
                               8.3.1.1.2 To improve cost savings and product quality
    8.4 HEALTHCARE 
           8.4.1 GROWING TREND OF DIGITALIZATION IN HEALTHCARE TO BOOST ADOPTION OF DIGITAL TWINS
                    TABLE 27 HEALTHCARE: MARKET, BY REGION, 2023–2028 (USD MILLION)
                    8.4.1.1 Use cases
                               8.4.1.1.1 To reduce costs and improve efficiency with Oracle Health Insurance
                               8.4.1.1.2 To simulate and enhance clinical workflows
    8.5 TRANSPORTATION & LOGISTICS 
           8.5.1 NEED FOR TRANSPORTATION COMPANIES TO IMPROVE PERFORMANCE OF ASSETS AND PROCESSES TO FUEL MARKET GROWTH
                    TABLE 28 TRANSPORTATION & LOGISTICS: DIGITAL TWIN IN FINANCE MARKET, BY REGION, 2023–2028 (USD MILLION)
                    8.5.1.1 Use cases
                               8.5.1.1.1 To make calculative investment decisions for Cross River Rail project
                               8.5.1.1.2 To prevent costly downtime and repairs
    8.6 OTHER END-USE INDUSTRIES 
           TABLE 29 OTHER END-USE INDUSTRIES: DIGITAL TWIN IN FINANCE MARKET, BY REGION, 2023–2028 (USD MILLION)
           8.6.1 USE CASES
                    8.6.1.1 To improve energy operations and help companies enhance revenue models
                    8.6.1.2 To better understand risk
 
9 DIGITAL TWIN IN FINANCE MARKET, BY REGION (Page No. - 81)
    9.1 INTRODUCTION 
           FIGURE 26 DIGITAL TWIN IN FINANCE MARKET: REGIONAL SNAPSHOT (2023)
           FIGURE 27 ASIA PACIFIC TO GROW AT HIGHEST CAGR DURING FORECAST PERIOD
           TABLE 30 DIGITAL TWIN IN FINANCE MARKET, BY REGION, 2023–2028 (USD MILLION)
    9.2 NORTH AMERICA 
           FIGURE 28 NORTH AMERICA: MARKET SNAPSHOT
           9.2.1 NORTH AMERICA: DIGITAL TWIN IN FINANCE MARKET DRIVERS
           9.2.2 NORTH AMERICA: RECESSION IMPACT
                    TABLE 31 NORTH AMERICA: DIGITAL TWIN IN FINANCE MARKET, BY OFFERING, 2023–2028 (USD MILLION)
                    TABLE 32 NORTH AMERICA: DIGITAL TWIN IN FINANCE SERVICES MARKET, BY TYPE, 2023–2028 (USD MILLION)
                    TABLE 33 NORTH AMERICA: DIGITAL TWIN IN FINANCE MARKET, BY END-USE INDUSTRY, 2023–2028 (USD MILLION)
                    TABLE 34 NORTH AMERICA: DIGITAL TWIN IN FINANCE MARKET FOR BFSI SECTOR, BY TYPE, 2023–2028 (USD MILLION)
           9.2.3 US
                    9.2.3.1 Rapid adoption of technology in financial sector to drive market growth
           9.2.4 CANADA
                    9.2.4.1 Increasing cyberattacks to drive demand for digital twins
    9.3 EUROPE 
           FIGURE 29 EUROPE: MARKET SNAPSHOT
           9.3.1 EUROPE: DIGITAL TWIN IN FINANCE MARKET DRIVERS
           9.3.2 EUROPE: RECESSION IMPACT
                    TABLE 35 EUROPE: DIGITAL TWIN IN FINANCE MARKET, BY OFFERING, 2023–2028 (USD MILLION)
                    TABLE 36 EUROPE: DIGITAL TWIN IN FINANCE SERVICES MARKET, BY TYPE, 2023–2028 (USD MILLION)
                    TABLE 37 EUROPE: DIGITAL TWIN IN FINANCE MARKET, BY END-USE INDUSTRY, 2023–2028 (USD MILLION)
                    TABLE 38 EUROPE: DIGITAL TWIN IN FINANCE MARKET FOR BFSI SECTOR, BY TYPE, 2023–2028 (USD MILLION)
           9.3.3 UK
                    9.3.3.1 Need to improve efficiency of digital infrastructure to boost market growth
           9.3.4 GERMANY
                    9.3.4.1 Significant adoption of IoT technologies and analytics in financial sector to propel market
           9.3.5 REST OF EUROPE
    9.4 ASIA PACIFIC 
           FIGURE 30 ASIA PACIFIC: MARKET SNAPSHOT
           9.4.1 ASIA PACIFIC: DIGITAL TWIN IN FINANCE MARKET DRIVERS
           9.4.2 RECESSION IMPACT: ASIA PACIFIC
                    TABLE 39 ASIA PACIFIC: DIGITAL TWIN IN FINANCE MARKET, BY OFFERING, 2023–2028 (USD MILLION)
                    TABLE 40 ASIA PACIFIC: DIGITAL TWIN IN FINANCE SERVICES MARKET, BY TYPE, 2023–2028 (USD MILLION)
                    TABLE 41 ASIA PACIFIC: DIGITAL TWIN IN FINANCE MARKET, BY END-USE INDUSTRY, 2023–2028 (USD MILLION)
                    TABLE 42 ASIA PACIFIC: DIGITAL TWIN IN FINANCE MARKET FOR BFSI SECTOR, BY TYPE, 2023–2028 (USD MILLION)
           9.4.3 CHINA
                    9.4.3.1 Increasing government investments to enhance security of digital platforms to contribute to growth
           9.4.4 SINGAPORE
                    9.4.4.1 Rapid adoption of innovative digital technologies across banking sector to fuel growth
           9.4.5 REST OF ASIA PACIFIC
    9.5 REST OF THE WORLD 
           9.5.1 REST OF THE WORLD: DIGITAL TWIN IN FINANCE MARKET DRIVERS
           9.5.2 RECESSION IMPACT: REST OF THE WORLD
                    TABLE 43 REST OF THE WORLD: DIGITAL TWIN IN FINANCE MARKET, BY OFFERING, 2023–2028 (USD MILLION)
                    TABLE 44 REST OF THE WORLD: DIGITAL TWIN IN FINANCE SERVICES MARKET, BY TYPE, 2023–2028 (USD MILLION)
                    TABLE 45 REST OF THE WORLD: DIGITAL TWIN IN FINANCE MARKET, BY END-USE INDUSTRY, 2023–2028 (USD MILLION)
                    TABLE 46 REST ON THE WORLD: DIGITAL TWIN IN FINANCE MARKET FOR BFSI SECTOR, BY TYPE, 2023–2028 (USD MILLION)
 
10 COMPETITIVE LANDSCAPE (Page No. - 98)
     10.1 OVERVIEW 
     10.2 STRATEGIES ADOPTED BY KEY PLAYERS 
               TABLE 47 OVERVIEW OF STRATEGIES ADOPTED BY KEY PLAYERS IN DIGITAL TWIN IN FINANCE MARKET
     10.3 COMPETITIVE SCENARIO 
     10.4 MARKET SHARE ANALYSIS OF TOP PLAYERS 
               TABLE 48 DIGITAL TWIN IN FINANCE MARKET: DEGREE OF COMPETITION
     10.5 COMPETITIVE BENCHMARKING 
               TABLE 49 PRODUCT FOOTPRINT WEIGHTAGE
               TABLE 50 DIGITAL TWIN IN FINANCE MARKET: COMPETITIVE BENCHMARKING OF PLAYERS, BY OFFERING, END-USE INDUSTRY, AND REGION
               TABLE 51 DIGITAL TWIN IN FINANCE MARKET: DETAILED LIST OF KEY START-UPS/SMES
     10.6 MARKET RANKING OF KEY PLAYERS IN DIGITAL TWIN IN FINANCE MARKET, 2023 
               FIGURE 31 MARKET RANKING OF KEY PLAYERS, 2023
     10.7 COMPANY EVALUATION QUADRANT 
               FIGURE 32 COMPANY EVALUATION MATRIX: CRITERIA WEIGHTAGE
             10.7.1 STARS
             10.7.2 EMERGING LEADERS
             10.7.3 PERVASIVE PLAYERS
             10.7.4 PARTICIPANTS
                       FIGURE 33 DIGITAL TWIN IN FINANCE MARKET: COMPANY EVALUATION MATRIX, 2023
     10.8 START-UP/SME EVALUATION MATRIX METHODOLOGY AND DEFINITIONS 
               FIGURE 34 START-UP/SME EVALUATION MATRIX: CRITERIA WEIGHTAGE
             10.8.1 PROGRESSIVE COMPANIES
             10.8.2 RESPONSIVE COMPANIES
             10.8.3 DYNAMIC COMPANIES
             10.8.4 STARTING BLOCKS
                       FIGURE 35 DIGITAL TWIN IN FINANCE MARKET: START-UP/SME EVALUATION MATRIX, 2023
     10.9 COMPETITIVE SCENARIO 
             10.9.1 PRODUCT LAUNCHES
                       TABLE 52 PRODUCT LAUNCHES, JANUARY 2019–MARCH 2023
             10.9.2 DEALS
                       TABLE 53 DEALS, JANUARY 2019–MARCH 2023
 
11 COMPANY PROFILES (Page No. - 109)
     11.1 MAJOR PLAYERS 
(Business Overview, Products/Solutions/Services offered, Recent Developments, MnM View)*
             11.1.1 IBM
                       TABLE 54 IBM: BUSINESS OVERVIEW
                       FIGURE 36 IBM: COMPANY SNAPSHOT
                       TABLE 55 IBM: PRODUCTS/SOLUTIONS/SERVICES OFFERED
                       TABLE 56 IBM: DEALS
             11.1.2 MICROSOFT
                       TABLE 57 MICROSOFT: BUSINESS OVERVIEW
                       FIGURE 37 MICROSOFT: COMPANY SNAPSHOT
                       TABLE 58 MICROSOFT: PRODUCTS/SOLUTIONS/SERVICES OFFERED
                       TABLE 59 MICROSOFT: DEALS
             11.1.3 CAPGEMINI
                       TABLE 60 CAPGEMINI: BUSINESS OVERVIEW
                       FIGURE 38 CAPGEMINI: COMPANY SNAPSHOT
                       TABLE 61 CAPGEMINI: PRODUCTS/SOLUTIONS/SERVICES OFFERED
             11.1.4 SAP
                       TABLE 62 SAP: BUSINESS OVERVIEW
                       FIGURE 39 SAP: COMPANY SNAPSHOT
                       TABLE 63 SAP: PRODUCTS/SOLUTIONS/SERVICES OFFERED
             11.1.5 ANSYS
                       TABLE 64 ANSYS: BUSINESS OVERVIEW
                       FIGURE 40 ANSYS: COMPANY SNAPSHOT
                       TABLE 65 ANSYS: PRODUCTS/SOLUTIONS/SERVICES OFFERED
                       TABLE 66 ANSYS: PRODUCT LAUNCHES
                       TABLE 67 ANSYS: DEALS
             11.1.6 ORACLE CORPORATION
                       TABLE 68 ORACLE CORPORATION: BUSINESS OVERVIEW
                       FIGURE 41 ORACLE CORPORATION: COMPANY SNAPSHOT
                       TABLE 69 ORACLE CORPORATION: PRODUCTS/SOLUTIONS/SERVICES OFFERED
                       TABLE 70 ORACLE CORPORATION: DEALS
             11.1.7 ALTAIR ENGINEERING INC.
                       TABLE 71 ALTAIR ENGINEERING INC.: BUSINESS OVERVIEW
                       FIGURE 42 ALTAIR ENGINEERING INC.: COMPANY SNAPSHOT
                       TABLE 72 ALTAIR ENGINEERING INC.: PRODUCTS/SOLUTIONS/SERVICES OFFERED
                       TABLE 73 ALTAIR ENGINEERING INC.: DEALS
             11.1.8 DELOITTE
                       TABLE 74 DELOITTE: BUSINESS OVERVIEW
                       FIGURE 43 DELOITTE: COMPANY SNAPSHOT
                       TABLE 75 DELOITTE: PRODUCTS/SOLUTIONS/SERVICES OFFERED
                       TABLE 76 DELOITTE: DEALS
             11.1.9 NVIDIA CORPORATION
                       TABLE 77 NVIDIA CORPORATION: BUSINESS OVERVIEW
                       FIGURE 44 NVIDIA CORPORATION: COMPANY SNAPSHOT
                       TABLE 78 NVIDIA CORPORATION: PRODUCTS/SOLUTIONS/SERVICES OFFERED
             11.1.10 NTT DATA
             11.1.11 VERISK
*Details on Business Overview, Products/Solutions/Services offered, Recent Developments, MnM View might not be captured in case of unlisted companies.
     11.2 SMES/START-UPS 
             11.2.1 COSMO TECH
             11.2.2 NAYAONE
             11.2.3 VSOPTIMA
             11.2.4 MERLYNN INTELLIGENCE TECHNOLOGIES
             11.2.5 PIPRATE
             11.2.6 TADA
 
12 ADJACENT/RELATED MARKETS (Page No. - 145)
     12.1 RISK ANALYTICS MARKET 
             12.1.1 MARKET DEFINITION
             12.1.2 MARKET OVERVIEW
             12.1.3 RISK ANALYTICS MARKET, BY COMPONENT
                       TABLE 79 RISK ANALYTICS MARKET, BY COMPONENT, 2016–2021 (USD MILLION)
                       TABLE 80 RISK ANALYTICS MARKET, BY COMPONENT, 2022–2027 (USD MILLION)
                       12.1.3.1 Software
                       TABLE 81 RISK ANALYTICS SOFTWARE MARKET, BY REGION, 2016–2021 (USD MILLION)
                       TABLE 82 RISK ANALYTICS SOFTWARE MARKET, BY REGION, 2022–2027 (USD MILLION)
                       TABLE 83 RISK ANALYTICS SOFTWARE MARKET, BY TYPE, 2016–2021 (USD MILLION)
                       TABLE 84 RISK ANALYTICS SOFTWARE MARKET, BY TYPE, 2022–2027 (USD MILLION)
                       12.1.3.2 Services
                                   TABLE 85 RISK ANALYTICS SERVICES MARKET, BY REGION, 2016–2021 (USD MILLION)
                                   TABLE 86 RISK ANALYTICS SERVICES MARKET, BY REGION, 2022–2027 (USD MILLION)
                                   TABLE 87 RISK ANALYTICS SERVICES MARKET, BY TYPE, 2016–2021 (USD MILLION)
                                   TABLE 88 RISK ANALYTICS SERVICES MARKET, BY TYPE, 2022–2027 (USD MILLION)
     12.2 INSURANCE ANALYTICS MARKET 
             12.2.1 MARKET DEFINITION
             12.2.2 MARKET OVERVIEW
             12.2.3 INSURANCE ANALYTICS MARKET, BY COMPONENT
                       TABLE 89 INSURANCE ANALYTICS MARKET, BY COMPONENT, 2016–2019 (USD MILLION)
                       TABLE 90 INSURANCE ANALYTICS MARKET, BY COMPONENT, 2020–2026 (USD MILLION)
                       TABLE 91 INSURANCE ANALYTICS SERVICES MARKET, BY TYPE, 2016–2019 (USD MILLION)
                       TABLE 92 INSURANCE ANALYTICS SERVICES MARKET, BY TYPE, 2020–2026 (USD MILLION)
             12.2.4 INSURANCE ANALYTICS MARKET, BY APPLICATION
                       TABLE 93 INSURANCE ANALYTICS MARKET, BY APPLICATION, 2016–2019 (USD MILLION)
                       TABLE 94 INSURANCE ANALYTICS MARKET, BY APPLICATION, 2020–2026 (USD MILLION)
             12.2.5 INSURANCE ANALYTICS MARKET, BY DEPLOYMENT MODE
                       TABLE 95 INSURANCE ANALYTICS MARKET, BY DEPLOYMENT MODE, 2016–2019 (USD MILLION)
                       TABLE 96 INSURANCE ANALYTICS MARKET, BY DEPLOYMENT MODE, 2020–2026 (USD MILLION)
             12.2.6 INSURANCE ANALYTICS MARKET, BY ORGANIZATION SIZE
                       TABLE 97 INSURANCE ANALYTICS MARKET, BY ORGANIZATION SIZE, 2016–2019 (USD MILLION)
                       TABLE 98 INSURANCE ANALYTICS MARKET, BY ORGANIZATION SIZE, 2020–2026 (USD MILLION)
             12.2.7 INSURANCE ANALYTICS MARKET, BY END USER
                       TABLE 99 INSURANCE ANALYTICS MARKET, BY END USER, 2016–2019 (USD MILLION)
                       TABLE 100 INSURANCE ANALYTICS MARKET, BY END USER, 2020–2026 (USD MILLION)
             12.2.8 INSURANCE ANALYTICS MARKET, BY REGION
                       TABLE 101 INSURANCE ANALYTICS MARKET, BY REGION, 2016–2019 (USD MILLION)
                       TABLE 102 INSURANCE ANALYTICS MARKET, BY REGION, 2020–2026 (USD MILLION)
 
13 APPENDIX (Page No. - 155)
     13.1 DISCUSSION GUIDE 
     13.2 KNOWLEDGESTORE: MARKETSANDMARKETS’ SUBSCRIPTION PORTAL 
     13.3 CUSTOMIZATION OPTIONS 
     13.4 RELATED REPORTS 
     13.5 AUTHOR DETAILS 

This research study involved the use of extensive secondary sources, directories, and databases, such as D&B Hoovers and Bloomberg BusinessWeek, to identify and collect information useful for this technical, market-oriented, and commercial study of the global smart transportation market. The primary sources were mainly several industry experts from core and related industries and preferred suppliers, manufacturers, distributors, Service Providers (SPs), technology developers, alliances, and organizations related to all the segments of this industry’s value chain. In-depth interviews were conducted with various primary respondents that included key industry participants, subject-matter experts, C-level executives of key market players, and industry consultants to obtain and verify critical qualitative and quantitative information as well as assess prospects.

Secondary Research

The market for digital twin in finance solutions and services is arrived at based on the secondary data available through paid and unpaid sources and by analyzing the different solutions and services of major companies in the ecosystem and rating them based on their performance and quality. In the secondary research process, various sources were referred to in order to identify and collect information for this study. Secondary sources included annual reports, the press releases and investor presentations of companies, white papers, journals, and articles from recognized authors, directories, and databases.

Primary Research

In the primary research process, various primary sources from both the supply and demand sides were interviewed to obtain qualitative and quantitative information for this report. Primary sources from the supply side included industry experts, such as Chief Executive Officers (CEOs), Chief Technology Officers (CTOs), Chief Operating Officers (COOs), Vice Presidents (VPs), Managing Directors (MDs), technology & innovation directors, and related key executives from different key companies and organizations operating in the digital twin in finance market.

The breakup of Primary Research :
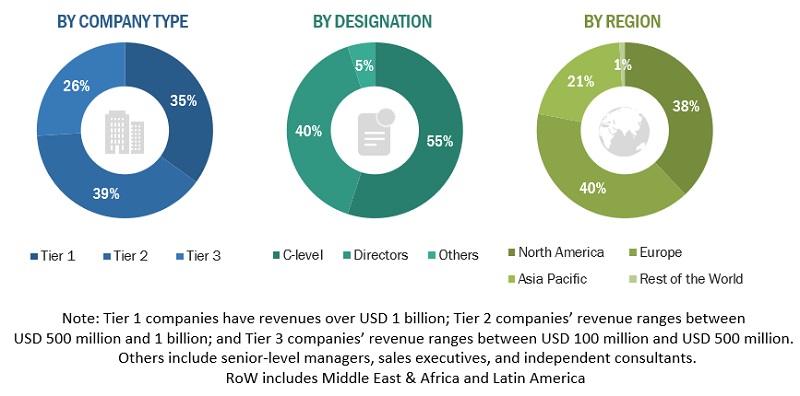
Digital Twin in Finance Market Size, and Share

Company Name

Designation

Altair

Senior Manager

Merlynn Intelligence Technologies

Director

Deloitte

Senior Consultant

To know about the assumptions considered for the study, download the pdf brochure

Market Size Estimation

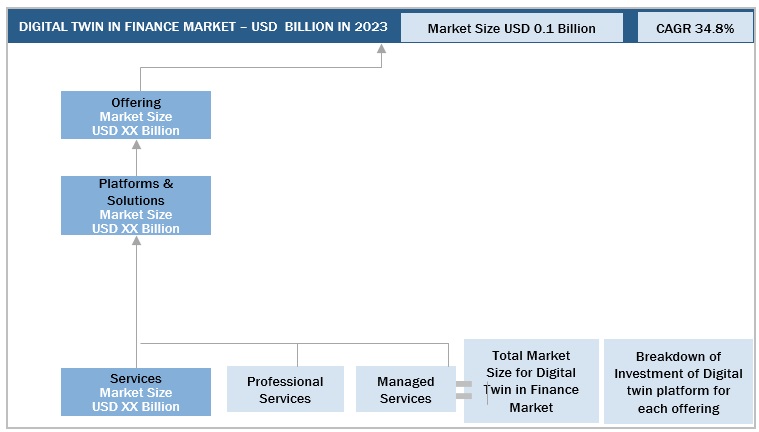
Multiple approaches were adopted to estimate and forecast the size of the digital twin in finance market. The first approach involved estimating the market size through the summation of companies’ revenues generated from digital twin in finance solutions and services.

Both top-down and bottom-up approaches were used to estimate and validate the total size of the digital twin in finance market. These methods were extensively used to estimate the size of various segments in the market. The research methodology used to estimate the market size includes the following:

  • Analyzing the size of the global digital twin market and then identifying revenues generated through this technology in the finance sector
  • Estimating the size of the digital twin in finance market
  • Estimating the market size of other digital twin technology providers

Digital Twin in Finance Market Size: Botton Up Approach
Digital Twin in Finance Market Size, and Share

Digital Twin in Finance Market Size: Top Down Approach

Digital Twin in Finance Market Size, and Share

Data Triangulation

After arriving at the overall market size, the overall digital twin in finance market was divided into several segments and subsegments. The data triangulation procedures were used to complete the overall market engineering process and arrive at the exact statistics for all segments and subsegments. The data was triangulated by studying various factors and trends from the demand and supply sides. Along with data triangulation and market breakdown, the market size was validated by the top-down and bottom-up approaches.

Market Definition

Digital twins are computerized models or virtual replicas (simulations) of physical objects such as devices, assets, products, or processes. The biggest advantage of digital twins is that they operate in real-time, taking cues from updated data. This holds immense potential for the BFSI industry, which heavily relies on data insights to make critical business decisions.  Processes can be replicated using digital twin technology in order to gather data necessary for future predictions.

Key Stakeholders

  • Senior Management
  • Finance/Procurement Department
  • R&D Department
  • IT Department

Report Objectives

  • To determine and forecast the global digital twin in finance market, by offering, end-use industry, application, and region from 2023 to 2028
  • To analyze the various macroeconomic and microeconomic factors affecting market growth
  • To forecast the size of the market segments with respect to four main regions: North America, Europe, Asia Pacific (APAC), Rest of the World (RoW) 
  • To provide detailed information about the major factors (drivers, restraints, opportunities, and challenges) influencing the growth of the finance market
  • To analyze each submarket with respect to individual growth trends, prospects, and contributions to the overall market
  • To analyze the opportunities in the market for stakeholders by identifying the high-growth segments of the digital twin in finance market
  • To profile the key market players; provide a comparative analysis on the basis of business overviews, regional presence, product offerings, business strategies, and key financials; and illustrate the competitive landscape of the market
  • To track and analyze competitive developments, such as mergers & acquisitions, product developments, partnerships & collaborations, and research & development (R&D) activities, in the market

Available Customizations

With the given market data, MarketsandMarkets offers customizations as per the company’s specific needs. The following customization options are available for the report:

Geographic Analysis

  • Further breakup of the Asia Pacific market into countries contributing 75% to the regional market size
  • Further breakup of the North American market into countries contributing 75% to the regional market size
  • Further breakup of the European market into countries contributing 75% to the regional market size

Company Information

  • Detailed analysis and profiling of additional market players (up to 5)
Custom Market Research Services

We will customize the research for you, in case the report listed above does not meet with your exact requirements. Our custom research will comprehensively cover the business information you require to help you arrive at strategic and profitable business decisions.

Request Customization

Instant Answers with GPT - Ask Now!

Ask real questions. Get complete answers !
Report Code
TC 8625
Published ON
Apr, 2023
Choose License Type
BUY NOW
  • SHARE
X
Request Customization
Speak to Analyst
Speak to Analyst
OR FACE-TO-FACE MEETING
PERSONALIZE THIS RESEARCH
  • Triangulate with your Own Data
  • Get Data as per your Format and Definition
  • Gain a Deeper Dive on a Specific Application, Geography, Customer or Competitor
  • Any level of Personalization
REQUEST A FREE CUSTOMIZATION
LET US HELP YOU!
  • What are the Known and Unknown Adjacencies Impacting the Digital Twin in Finance Market
  • What will your New Revenue Sources be?
  • Who will be your Top Customer; what will make them switch?
  • Defend your Market Share or Win Competitors
  • Get a Scorecard for Target Partners
CUSTOMIZED WORKSHOP REQUEST
+1-888-600-6441
  • Call Us
  • +1-888-600-6441 (Corporate office hours)
  • +1-888-600-6441 (US/Can toll free)
  • +44-800-368-9399 (UK office hours)
CONNECT WITH US
ABOUT TRUST ONLINE
©2024 MarketsandMarkets Research Private Ltd. All rights reserved
DMCA.com Protection Status Website Feedback