Managed Domain Name System (DNS) Market

Managed Domain Name System (DNS) Market by DNS Service, DNS Server (Primary Servers and Secondary Servers), Cloud Deployment, End User, Enterprise (BFSI, Retail & eCommerce, Media & Entertainment, Healthcare) and Region - Global Forecast to 2028

Report Code: TC 6076 Dec, 2023, by marketsandmarkets.com

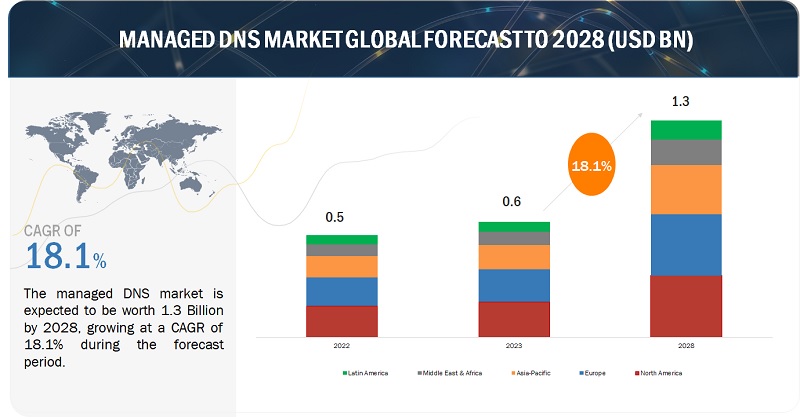
[247 Pages Report] MarketsandMarkets forecasts that the managed DNS market size is projected to grow from USD 0.6 billion in 2023 to USD 1.3 billion by 2028, at a CAGR of 18.1% during the forecast period. Improving customer experience is a priority for telecom operators. With the escalating frequency and sophistication of cyber threats, organizations have shown a heightened interest in secure and resilient DNS solutions to protect against DNS-based attacks like DDoS (Distributed Denial of Service) attacks. The increasing use of mobile devices for internet access has led to a surge in DNS queries from various locations and devices, driving the need for responsive and reliable managed DNS.
Managed Domain Name System (DNS) Market

To know about the assumptions considered for the study, Request for Free Sample Report
Managed Domain Name System (DNS) Market

To know about the assumptions considered for the study, download the pdf brochure

Managed DNS Market Dynamics

Driver:  High return on investment and enhanced customer experience

DNS plays a vital role when it comes to the reliability and performance of cloud and web applications. Enterprises require a higher CAPEX for setting up and managing DNS infrastructure, which acts as a central system to run the internet ecosystem. Owning the DNS server provides a business with more control as its network administrator can manage, configure, and secure the DNS. However, ownership of DNS servers comes with several disadvantages such as maintaining in-house IT teams, continuous updating of DNS networks, vulnerabilities, and higher CAPEX investment. As a result, enterprises prefer managed DNS which comes with benefits such as a global anycast network, a dedicated team of experts for DNS management, scalability, reliability, security, and availability. The majority of DNS providers offer cloud-based services that reduce the overall CAPEX and OPEX with faster TTM. The simple nature of DNS services with 24*7 support services significantly drives demand for managed DNS across SMEs and large enterprises. The competitive environment and global economic situation have accelerated the adoption of cost-effective measures to restructure business models. The increasing shift of enterprises toward digital transformation and accelerating customer experience is also leading to the adoption of DNS services that ultimately reduce enterprise costs. The cloud offers the pay-as-you-go model, which enables enterprises to pay as per their usage of DNS services, leading to reduced costs. Consumer behavior and demands have been evolving tremendously in recent years. The rising customer expectations and growing competition among the leading market players are increasing the demand for cost-effective measures to enhance operational efficiencies. Enterprises cannot afford to have a lower customer experience due to the unavailability of their websites. 24*7*365 availability of websites and cloud applications with 99.999% SLA uptime helps enterprises engage with their employees and customers and improve workplace productivity.

Restraint: Technological complexities

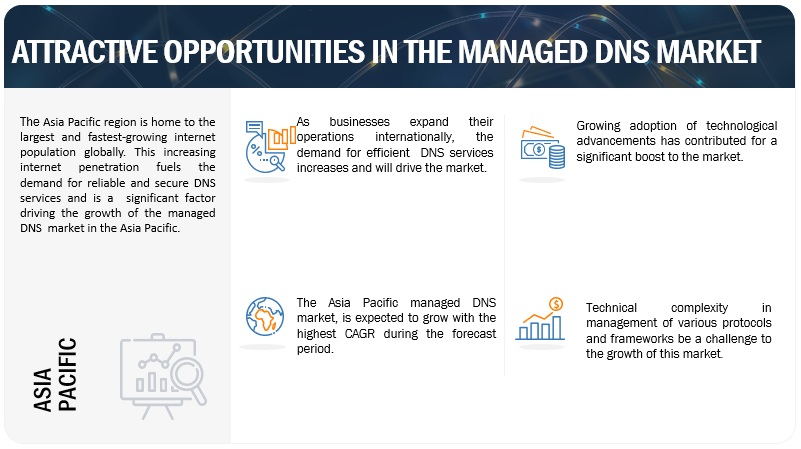
The technological complexity within the domain name system (DNS) services market presents a multifaceted challenge for providers. As the DNS ecosystem undergoes continuous evolution with the introduction of technologies such as IPv6, DNS Security Extensions (DNSSEC), and advanced routing protocols, service providers must grapple with seamless integration. The implementation of DNSSEC, aimed at enhancing security through cryptographic signatures, demands meticulous configuration. Additionally, the transition to IPv6 and the coexistence of IPv4 and IPv6 addresses introduce intricacies in configuration and management. In the context of multi-cloud environments, DNS services must adeptly integrate with diverse infrastructures and service offerings. The growing emphasis on automation and orchestration in IT operations necessitates providers to navigate the complexities of automated workflows while minimizing the risk of errors. Scalability challenges, particularly in handling increased volumes of DNS queries, and the intricacies of DNS load balancing further contribute to the technological intricacies. Successful providers must invest in research and development, maintain a skilled workforce, and adopt advanced technologies to effectively navigate and overcome these complexities, ensuring the delivery of reliable and innovative managed DNS in a competitive market.

Opportunity: The increasing online presence of various businesses across different verticals

Sectors such as retail and eCommerce, media and entertainment, and BFSI follow the customer-centric business model, which ensures higher customer experience. eCommerce companies such as Amazon, Walmart, Flipkart, and Alibaba have started big billion shopping days that lead to higher revenue and humongous web traffic. Over the last few years, retailers have worked on delivering the best end-to-end experience to users. The eCommerce sector has been growing at an unprecedented rate in developed and developing economies. The growing online customer base is compelling retailers to enhance customer experience through safeguarding web infrastructure. DNS service providers help retail and eCommerce companies safeguard DNS infrastructure from DDoS attacks. The COVID-19 pandemic has created huge opportunities for eCommerce businesses in the coming years. The following table depicts the sector-wise use cases/application areas that will increase DNS usage, in turn creating opportunities for managed DNS service providers.

Challenge: Market competition

In the realm of managed DNS, market competition emerges as a formidable challenge, shaping the strategies and operations of service providers. The landscape is characterized by intense rivalry, prompting providers to navigate several critical factors. Pricing pressures create a dynamic where providers must find a delicate equilibrium between offering competitive rates and maintaining the quality and features of their DNS services. Innovation becomes paramount as companies strive to differentiate themselves, requiring ongoing investment in research and development to introduce new features and stay ahead of technological trends. Quality of service stands as a non-negotiable criterion, with providers needing to ensure low latency, high reliability, and robust security to retain and attract clientele. The global reach of network infrastructure, customer support excellence, and transparent Service Level Agreements (SLAs) are pivotal elements in this competitive landscape. Marketing and branding strategies play a crucial role in establishing a distinct identity while addressing concerns related to vendor lock-in becomes essential for customer retention. Regulatory compliance, potential mergers and acquisitions, and a continuous adaptation to market dynamics further contribute to the intricate challenges posed by competition.

Managed DNS market Ecosystem

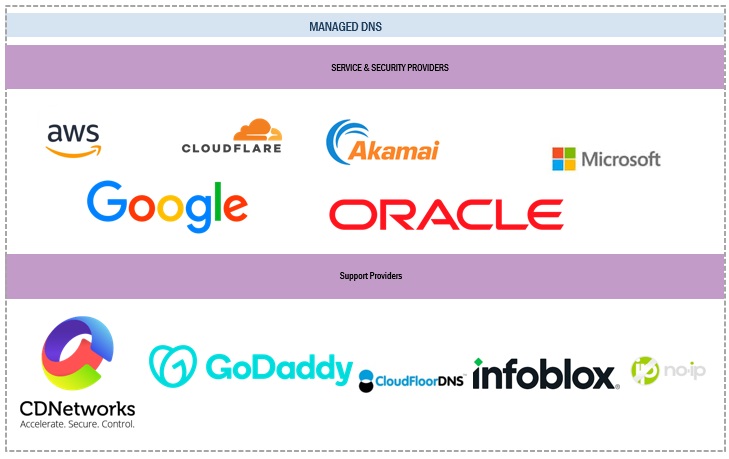
Prominent companies in this market include a well-established, financially stable provider of the managed DNS market. These companies have innovated their offerings and possess a diversified product portfolio, state-of-the-art technologies, and marketing networks. Prominent companies in this market include AWS (US), Cloudflare (US), DNS Made Easy (US), GoDaddy (US), Vercara (US), Akamai (US), CDNetworks (US), Microsoft (US), NS1 (US), Oracle (US).
Managed Domain Name System (DNS) Market

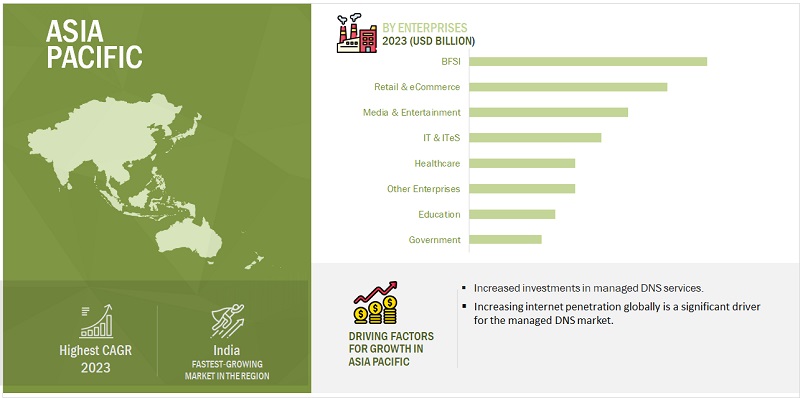
By enterprise, the education segment is expected to grow with the highest CAGR during the forecast period

In the education industry, managed DNS offers benefits such as load balancing to handle peak traffic on educational websites, DDoS mitigation to safeguard against cyber threats, and geographical load balancing for global institutions seeking optimized content delivery. With user-friendly interfaces and customization options, managed DNS facilitates easy domain management, including the creation of custom records and configurations. The redundancy and failover capabilities ensure uninterrupted access to critical learning platforms, while support for SPF and DKIM enhances email security, a vital aspect of communication in educational settings. Scalability features enable institutions to adapt to changing demands, and analytics tools contribute to proactive monitoring and optimization of DNS performance

By enterprise, the BFSI segment holds the largest market size during the forecast period

BFSI is a vital industry vertical, as it deals with financial data. The changes in economics significantly affect banks, insurance firms, and other players in the financial sector. The management in this vertical is under constant pressure to meet the required targets, and thus, needs a network that is more reliable and robust. Therefore, advanced technologies and various software and solutions can help BFSI companies prioritize their actions to manage their network smoothly.

Based on region, North America holds the largest market size during the forecast period

The managed DNS market in North America has been experiencing significant growth and development. The managed DNS market in North America is characterized by a dynamic interplay of factors that shape its landscape. With the pervasive increase in internet usage for diverse activities, the demand for reliable DNS services has grown substantially. Security concerns remain a pivotal driver, compelling businesses to seek managed DNS providers offering robust protection against cyber threats. Cloud adoption trends contribute significantly to the market, favoring providers with seamless integration capabilities. Performance optimization is a focal point, emphasizing features like low latency and effective
Managed Domain Name System (DNS) Market Size, and Share

Market Players:

The major players in the Managed DNS market are AWS (US), Cloudflare (US), DNS Made Easy (UK), GoDaddy (US), and Akamai (Spain). These players have adopted various growth strategies, such as partnerships, agreements and collaborations, new product launches, product enhancements, and acquisitions to expand their footprint in the managed DNS market.

Get online access to the report on the World's First Market Intelligence Cloud

  • Easy to Download Historical Data & Forecast Numbers
  • Company Analysis Dashboard for high growth potential opportunities
  • Research Analyst Access for customization & queries
  • Competitor Analysis with Interactive dashboard
  • Latest News, Updates & Trend analysis
Request Sample

Scope of the Report

Report Metrics

Details

Market size available for years

2018-2028

Base year considered

2022

Forecast period

2023–2028

Forecast units

Value (USD) Million/Billion

Segments Covered

DNS Service (Anycast Network, Distributed Denial of Service Protection, GeoDNS, Other DNS Services), DNS Server (Primary DNS Servers, Secondary DNS Servers), Cloud Deployment (Public Cloud, Private Cloud, Hybrid Cloud), End User (Service Providers, Enterprises), Enterprise (BFSI, Retail & eCommerce, Media & Entertainment, Healthcare, IT & ITeS, Government, Education, Other Enterprises), and Region

Region covered

North America, Europe, Asia Pacific, Middle East & Africa, Latin America

Companies covered

AWS (US), Cloudflare (US), DNS Made Easy (US), GoDaddy (US), Vercara (US), Akamai (US), CDNetworks (US), Microsoft (US), NS1 (US), Oracle (US), CloudfloorDNS (US), Google (US), F5 (US), No-IP (US), Netriplex (US), easyDNS (Canada), ClouDNS (Bulgaria), DNSimple (US), EuroDNS (Luxembourg), Gransy (Czech Republic), BlueCat (Canada), NuSEC (US), Rage4 (Ireland), StackPath (US), Total Uptime (US), PowerDNS (Netherlands)

This research report categorizes the managed DNS market based on DNS service, DNS server, cloud deployment, end user, enterprise, and region.

Based on DNS Service:
  • Anycast Network
  • Distributed Denial of Service Protection
  • GeoDNS
  • Other DNS Services
Based on DNS Server:
  • Primary DNS Servers
  • Secondary DNS Servers
Based on Cloud Deployment
  • Public Cloud
  • Private Cloud
  • Hybrid Cloud
Based on End User
  • Service providers
  • Enterprises
Based on Enterprise:
  • BFSI
  • Retail & eCommerce
  • Media & Entertainment
  • Healthcare
  • IT & ITeS
  • Government
  • Education
  • Other Enterprises
Based on the region:
  • North America
    • US
    • Canada
  • Europe
    • UK
    • Germany
    • France
    • Spain
    • Italy
    • Nordic Countries
    • Rest of Europe
  • Asia Pacific
    • China
    • Japan
    • India
    • South Korea
    • Australia & New Zealand (ANZ)
    • Southeast Asia
    • Rest of Asia Pacific
  • Middle East & Africa
    • GCC Countries
      • UAE
      • KSA
      • Rest of GCC Countries
    • South Africa
    • Rest of Middle East & Africa
  • Latin America
    • Brazil
    • Mexico
    • Rest of Latin America

Recent Developments

  • In April 2023, IBM acquired NS1. With the acquisition, IBM is adding core networking services, including NS1’s managed DNS capabilities, to its growing portfolio of network automation software.
  • In February 2023, CDNetworks announced support for QUIC and HTTP/3, to enhance the company’s capabilities in web application performance and improve the efficiency of network transmissions.
  • In February 2022, Cloudflare acquired Vectrix, to help businesses gain visibility and control of their applications. V Citrix enhances Cloudflare’s existing Zero Trust platform, Cloudflare One, by allowing security teams to scan third-party tools–including Google Workspace, GitHub, and AWS–to detect and mitigate issues such as inappropriate file sharing and user permission misconfigurations.
  • In July 2022, NS1 announced two new supports for DNS record types: SVCB (“service binding”) and HTTPS (Hypertext Transfer Protocol Secure).
  • In September 2022, Cloudflare announced Turnstile, a simple, private way to replace CAPTCHA (Completely Automated Public Turing test to tell Computers and Humans Apart) and help validate humanity across the Internet.

Frequently Asked Questions (FAQ):

To speak to our analyst for a discussion on the above findings, click Speak to Analyst

TABLE OF CONTENTS
 
1 INTRODUCTION (Page No. - 29)
    1.1 STUDY OBJECTIVES 
    1.2 MARKET DEFINITION 
           1.2.1 INCLUSIONS AND EXCLUSIONS
    1.3 MARKET SCOPE 
           1.3.1 MARKET SEGMENTATION
           1.3.2 REGIONS COVERED
    1.4 YEARS CONSIDERED 
    1.5 CURRENCY CONSIDERED 
           TABLE 1 USD EXCHANGE RATES, 2019–2022
    1.6 STAKEHOLDERS 
    1.7 SUMMARY OF CHANGES 
 
2 RESEARCH METHODOLOGY (Page No. - 34)
    2.1 RESEARCH DATA 
           FIGURE 1 MARKET: RESEARCH DESIGN
           2.1.1 SECONDARY DATA
                    2.1.1.1 Key data from secondary sources
           2.1.2 PRIMARY DATA
                    2.1.2.1 Primary interviews with experts
                    2.1.2.2 Breakup of primary profiles
                    2.1.2.3 Key data from primary sources
                    2.1.2.4 Key insights from industry experts
    2.2 MARKET FORECAST 
           TABLE 2 FACTOR ANALYSIS
    2.3 MARKET SIZE ESTIMATION 
           FIGURE 2 SUPPLY SIDE 1: MANAGED DNS MARKET
           FIGURE 3 SUPPLY SIDE 2: MARKET
           FIGURE 4 APPROACH 2 (DEMAND SIDE): MARKET
           2.3.1 TOP-DOWN APPROACH
                    FIGURE 5 TOP-DOWN APPROACH
           2.3.2 BOTTOM-UP APPROACH
                    FIGURE 6 BOTTOM-UP APPROACH
    2.4 DATA TRIANGULATION 
           FIGURE 7 DATA TRIANGULATION
    2.5 ASSUMPTIONS 
    2.6 LIMITATIONS 
    2.7 RECESSION IMPACT ANALYSIS 
 
3 EXECUTIVE SUMMARY (Page No. - 46)
    FIGURE 8 MANAGED DNS MARKET, 2021–2028 (USD MILLION) 
    FIGURE 9 MARKET, REGIONAL SHARE, 2023 
    FIGURE 10 ASIA PACIFIC TO BE BEST MARKET FOR INVESTMENTS DURING FORECAST PERIOD 
 
4 PREMIUM INSIGHTS (Page No. - 49)
    4.1 ATTRACTIVE OPPORTUNITIES IN MANAGED DNS MARKET 
           FIGURE 11 NEED TO SECURE WEBSITES FROM DDOS ATTACKS AND ENHANCE CUSTOMER EXPERIENCE TO DRIVE MARKET
    4.2 NORTH AMERICA: MARKET, BY CLOUD DEPLOYMENT AND COUNTRY 
           FIGURE 12 PUBLIC CLOUD AND US TO ACCOUNT FOR LARGEST SHARES IN NORTH AMERICA IN 2023
    4.3 ASIA PACIFIC: MARKET, BY CLOUD DEPLOYMENT AND COUNTRY 
           FIGURE 13 PUBLIC CLOUD AND CHINA TO ACCOUNT FOR LARGEST SHARES IN ASIA PACIFIC IN 2023
 
5 MARKET OVERVIEW AND INDUSTRY TRENDS (Page No. - 51)
    5.1 INTRODUCTION 
    5.2 MARKET DYNAMICS 
           FIGURE 14 MANAGED DNS MARKET: DRIVERS, RESTRAINTS, OPPORTUNITIES, AND CHALLENGES
           5.2.1 DRIVERS
                    5.2.1.1 Need to secure websites from DDoS attacks
                               FIGURE 15 NUMBER OF DDOS ATTACKS, 2018–2023
                    5.2.1.2 Low cost associated with managed DNS services
                    5.2.1.3 High returns on investment and enhanced customer experience
           5.2.2 RESTRAINTS
                    5.2.2.1 Availability of free DNS service providers
                    5.2.2.2 Technological complexities
           5.2.3 OPPORTUNITIES
                    5.2.3.1 Growth in cloud computing
                    5.2.3.2 Increasing online presence of retail & eCommerce, media & entertainment, and BFSI sectors
           5.2.4 CHALLENGES
                    5.2.4.1 Data privacy concerns
                    5.2.4.2 Presence of several vendors leading to competition
    5.3 INDUSTRY TRENDS 
           5.3.1 BRIEF HISTORY OF MANAGED DNS
                    FIGURE 16 BRIEF HISTORY OF MANAGED DNS
                    5.3.1.1 2000s–2010s
                    5.3.1.2 2010s–2020s
                    5.3.1.3 2020s–Present
           5.3.2 ECOSYSTEM/MARKET MAP
                    TABLE 3 MANAGED DNS MARKET: ECOSYSTEM
                    FIGURE 17 KEY PLAYERS IN MARKET ECOSYSTEM
           5.3.3 CASE STUDY ANALYSIS
                    TABLE 4 UNIVERSITY OF EAST LONDON DEPLOYED ORACLE DYN’S MANAGED DNS SERVICES TO FACILITATE WEBSITE ACCESS TO ITS GROWING COMMUNITY
                    TABLE 5 ENCRYPT.ME DEPLOYED NS1’S MANAGED DNS SERVICES TO ENSURE SECURE CONNECTIVITY TO ON-THE-GO USERS
                    TABLE 6 OCTAPHARMA IMPLEMENTED CLOUDFLOORDNS’ SOLUTIONS TO ACHIEVE FASTER CONNECTIVITY
                    TABLE 7 COCHRANE DEPLOYED VERCARA’S ULTRADNS SERVICE TO ACHIEVE CONTROL OVER DNS PERFORMANCE AND OPTIMUM UPTIME
                    TABLE 8 EZMSP ADOPTED DNSIMPLE’S MANAGED DNS SERVICES TO IMPROVE OVERALL PERFORMANCE
           5.3.4 VALUE CHAIN ANALYSIS
                    FIGURE 18 VALUE CHAIN ANALYSIS
           5.3.5 REGULATORY LANDSCAPE
                    5.3.5.1 Regulatory bodies, government agencies, and other organizations
                               TABLE 9 NORTH AMERICA: REGULATORY BODIES, GOVERNMENT AGENCIES, AND OTHER ORGANIZATIONS
                               TABLE 10 EUROPE: REGULATORY BODIES, GOVERNMENT AGENCIES, AND OTHER ORGANIZATIONS
                               TABLE 11 ASIA PACIFIC: REGULATORY BODIES, GOVERNMENT AGENCIES, AND OTHER ORGANIZATIONS
                               TABLE 12 ROW: REGULATORY BODIES, GOVERNMENT AGENCIES, AND OTHER ORGANIZATIONS
                               5.3.5.1.1 Internet Corporation for Assigned Names and Numbers (ICANN)
                               5.3.5.1.2 Country Code Top-Level Domain (ccTLD)
                               5.3.5.1.3 Internet Assigned Numbers Authority (IANA)
                               5.3.5.1.4 Communications Decency Act (CDA)
                               5.3.5.1.5 Digital Millennium Copyright Act (DMCA)
                               5.3.5.1.6 Anti-Cybersquatting Consumer Protection Act (ACPA)
                               5.3.5.1.7 Lanham Act
                               5.3.5.1.8 General Data Protection Regulation (GDPR)
                               5.3.5.1.9 California Consumer Privacy Act (CCPA)
           5.3.6 PRICING ANALYSIS
                    5.3.6.1 Average selling price trend of key players, by domain name registration per year
                               FIGURE 19 AVERAGE SELLING PRICE TREND OF KEY PLAYERS, BY DOMAIN NAME REGISTRATION PER YEAR
                               TABLE 13 AVERAGE SELLING PRICE OF KEY PLAYERS, BY DOMAIN NAME REGISTRATION PER YEAR
                    5.3.6.2 Indicative pricing analysis of managed DNS offerings
                               TABLE 14 INDICATIVE PRICING ANALYSIS OF MANAGED DNS OFFERINGS
           5.3.7 TECHNOLOGY ANALYSIS
                    5.3.7.1 Key technologies
                               5.3.7.1.1 Anycast Routing
                               5.3.7.1.2 Global Server Load Balancing (GSLB)
                               5.3.7.1.3 Application Programming Interface (API)
                    5.3.7.2 Complementary technologies
                               5.3.7.2.1 Content Delivery Networks
                               5.3.7.2.2 Cloud Computing
                    5.3.7.3 Adjacent technologies
                               5.3.7.3.1 Web Application Firewall (WAF)
                               5.3.7.3.2 Traffic Management (TM)
           5.3.8 PATENT ANALYSIS
                    5.3.8.1 Methodology
                               FIGURE 20 LIST OF MAJOR PATENTS OFFERED FOR MANAGED DNS MARKET
                               TABLE 15 LIST OF MAJOR PATENTS
           5.3.9 KEY STAKEHOLDERS & BUYING CRITERIA
                    5.3.9.1 Key stakeholders in buying criteria
                               FIGURE 21 INFLUENCE OF STAKEHOLDERS ON BUYING PROCESS FOR TOP THREE ENTERPRISES
                               TABLE 16 INFLUENCE OF STAKEHOLDERS ON BUYING PROCESS FOR TOP THREE ENTERPRISES
                    5.3.9.2 Buying criteria
                               FIGURE 22 KEY BUYING CRITERIA FOR TOP THREE END USERS
                               TABLE 17 KEY BUYING CRITERIA FOR TOP THREE END USERS
           5.3.10 KEY CONFERENCES & EVENTS, 2023–2024
                    TABLE 18 MANAGED DNS MARKET: DETAILED LIST OF CONFERENCES & EVENTS, 2023–2024
           5.3.11 PORTER’S FIVE FORCES ANALYSIS
                    TABLE 19 IMPACT OF PORTER’S FIVE FORCES ON MARKET
                    FIGURE 23 PORTER’S FIVE FORCES ANALYSIS
                    5.3.11.1 Threat of new entrants
                    5.3.11.2 Threat of substitutes
                    5.3.11.3 Bargaining power of buyers
                    5.3.11.4 Bargaining power of suppliers
                    5.3.11.5 Intensity of competitive rivalry
           5.3.12 TRENDS/DISRUPTIONS IMPACTING CUSTOMER’S BUSINESS
                    FIGURE 24 REVENUE SHIFT FOR MARKET
           5.3.13 BEST PRACTICES IN MARKET
           5.3.14 MANAGED DNS MARKET: CURRENT AND EMERGING BUSINESS MODELS
                    5.3.14.1 Subscription-based Model
                    5.3.14.2 Usage-based Model
                    5.3.14.3 DNS-as-a-Service (DaaS) Model
                    5.3.14.4 Hybrid-managed DNS Model
           5.3.15 MANAGED DNS TOOLS, FRAMEWORKS, AND TECHNIQUES
           5.3.16 FUTURE LANDSCAPE OF MARKET
                    5.3.16.1 Managed DNS technology roadmap till 2030
                               5.3.16.1.1 Short-term (2023–2025)
                               5.3.16.1.2 Mid-term (2026–2028)
                               5.3.16.1.3 Long-term (2028–2030)
 
6 MANAGED DNS MARKET, BY DNS SERVICE (Page No. - 80)
    6.1 INTRODUCTION 
           FIGURE 25 ANYCAST NETWORK SEGMENT TO GROW AT HIGHEST CAGR DURING FORECAST PERIOD
           TABLE 20 MARKET, BY DNS SERVICE, 2018–2022 (USD MILLION)
           TABLE 21 MARKET, BY DNS SERVICE, 2023–2028 (USD MILLION)
           6.1.1 DNS SERVICES: MARKET DRIVERS
    6.2 ANYCAST NETWORK 
           6.2.1 GROWING NEED TO PROVIDE ENHANCED CUSTOMER EXPERIENCES WITH MORE OPTIMIZED ROUTES TO DRIVE MARKET
                    TABLE 22 ANYCAST NETWORK: MARKET, BY REGION, 2018–2022 (USD MILLION)
                    TABLE 23 ANYCAST NETWORK: MARKET, BY REGION, 2023–2028 (USD MILLION)
    6.3 DISTRIBUTED DENIAL-OF-SERVICE PROTECTION 
           6.3.1 NEED FOR DATA INTEGRITY PROTECTION AND PREVENT SECURITY THREATS TO PROPEL MARKET
                    TABLE 24 DISTRIBUTED DENIAL-OF-SERVICE PROTECTION: MARKET, BY REGION, 2018–2022 (USD MILLION)
                    TABLE 25 DISTRIBUTED DENIAL-OF-SERVICE PROTECTION: MARKET, BY REGION, 2023–2028 (USD MILLION)
    6.4 GEODNS 
           6.4.1 INCREASING NEED TO PROVIDE BETTER LOCATION-BASED SERVICES TO FUEL DEMAND FOR MANAGED DNS SOLUTIONS
                    TABLE 26 GEODNS: MARKET, BY REGION, 2018–2022 (USD MILLION)
                    TABLE 27 GEODNS: MARKET, BY REGION, 2023–2028 (USD MILLION)
    6.5 OTHER DNS SERVICES 
           TABLE 28 OTHER DNS SERVICES: MARKET, BY REGION, 2018–2022 (USD MILLION)
           TABLE 29 OTHER DNS SERVICES: MARKET, BY REGION, 2023–2028 (USD MILLION)
 
7 MANAGED DNS MARKET, BY DNS SERVER (Page No. - 86)
    7.1 INTRODUCTION 
           FIGURE 26 SECONDARY DNS SERVER SEGMENT TO EXHIBIT HIGHER CAGR DURING FORECAST PERIOD
           TABLE 30 MARKET, BY DNS SERVER, 2018–2022 (USD MILLION)
           TABLE 31 MARKET, BY DNS SERVER, 2023–2028 (USD MILLION)
           7.1.1 DNS SERVERS: MARKET DRIVERS
    7.2 PRIMARY DNS SERVERS 
           7.2.1 NEED TO TRANSFER ZONE DATA FROM PRIMARY SERVERS TO SECONDARY SERVERS TO PROPEL MARKET
                    TABLE 32 PRIMARY DNS SERVERS: MARKET, BY REGION, 2018–2022 (USD MILLION)
                    TABLE 33 PRIMARY DNS SERVERS: MARKET, BY REGION, 2023–2028 (USD MILLION)
    7.3 SECONDARY DNS SERVERS 
           7.3.1 RISING NEED FOR BACKUP SERVERS IN CASE OF OUTAGES TO BOOST DEMAND FOR SECONDARY DNS SERVERS
                    TABLE 34 SECONDARY DNS SERVERS: MARKET, BY REGION, 2018–2022 (USD MILLION)
                    TABLE 35 SECONDARY DNS SERVERS: MARKET, BY REGION, 2023–2028 (USD MILLION)
 
8 MANAGED DNS MARKET, BY CLOUD DEPLOYMENT (Page No. - 91)
    8.1 INTRODUCTION 
           FIGURE 27 HYBRID CLOUD SEGMENT TO EXHIBIT HIGHEST CAGR DURING FORECAST PERIOD
           TABLE 36 MARKET, BY CLOUD DEPLOYMENT, 2018–2022 (USD MILLION)
           TABLE 37 MARKET, BY CLOUD DEPLOYMENT, 2023–2028 (USD MILLION)
           8.1.1 CLOUD DEPLOYMENT: MARKET DRIVERS
    8.2 PUBLIC CLOUD 
           8.2.1 EASE OF ACCESS AND FASTER DEPLOYMENT TO FUEL HIGH ADOPTION OF PUBLIC CLOUD SERVICES
                    TABLE 38 PUBLIC CLOUD: MARKET, BY REGION, 2018–2022 (USD MILLION)
                    TABLE 39 PUBLIC CLOUD: MARKET, BY REGION, 2023–2028 (USD MILLION)
    8.3 PRIVATE CLOUD 
           8.3.1 NEED TO REDUCE RISKS, SECURITY ISSUES, AND REGULATORY HURDLES TO DRIVE MARKET
                    TABLE 40 PRIVATE CLOUD: MARKET, BY REGION, 2018–2022 (USD MILLION)
                    TABLE 41 PRIVATE CLOUD: MARKET, BY REGION, 2023–2028 (USD MILLION)
    8.4 HYBRID CLOUD 
           8.4.1 USAGE-FRIENDLY, VERSATILE, AND COST-EFFECTIVE FEATURES OF HYBRID CLOUD TO INCREASE ITS ADOPTION
                    TABLE 42 HYBRID CLOUD: MARKET, BY REGION, 2018–2022 (USD MILLION)
                    TABLE 43 HYBRID CLOUD: MARKET, BY REGION, 2023–2028 (USD MILLION)
 
9 MANAGED DNS MARKET, BY END USER (Page No. - 97)
    9.1 INTRODUCTION 
           FIGURE 28 SERVICE PROVIDERS SEGMENT TO EXHIBIT HIGHER CAGR DURING FORECAST PERIOD
           TABLE 44 MARKET, BY END USER, 2018–2022 (USD MILLION)
           TABLE 45 MARKET, BY END USER, 2023–2028 (USD MILLION)
           9.1.1 END USERS: MARKET DRIVERS
    9.2 SERVICE PROVIDERS 
           9.2.1 NEED FOR ROBUST AND AGILE INFRASTRUCTURE FOR SECURE USER ENVIRONMENT AND SMOOTH FUNCTIONALITY TO PROPEL MARKET
                    TABLE 46 SERVICE PROVIDERS: MARKET, BY REGION, 2018–2022 (USD MILLION)
                    TABLE 47 SERVICE PROVIDERS: MARKET, BY REGION, 2023–2028 (USD MILLION)
    9.3 ENTERPRISES 
           9.3.1 INCREASING NEED TO PROVIDE BETTER CUSTOMER EXPERIENCE THROUGH OPENDNS TO DRIVE MARKET
                    TABLE 48 ENTERPRISES: MARKET, BY REGION, 2018–2022 (USD MILLION)
                    TABLE 49 ENTERPRISES: MARKET, BY REGION, 2023–2028 (USD MILLION)
 
10 MANAGED DNS MARKET, BY ENTERPRISE (Page No. - 102)
     10.1 INTRODUCTION 
               FIGURE 29 MEDIA & ENTERTAINMENT SEGMENT TO HOLD LARGEST MARKET DURING FORECAST PERIOD
               TABLE 50 MARKET, BY ENTERPRISE, 2018–2022 (USD MILLION)
               TABLE 51 MARKET, BY ENTERPRISE, 2023–2028 (USD MILLION)
             10.1.1 ENTERPRISES: MARKET DRIVERS
     10.2 BANKING, FINANCIAL SERVICES, AND INSURANCE (BFSI) 
             10.2.1 NEED FOR DDOS PROTECTION, DNS SECURITY, AND COMPLIANCE ADHERENCE TO FUEL DEMAND FOR MANAGED DNS
                       TABLE 52 BFSI: MARKET, BY REGION, 2018–2022 (USD MILLION)
                       TABLE 53 BFSI: MANAGED DNS MARKET, BY REGION, 2023–2028 (USD MILLION)
             10.2.2 CASE STUDY
                       10.2.2.1 TrueLayer used Cloudflare Zero trust to ensure seamless employee access to its infrastructure and secure customer financial transactions
     10.3 RETAIL & ECOMMERCE 
             10.3.1 RISE IN CYBERATTACKS AND THEFTS TO INCREASE NEED FOR ENHANCED DNS SOLUTIONS AND SERVICES
                       TABLE 54 RETAIL & ECOMMERCE: MARKET, BY REGION, 2018–2022 (USD MILLION)
                       TABLE 55 RETAIL & ECOMMERCE: MARKET, BY REGION, 2023–2028 (USD MILLION)
             10.3.2 CASE STUDY
                       10.3.2.1 Shopify + Cloudflare powered 1,000,000 storefronts on biggest shopping weekend
     10.4 MEDIA & ENTERTAINMENT 
             10.4.1 INCREASING USE OF INTERNET AND WEB APPLICATIONS TO PROPEL MARKET
                       TABLE 56 MEDIA & ENTERTAINMENT: MARKET, BY REGION, 2018–2022 (USD MILLION)
                       TABLE 57 MEDIA & ENTERTAINMENT: MARKET, BY REGION, 2023–2028 (USD MILLION)
             10.4.2 CASE STUDY
                       10.4.2.1 Pasion Futbol used Cloudflare to supercharge its website, while simultaneously reducing bandwidth costs
     10.5 HEALTHCARE 
             10.5.1 NEED FOR STRICT ADHERENCE TO REGULATORY NORMS TO INCREASE ADOPTION OF MANAGED DNS SOLUTIONS
                       TABLE 58 HEALTHCARE: MARKET, BY REGION, 2018–2022 (USD MILLION)
                       TABLE 59 HEALTHCARE: MARKET, BY REGION, 2023–2028 (USD MILLION)
             10.5.2 CASE STUDY
                       10.5.2.1 Octapharma streamlined its Cisco Unified Communications platform with CloudFloor GEO DNS
     10.6 IT & ITES 
             10.6.1 NEED TO MINIMIZE DOWNTIME BY GUARANTEEING CONSTANT ACCESS TO ONLINE RESOURCES TO PROPEL MARKET
                       TABLE 60 IT & ITES: MANAGED DNS MARKET, BY REGION, 2018–2022 (USD MILLION)
                       TABLE 61 IT & ITES: MARKET, BY REGION, 2023–2028 (USD MILLION)
             10.6.2 CASE STUDY
                       10.6.2.1 EuroDNS helped GlobalSign with DNS accounts registrar
     10.7 GOVERNMENT 
             10.7.1 DNS SOLUTIONS AND SERVICES TO HELP MEET REGULATORY COMPLIANCE
                       TABLE 62 GOVERNMENT: MARKET, BY REGION, 2018–2022 (USD MILLION)
                       TABLE 63 GOVERNMENT: MARKET, BY REGION, 2023–2028 (USD MILLION)
             10.7.2 CASE STUDY
                       10.7.2.1 Belgium gave citizens secure and fast access to personal data online
     10.8 EDUCATION 
             10.8.1 INCREASING NEED FOR CONFIDENTIALITY, INTEGRITY, AND EASY AVAILABILITY OF DATA AND RESOURCES TO DRIVE MARKET
                       TABLE 64 EDUCATION: MARKET, BY REGION, 2018–2022 (USD MILLION)
                       TABLE 65 EDUCATION: MARKET, BY REGION, 2023–2028 (USD MILLION)
             10.8.2 CASE STUDY
                       10.8.2.1 One of top 3 universities in Asia selected CDNetworks ESA to build up Zero-Trust Secure Access Network
     10.9 OTHER ENTERPRISES 
               TABLE 66 OTHER ENTERPRISES: MARKET, BY REGION, 2018–2022 (USD MILLION)
               TABLE 67 OTHER ENTERPRISES: MARKET, BY REGION, 2023–2028 (USD MILLION)
 
11 MANAGED DNS MARKET, BY REGION (Page No. - 115)
     11.1 INTRODUCTION 
               FIGURE 30 MARKET: REGIONAL SNAPSHOT, 2023
               FIGURE 31 ASIA PACIFIC TO EXHIBIT HIGHEST CAGR DURING FORECAST PERIOD
               TABLE 68 MARKET, BY REGION, 2018–2022 (USD MILLION)
               TABLE 69 MARKET, BY REGION, 2023–2028 (USD MILLION)
     11.2 NORTH AMERICA 
               FIGURE 32 NORTH AMERICA: MARKET SNAPSHOT
             11.2.1 NORTH AMERICA: MARKET DRIVERS
             11.2.2 NORTH AMERICA: RECESSION IMPACT
                       TABLE 70 NORTH AMERICA: MANAGED DNS MARKET, BY DNS SERVICE, 2018–2022 (USD MILLION)
                       TABLE 71 NORTH AMERICA: MARKET, BY DNS SERVICE, 2023–2028 (USD MILLION)
                       TABLE 72 NORTH AMERICA: MARKET, BY DNS SERVER, 2018–2022 (USD MILLION)
                       TABLE 73 NORTH AMERICA: MARKET, BY DNS SERVER, 2023–2028 (USD MILLION)
                       TABLE 74 NORTH AMERICA: MARKET, BY CLOUD DEPLOYMENT, 2018–2022 (USD MILLION)
                       TABLE 75 NORTH AMERICA: MARKET, BY CLOUD DEPLOYMENT, 2023–2028 (USD MILLION)
                       TABLE 76 NORTH AMERICA: MARKET, BY END USER, 2018–2022 (USD MILLION)
                       TABLE 77 NORTH AMERICA: MARKET, BY END USER, 2023–2028 (USD MILLION)
                       TABLE 78 NORTH AMERICA: MARKET, BY ENTERPRISE, 2018–2022 (USD MILLION)
                       TABLE 79 NORTH AMERICA: MARKET, BY ENTERPRISE, 2023–2028 (USD MILLION)
                       TABLE 80 NORTH AMERICA: MARKET, BY COUNTRY, 2018–2022 (USD MILLION)
                       TABLE 81 NORTH AMERICA: MARKET, BY COUNTRY, 2023–2028 (USD MILLION)
             11.2.3 US
                       11.2.3.1 Presence of tech giants, investments in R&D activities, and rapid cloud adoption to propel market
                                   TABLE 82 US: MANAGED DNS MARKET, BY DNS SERVICE, 2018–2022 (USD MILLION)
                                   TABLE 83 US: MARKET, BY DNS SERVICE, 2023–2028 (USD MILLION)
                                   TABLE 84 US: MARKET, BY DNS SERVER, 2018–2022 (USD MILLION)
                                   TABLE 85 US: MARKET, BY DNS SERVER, 2023–2028 (USD MILLION)
                                   TABLE 86 US: MARKET, BY CLOUD DEPLOYMENT, 2018–2022 (USD MILLION)
                                   TABLE 87 US: MARKET, BY CLOUD DEPLOYMENT, 2023–2028 (USD MILLION)
                                   TABLE 88 US: MARKET, BY END USER, 2018–2022 (USD MILLION)
                                   TABLE 89 US: MARKET, BY END USER, 2023–2028 (USD MILLION)
             11.2.4 CANADA
                       11.2.4.1 Rapid technological advancements and increasing cybersecurity attacks on websites to drive market
                                   TABLE 90 CANADA: MANAGED DNS MARKET, BY DNS SERVICE, 2018–2022 (USD MILLION)
                                   TABLE 91 CANADA: MARKET, BY DNS SERVICE, 2023–2028 (USD MILLION)
                                   TABLE 92 CANADA: MARKET, BY DNS SERVER, 2018–2022 (USD MILLION)
                                   TABLE 93 CANADA: MARKET, BY DNS SERVER, 2023–2028 (USD MILLION)
                                   TABLE 94 CANADA: MARKET, BY CLOUD DEPLOYMENT, 2018–2022 (USD MILLION)
                                   TABLE 95 CANADA: MARKET, BY CLOUD DEPLOYMENT, 2023–2028 (USD MILLION)
                                   TABLE 96 CANADA: MARKET, BY END USER, 2018–2022 (USD MILLION)
                                   TABLE 97 CANADA: MARKET, BY END USER, 2023–2028 (USD MILLION)
     11.3 EUROPE 
             11.3.1 EUROPE: MARKET DRIVERS
             11.3.2 EUROPE: RECESSION IMPACT
                       TABLE 98 EUROPE: MANAGED DNS MARKET, BY DNS SERVICE, 2018–2022 (USD MILLION)
                       TABLE 99 EUROPE: MARKET, BY DNS SERVICE, 2023–2028 (USD MILLION)
                       TABLE 100 EUROPE: MARKET, BY DNS SERVER, 2018–2022 (USD MILLION)
                       TABLE 101 EUROPE: MARKET, BY DNS SERVER, 2023–2028 (USD MILLION)
                       TABLE 102 EUROPE: MARKET, BY CLOUD DEPLOYMENT, 2018–2022 (USD MILLION)
                       TABLE 103 EUROPE: MARKET, BY CLOUD DEPLOYMENT, 2023–2028 (USD MILLION)
                       TABLE 104 EUROPE: MARKET, BY END USER, 2018–2022 (USD MILLION)
                       TABLE 105 EUROPE: MARKET, BY END USER, 2023–2028 (USD MILLION)
                       TABLE 106 EUROPE: MARKET, BY ENTERPRISE, 2018–2022 (USD MILLION)
                       TABLE 107 EUROPE: MARKET, BY ENTERPRISE, 2023–2028 (USD MILLION)
                       TABLE 108 EUROPE: MARKET, BY COUNTRY, 2018–2022 (USD MILLION)
                       TABLE 109 EUROPE: MARKET, BY COUNTRY, 2023–2028 (USD MILLION)
             11.3.3 UK
                       11.3.3.1 Rising adoption of managed DNS solutions, growing internet traffic and DNS queries, and presence of online sellers to drive market
                                   TABLE 110 UK: MANAGED DNS MARKET, BY DNS SERVICE, 2018–2022 (USD MILLION)
                                   TABLE 111 UK: MARKET, BY DNS SERVICE, 2023–2028 (USD MILLION)
                                   TABLE 112 UK: MARKET, BY DNS SERVER, 2018–2022 (USD MILLION)
                                   TABLE 113 UK: MARKET, BY DNS SERVER, 2023–2028 (USD MILLION)
                                   TABLE 114 UK: MARKET, BY CLOUD DEPLOYMENT, 2018–2022 (USD MILLION)
                                   TABLE 115 UK: MARKET, BY CLOUD DEPLOYMENT, 2023–2028 (USD MILLION)
                                   TABLE 116 UK: MARKET, BY END USER, 2018–2022 (USD MILLION)
                                   TABLE 117 UK: MARKET, BY END USER, 2023–2028 (USD MILLION)
             11.3.4 GERMANY
                       11.3.4.1 Increasing initiatives for technological advancements and rising internet traffic to fuel demand for managed DNS solutions
                                   TABLE 118 GERMANY: MANAGED DNS MARKET, BY DNS SERVICE, 2018–2022 (USD MILLION)
                                   TABLE 119 GERMANY: MARKET, BY DNS SERVICE, 2023–2028 (USD MILLION)
                                   TABLE 120 GERMANY: MARKET, BY DNS SERVER, 2018–2022 (USD MILLION)
                                   TABLE 121 GERMANY: MARKET, BY DNS SERVER, 2023–2028 (USD MILLION)
                                   TABLE 122 GERMANY: MARKET, BY CLOUD DEPLOYMENT, 2018–2022 (USD MILLION)
                                   TABLE 123 GERMANY: MARKET, BY CLOUD DEPLOYMENT, 2023–2028 (USD MILLION)
                                   TABLE 124 GERMANY: MARKET, BY END USER, 2018–2022 (USD MILLION)
                                   TABLE 125 GERMANY: MARKET, BY END USER, 2023–2028 (USD MILLION)
             11.3.5 FRANCE
                       11.3.5.1 Digitalization, cyber threats, cloud adoption, and data privacy regulations to boost demand for managed DNS solutions
                                   TABLE 126 FRANCE: MANAGED DNS MARKET, BY DNS SERVICE, 2018–2022 (USD MILLION)
                                   TABLE 127 FRANCE: MARKET, BY DNS SERVICE, 2023–2028 (USD MILLION)
                                   TABLE 128 FRANCE: MARKET, BY DNS SERVER, 2018–2022 (USD MILLION)
                                   TABLE 129 FRANCE: MARKET, BY DNS SERVER, 2023–2028 (USD MILLION)
                                   TABLE 130 FRANCE: MARKET, BY CLOUD DEPLOYMENT, 2018–2022 (USD MILLION)
                                   TABLE 131 FRANCE: MARKET, BY CLOUD DEPLOYMENT, 2023–2028 (USD MILLION)
                                   TABLE 132 FRANCE: MARKET, BY END USER, 2018–2022 (USD MILLION)
                                   TABLE 133 FRANCE: MARKET, BY END USER, 2023–2028 (USD MILLION)
             11.3.6 ITALY
                       11.3.6.1 Increasing demand for internet services, online education, and digitalization to propel market
                                   TABLE 134 ITALY: MANAGED DNS MARKET, BY DNS SERVICE, 2018–2022 (USD MILLION)
                                   TABLE 135 ITALY: MARKET, BY DNS SERVICE, 2023–2028 (USD MILLION)
                                   TABLE 136 ITALY: MARKET, BY DNS SERVER, 2018–2022 (USD MILLION)
                                   TABLE 137 ITALY: MARKET, BY DNS SERVER, 2023–2028 (USD MILLION)
                                   TABLE 138 ITALY: MARKET, BY CLOUD DEPLOYMENT, 2018–2022 (USD MILLION)
                                   TABLE 139 ITALY: MARKET, BY CLOUD DEPLOYMENT, 2023–2028 (USD MILLION)
                                   TABLE 140 ITALY: MARKET, BY END USER, 2018–2022 (USD MILLION)
                                   TABLE 141 ITALY: MARKET, BY END USER, 2023–2028 (USD MILLION)
             11.3.7 SPAIN
                       11.3.7.1 Increasing internet traffic, concerns over cybersecurity, adoption of cloud technology, and evolving data regulations to drive market
                                   TABLE 142 SPAIN: MANAGED DNS MARKET, BY DNS SERVICE, 2018–2022 (USD MILLION)
                                   TABLE 143 SPAIN: MARKET, BY DNS SERVICE, 2023–2028 (USD MILLION)
                                   TABLE 144 SPAIN: MARKET, BY DNS SERVER, 2018–2022 (USD MILLION)
                                   TABLE 145 SPAIN: MARKET, BY DNS SERVER, 2023–2028 (USD MILLION)
                                   TABLE 146 SPAIN: MARKET, BY CLOUD DEPLOYMENT, 2018–2022 (USD MILLION)
                                   TABLE 147 SPAIN: MARKET, BY CLOUD DEPLOYMENT, 2023–2028 (USD MILLION)
                                   TABLE 148 SPAIN: MARKET, BY END USER, 2018–2022 (USD MILLION)
                                   TABLE 149 SPAIN: MARKET, BY END USER, 2023–2028 (USD MILLION)
             11.3.8 NORDICS
                       11.3.8.1 Increased internet usage, adoption of cloud technology, and security concerns to propel market
             11.3.9 REST OF EUROPE
     11.4 ASIA PACIFIC 
               FIGURE 33 ASIA PACIFIC: MARKET SNAPSHOT
             11.4.1 ASIA PACIFIC: MARKET DRIVERS
             11.4.2 ASIA PACIFIC: RECESSION IMPACT
                       TABLE 150 ASIA PACIFIC: MANAGED DNS MARKET, BY DNS SERVICE, 2018–2022 (USD MILLION)
                       TABLE 151 ASIA PACIFIC: MARKET, BY DNS SERVICE, 2023–2028 (USD MILLION)
                       TABLE 152 ASIA PACIFIC: MARKET, BY DNS SERVER, 2018–2022 (USD MILLION)
                       TABLE 153 ASIA PACIFIC: MARKET, BY DNS SERVER, 2023–2028 (USD MILLION)
                       TABLE 154 ASIA PACIFIC: MARKET, BY CLOUD DEPLOYMENT, 2018–2022 (USD MILLION)
                       TABLE 155 ASIA PACIFIC: MARKET, BY CLOUD DEPLOYMENT, 2023–2028 (USD MILLION)
                       TABLE 156 ASIA PACIFIC: MARKET, BY END USER, 2018–2022 (USD MILLION)
                       TABLE 157 ASIA PACIFIC: MARKET, BY END USER, 2023–2028 (USD MILLION)
                       TABLE 158 ASIA PACIFIC: MARKET, BY ENTERPRISE, 2018–2022 (USD MILLION)
                       TABLE 159 ASIA PACIFIC: MARKET, BY ENTERPRISE, 2023–2028 (USD MILLION)
                       TABLE 160 ASIA PACIFIC: MARKET, BY COUNTRY, 2018–2022 (USD MILLION)
                       TABLE 161 ASIA PACIFIC: MARKET, BY COUNTRY, 2023–2028 (USD MILLION)
             11.4.3 CHINA
                       11.4.3.1 Government support, focus on R&D, and investments from global players to drive market
                                   TABLE 162 CHINA: MANAGED DNS MARKET, BY DNS SERVICE, 2018–2022 (USD MILLION)
                                   TABLE 163 CHINA: MARKET, BY DNS SERVICE, 2023–2028 (USD MILLION)
                                   TABLE 164 CHINA: MARKET, BY DNS SERVER, 2018–2022 (USD MILLION)
                                   TABLE 165 CHINA: MARKET, BY DNS SERVER, 2023–2028 (USD MILLION)
                                   TABLE 166 CHINA: MARKET, BY CLOUD DEPLOYMENT, 2018–2022 (USD MILLION)
                                   TABLE 167 CHINA: MARKET, BY CLOUD DEPLOYMENT, 2023–2028 (USD MILLION)
                                   TABLE 168 CHINA: MARKET, BY END USER, 2018–2022 (USD MILLION)
                                   TABLE 169 CHINA: MARKET, BY END USER, 2023–2028 (USD MILLION)
             11.4.4 JAPAN
                       11.4.4.1 Increasing need for security enhancements and customer experience to boost demand for managed DNS solutions
                                   TABLE 170 JAPAN: MANAGED DNS MARKET, BY DNS SERVICE, 2018–2022 (USD MILLION)
                                   TABLE 171 JAPAN: MARKET, BY DNS SERVICE, 2023–2028 (USD MILLION)
                                   TABLE 172 JAPAN: MARKET, BY DNS SERVER, 2018–2022 (USD MILLION)
                                   TABLE 173 JAPAN: MARKET, BY DNS SERVER, 2023–2028 (USD MILLION)
                                   TABLE 174 JAPAN: MARKET, BY CLOUD DEPLOYMENT, 2018–2022 (USD MILLION)
                                   TABLE 175 JAPAN: MARKET, BY CLOUD DEPLOYMENT, 2023–2028 (USD MILLION)
                                   TABLE 176 JAPAN: MARKET, BY END USER, 2018–2022 (USD MILLION)
                                   TABLE 177 JAPAN: MARKET, BY END USER, 2023–2028 (USD MILLION)
             11.4.5 INDIA
                       11.4.5.1 Rapidly growing internet population, online services, and eCommerce sector to drive market
                                   TABLE 178 INDIA: MANAGED DNS MARKET, BY DNS SERVICE, 2018–2022 (USD MILLION)
                                   TABLE 179 INDIA: MARKET, BY DNS SERVICE, 2023–2028 (USD MILLION)
                                   TABLE 180 INDIA: MARKET, BY DNS SERVER, 2018–2022 (USD MILLION)
                                   TABLE 181 INDIA: MARKET, BY DNS SERVER, 2023–2028 (USD MILLION)
                                   TABLE 182 INDIA: MARKET, BY CLOUD DEPLOYMENT, 2018–2022 (USD MILLION)
                                   TABLE 183 INDIA: MARKET, BY CLOUD DEPLOYMENT, 2023–2028 (USD MILLION)
                                   TABLE 184 INDIA: MARKET, BY END USER, 2018–2022 (USD MILLION)
                                   TABLE 185 INDIA: MARKET, BY END USER, 2023–2028 (USD MILLION)
             11.4.6 AUSTRALIA & NEW ZEALAND (ANZ)
                       11.4.6.1 Growing infrastructure development and increasing network expansion of global companies to propel market
             11.4.7 SOUTH KOREA
                       11.4.7.1 Digitalization to increase workforce productivity, reduce CAPEX, and improve customer experience to drive market
             11.4.8 SOUTHEAST ASIA
                       11.4.8.1 Rising internet usage, technological innovation, and infrastructure development to propel market
             11.4.9 REST OF ASIA PACIFIC
     11.5 MIDDLE EAST & AFRICA 
             11.5.1 MIDDLE EAST & AFRICA: MARKET DRIVERS
             11.5.2 MIDDLE EAST & AFRICA: RECESSION IMPACT
                       TABLE 186 MIDDLE EAST & AFRICA: MANAGED DNS MARKET, BY DNS SERVICE, 2018–2022 (USD MILLION)
                       TABLE 187 MIDDLE EAST & AFRICA: MARKET, BY DNS SERVICE, 2023–2028 (USD MILLION)
                       TABLE 188 MIDDLE EAST & AFRICA: MARKET, BY DNS SERVER, 2018–2022 (USD MILLION)
                       TABLE 189 MIDDLE EAST & AFRICA: MARKET, BY DNS SERVER, 2023–2028 (USD MILLION)
                       TABLE 190 MIDDLE EAST & AFRICA: MARKET, BY CLOUD DEPLOYMENT, 2018–2022 (USD MILLION)
                       TABLE 191 MIDDLE EAST & AFRICA: MARKET, BY CLOUD DEPLOYMENT, 2023–2028 (USD MILLION)
                       TABLE 192 MIDDLE EAST & AFRICA: MARKET, BY END USER, 2018–2022 (USD MILLION)
                       TABLE 193 MIDDLE EAST & AFRICA: MARKET, BY END USER, 2023–2028 (USD MILLION)
                       TABLE 194 MIDDLE EAST & AFRICA: MARKET, BY ENTERPRISE, 2018–2022 (USD MILLION)
                       TABLE 195 MIDDLE EAST & AFRICA: MARKET, BY ENTERPRISE, 2023–2028 (USD MILLION)
                       TABLE 196 MIDDLE EAST & AFRICA: MARKET, BY COUNTRY, 2018–2022 (USD MILLION)
                       TABLE 197 MIDDLE EAST & AFRICA: MARKET, BY COUNTRY, 2023–2028 (USD MILLION)
             11.5.3 GCC COUNTRIES
                       11.5.3.1 UAE
                                   11.5.3.1.1 Rising internet usage, increased focus on cybersecurity, and widespread cloud service adoption to drive market
                       11.5.3.2 KSA
                                   11.5.3.2.1 Rising demand for digital services, growing adoption of cloud-based solutions, and government's focus on developing ICT sector to drive market
                       11.5.3.3 Rest of GCC Countries
                                   TABLE 198 GCC COUNTRIES: MANAGED DNS MARKET, BY DNS SERVICE, 2018–2022 (USD MILLION)
                                   TABLE 199 GCC COUNTRIES: MARKET, BY DNS SERVICE, 2023–2028 (USD MILLION)
                                   TABLE 200 GCC COUNTRIES: MARKET, BY DNS SERVER, 2018–2022 (USD MILLION)
                                   TABLE 201 GCC COUNTRIES: MARKET, BY DNS SERVER, 2023–2028 (USD MILLION)
                                   TABLE 202 GCC COUNTRIES: MARKET, BY CLOUD DEPLOYMENT, 2018–2022 (USD MILLION)
                                   TABLE 203 GCC COUNTRIES: MARKET, BY CLOUD DEPLOYMENT, 2023–2028 (USD MILLION)
                                   TABLE 204 GCC COUNTRIES: MARKET, BY END USER, 2018–2022 (USD MILLION)
                                   TABLE 205 GCC COUNTRIES: MARKET, BY END USER, 2023–2028 (USD MILLION)
                                   TABLE 206 GCC COUNTRIES: MARKET, BY COUNTRY, 2018–2022 (USD MILLION)
                                   TABLE 207 GCC COUNTRIES: MARKET, BY COUNTRY, 2023–2028 (USD MILLION)
             11.5.4 SOUTH AFRICA
                       11.5.4.1 Increasing reliance on online platforms, heightened cybersecurity concerns, and rapid cloud adoption to drive market
                                   TABLE 208 SOUTH AFRICA: MANAGED DNS MARKET, BY DNS SERVICE, 2018–2022 (USD MILLION)
                                   TABLE 209 SOUTH AFRICA: MARKET, BY DNS SERVICE, 2023–2028 (USD MILLION)
                                   TABLE 210 SOUTH AFRICA: MARKET, BY DNS SERVER, 2018–2022 (USD MILLION)
                                   TABLE 211 SOUTH AFRICA: MARKET, BY DNS SERVER, 2023–2028 (USD MILLION)
                                   TABLE 212 SOUTH AFRICA: MARKET, BY CLOUD DEPLOYMENT, 2018–2022 (USD MILLION)
                                   TABLE 213 SOUTH AFRICA: MARKET, BY CLOUD DEPLOYMENT, 2023–2028 (USD MILLION)
                                   TABLE 214 SOUTH AFRICA: MARKET, BY END USER, 2018–2022 (USD MILLION)
                                   TABLE 215 SOUTH AFRICA: MARKET, BY END USER, 2023–2028 (USD MILLION)
             11.5.5 REST OF MIDDLE EAST & AFRICA
     11.6 LATIN AMERICA 
             11.6.1 LATIN AMERICA: MARKET DRIVERS
             11.6.2 LATIN AMERICA: RECESSION IMPACT
                       TABLE 216 LATIN AMERICA: MANAGED DNS MARKET, BY DNS SERVICE, 2018–2022 (USD MILLION)
                       TABLE 217 LATIN AMERICA: MARKET, BY DNS SERVICE, 2023–2028 (USD MILLION)
                       TABLE 218 LATIN AMERICA: MARKET, BY DNS SERVER, 2018–2022 (USD MILLION)
                       TABLE 219 LATIN AMERICA: MARKET, BY DNS SERVER, 2023–2028 (USD MILLION)
                       TABLE 220 LATIN AMERICA: MARKET, BY CLOUD DEPLOYMENT, 2018–2022 (USD MILLION)
                       TABLE 221 LATIN AMERICA: MARKET, BY CLOUD DEPLOYMENT, 2023–2028 (USD MILLION)
                       TABLE 222 LATIN AMERICA: MARKET, BY END USER, 2018–2022 (USD MILLION)
                       TABLE 223 LATIN AMERICA: MARKET, BY END USER, 2023–2028 (USD MILLION)
                       TABLE 224 LATIN AMERICA: MARKET, BY ENTERPRISE, 2018–2022 (USD MILLION)
                       TABLE 225 LATIN AMERICA: MARKET, BY ENTERPRISE, 2023–2028 (USD MILLION)
                       TABLE 226 LATIN AMERICA: MARKET, BY COUNTRY, 2018–2022 (USD MILLION)
                       TABLE 227 LATIN AMERICA: MARKET, BY COUNTRY, 2023–2028 (USD MILLION)
             11.6.3 BRAZIL
                       11.6.3.1 Rising smishing attacks using OTT platform, competitive landscape, and privacy concerns to drive market
                                   TABLE 228 BRAZIL: MANAGED DNS MARKET, BY DNS SERVICE, 2018–2022 (USD MILLION)
                                   TABLE 229 BRAZIL: MARKET, BY DNS SERVICE, 2023–2028 (USD MILLION)
                                   TABLE 230 BRAZIL: MARKET, BY DNS SERVER, 2018–2022 (USD MILLION)
                                   TABLE 231 BRAZIL: MARKET, BY DNS SERVER, 2023–2028 (USD MILLION)
                                   TABLE 232 BRAZIL: MARKET, BY CLOUD DEPLOYMENT, 2018–2022 (USD MILLION)
                                   TABLE 233 BRAZIL: MARKET, BY CLOUD DEPLOYMENT, 2023–2028 (USD MILLION)
                                   TABLE 234 BRAZIL: MARKET, BY END USER, 2018–2022 (USD MILLION)
                                   TABLE 235 BRAZIL: MARKET, BY END USER, 2023–2028 (USD MILLION)
             11.6.4 MEXICO
                       11.6.4.1 Rising government investments in enhanced DNS solutions and availability of smartphones at lower prices to propel market
                                   TABLE 236 MEXICO: MANAGED DNS MARKET, BY DNS SERVICE, 2018–2022 (USD MILLION)
                                   TABLE 237 MEXICO: MARKET, BY DNS SERVICE, 2023–2028 (USD MILLION)
                                   TABLE 238 MEXICO: MARKET, BY DNS SERVER, 2018–2022 (USD MILLION)
                                   TABLE 239 MEXICO: MARKET, BY DNS SERVER, 2023–2028 (USD MILLION)
                                   TABLE 240 MEXICO: MARKET, BY CLOUD DEPLOYMENT, 2018–2022 (USD MILLION)
                                   TABLE 241 MEXICO: MARKET, BY CLOUD DEPLOYMENT, 2023–2028 (USD MILLION)
                                   TABLE 242 MEXICO: MARKET, BY END USER, 2018–2022 (USD MILLION)
                                   TABLE 243 MEXICO: MARKET, BY END USER, 2023–2028 (USD MILLION)
             11.6.5 REST OF LATIN AMERICA
 
12 COMPETITIVE LANDSCAPE (Page No. - 176)
     12.1 INTRODUCTION 
     12.2 KEY PLAYER STRATEGIES/RIGHT TO WIN 
             12.2.1 OVERVIEW OF STRATEGIES ADOPTED BY KEY MARKET VENDORS
     12.3 REVENUE ANALYSIS 
               FIGURE 34 TOP 4 PLAYERS TO DOMINATE MARKET IN LAST 3 YEARS
     12.4 MARKET SHARE ANALYSIS 
               FIGURE 35 SHARE OF LEADING COMPANIES IN MARKET
               TABLE 244 MANAGED DNS MARKET: DEGREE OF COMPETITION
     12.5 COMPANY EVALUATION MATRIX 
             12.5.1 STARS
             12.5.2 EMERGING LEADERS
             12.5.3 PERVASIVE PLAYERS
             12.5.4 PARTICIPANTS
                       FIGURE 36 GLOBAL MARKET: COMPANY EVALUATION MATRIX, 2022
             12.5.5 COMPANY FOOTPRINT
                       TABLE 245 TOP THREE VERTICALS FOOTPRINT
                       TABLE 246 REGION FOOTPRINT
     12.6 START-UP/SME EVALUATION MATRIX 
             12.6.1 PROGRESSIVE COMPANIES
             12.6.2 RESPONSIVE COMPANIES
             12.6.3 DYNAMIC COMPANIES
             12.6.4 STARTING BLOCKS
                       FIGURE 37 GLOBAL MARKET, START-UP/SME EVALUATION MATRIX, 2022
             12.6.5 COMPETITIVE BENCHMARKING
                       TABLE 247 MARKET: DETAILED LIST OF KEY START-UPS/SMES
                       TABLE 248 MARKET: COMPETITIVE BENCHMARKING OF KEY START-UPS/SMES
     12.7 RANKING OF KEY PLAYERS IN MARKET, 2022 
               FIGURE 38 RANKING OF KEY PLAYERS, 2022
     12.8 COMPETITIVE SCENARIO 
             12.8.1 PRODUCT LAUNCHES
                       TABLE 249 MARKET: PRODUCT LAUNCHES, 2020–2023
             12.8.2 DEALS
                       TABLE 250 MANAGED DNS MARKET: DEALS, 2020–2023
     12.9 MANAGED DNS PRODUCT BENCHMARKING 
             12.9.1 PROMINENT MANAGED DNS SOLUTIONS
                       TABLE 251 COMPARATIVE ANALYSIS OF PROMINENT MANAGED DNS SOLUTIONS
     12.10 VALUATION AND FINANCIAL METRICS OF KEY MANAGED DNS VENDORS 
               FIGURE 39 VALUATION AND FINANCIAL METRICS OF KEY MANAGED DNS VENDORS
 
13 COMPANY PROFILES (Page No. - 190)
     13.1 MAJOR PLAYERS 
(Business Overview, Products/Solutions/Services offered, Recent Developments, MnM View)*
             13.1.1 AWS
                       TABLE 252 AWS: COMPANY OVERVIEW
                       FIGURE 40 AWS: COMPANY SNAPSHOT
                       TABLE 253 AWS: PRODUCTS/SOLUTIONS/SERVICES OFFERED
             13.1.2 CLOUDFLARE
                       TABLE 254 CLOUDFLARE: COMPANY OVERVIEW
                       FIGURE 41 CLOUDFLARE: COMPANY SNAPSHOT
                       TABLE 255 CLOUDFLARE: PRODUCTS/SOLUTIONS/SERVICES OFFERED
                       TABLE 256 CLOUDFLARE: PRODUCT LAUNCHES AND ENHANCEMENTS
                       TABLE 257 CLOUDFLARE: DEALS
             13.1.3 DNS MADE EASY
                       TABLE 258 DNS MADE EASY: COMPANY OVERVIEW
                       TABLE 259 DNS MADE EASY: PRODUCTS/SOLUTIONS/SERVICES OFFERED
             13.1.4 GODADDY
                       TABLE 260 GODADDY: COMPANY OVERVIEW
                       FIGURE 42 GODADDY: COMPANY SNAPSHOT
                       TABLE 261 GODADDY: PRODUCTS/SOLUTIONS/SERVICES OFFERED
                       TABLE 262 GODADDY: PRODUCT LAUNCHES AND ENHANCEMENTS
             13.1.5 VERCARA
                       TABLE 263 VERCARA: COMPANY OVERVIEW
                       TABLE 264 VERCARA: PRODUCTS/SOLUTIONS/SERVICES OFFERED
                       TABLE 265 VERCARA: PRODUCT LAUNCHES AND ENHANCEMENTS
                       TABLE 266 VERCARA: DEALS
                       TABLE 267 VERCARA: OTHERS
             13.1.6 AKAMAI
                       TABLE 268 AKAMAI: COMPANY OVERVIEW
                       FIGURE 43 AKAMAI: COMPANY SNAPSHOT
                       TABLE 269 AKAMAI: PRODUCTS/SOLUTIONS/SERVICES OFFERED
                       TABLE 270 AKAMAI: PRODUCT LAUNCHES AND ENHANCEMENTS
             13.1.7 CDNETWORKS
                       TABLE 271 CDNETWORKS: COMPANY OVERVIEW
                       TABLE 272 CDNETWORKS: PRODUCTS/SOLUTIONS/SERVICES OFFERED
                       TABLE 273 CDNETWORKS: PRODUCT LAUNCHES AND ENHANCEMENTS
             13.1.8 MICROSOFT
                       TABLE 274 MICROSOFT: COMPANY OVERVIEW
                       FIGURE 44 MICROSOFT: COMPANY SNAPSHOT
                       TABLE 275 MICROSOFT: PRODUCTS/SOLUTIONS/SERVICES OFFERED
             13.1.9 NS1
                       TABLE 276 NS1: COMPANY OVERVIEW
                       TABLE 277 NS1: PRODUCTS/SOLUTIONS/SERVICES OFFERED
                       TABLE 278 NS1: PRODUCT LAUNCHES AND ENHANCEMENTS
                       TABLE 279 NS1: DEALS
             13.1.10 ORACLE
                       TABLE 280 ORACLE: COMPANY OVERVIEW
                       FIGURE 45 ORACLE: COMPANY SNAPSHOT
                       TABLE 281 ORACLE: PRODUCTS/SOLUTIONS/SERVICES OFFERED
     13.2 MAJOR PLAYERS 
             13.2.1 CLOUDFLOORDNS
             13.2.2 GOOGLE
             13.2.3 F5
             13.2.4 NO-IP
             13.2.5 NETRIPLEX
             13.2.6 EASYDNS
*Details on Business Overview, Products/Solutions/Services offered, Recent Developments, MnM View might not be captured in case of unlisted companies.
     13.3 OTHER PLAYERS 
             13.3.1 CLOUDNS
             13.3.2 DNSIMPLE
             13.3.3 EURODNS
             13.3.4 GRANSY
             13.3.5 NUSEC
             13.3.6 BLUECAT
             13.3.7 RAGE 4
             13.3.8 STACKPATH
             13.3.9 TOTAL UPTIME
             13.3.10 POWERDNS
 
14 ADJACENT/RELATED MARKETS (Page No. - 232)
     14.1 INTRODUCTION TO ADJACENT MARKETS 
               TABLE 282 ADJACENT MARKETS AND FORECASTS
     14.2 LIMITATIONS 
     14.3 DDI MARKET 
               TABLE 283 DDI MARKET, BY COMPONENT, 2015–2020 (USD MILLION)
               TABLE 284 DDI MARKET, BY COMPONENT, 2020–2026 (USD MILLION)
               TABLE 285 DDI MARKET, BY APPLICATION, 2015–2020 (USD MILLION)
               TABLE 286 DDI MARKET, BY APPLICATION, 2020–2026 (USD MILLION)
               TABLE 287 DDI MARKET, BY DEPLOYMENT MODE, 2015–2020 (USD MILLION)
               TABLE 288 DDI MARKET, BY DEPLOYMENT MODE, 2020–2026 (USD MILLION)
               TABLE 289 DDI MARKET, BY ORGANIZATION SIZE, 2015–2020 (USD MILLION)
               TABLE 290 DDI MARKET, BY ORGANIZATION SIZE, 2020–2026 (USD MILLION)
               TABLE 291 DDI MARKET, BY VERTICAL, 2015–2020 (USD MILLION)
               TABLE 292 DDI MARKET, BY VERTICAL, 2020–2026 (USD MILLION)
               TABLE 293 DDI MARKET, BY REGION, 2015–2020 (USD MILLION)
               TABLE 294 DDI MARKET, BY REGION, 2020–2026 (USD MILLION)
     14.4 DDOS PROTECTION AND MITIGATION SECURITY MARKET 
               TABLE 295 DDOS PROTECTION AND MITIGATION SECURITY MARKET, BY COMPONENT, 2016–2021 (USD MILLION)
               TABLE 296 DDOS PROTECTION AND MITIGATION SECURITY MARKET, BY COMPONENT, 2022–2027 (USD MILLION)
               TABLE 297 DDOS PROTECTION AND MITIGATION SECURITY MARKET, BY APPLICATION AREA, 2016–2021 (USD MILLION)
               TABLE 298 DDOS PROTECTION AND MITIGATION SECURITY MARKET, BY APPLICATION AREA, 2022–2027 (USD MILLION)
               TABLE 299 DDOS PROTECTION AND MITIGATION SECURITY MARKET, BY DEPLOYMENT MODE, 2016–2021 (USD MILLION)
               TABLE 300 DDOS PROTECTION AND MITIGATION SECURITY MARKET, BY DEPLOYMENT MODE, 2022–2027 (USD MILLION)
               TABLE 301 DDOS PROTECTION AND MITIGATION SECURITY MARKET, BY ORGANIZATION SIZE, 2016–2021 (USD MILLION)
               TABLE 302 DDOS PROTECTION AND MITIGATION SECURITY MARKET, BY ORGANIZATION SIZE, 2022–2027 (USD MILLION)
               TABLE 303 DDOS PROTECTION AND MITIGATION SECURITY MARKET, BY VERTICAL, 2016–2021 (USD MILLION)
               TABLE 304 DDOS PROTECTION AND MITIGATION SECURITY MARKET, BY VERTICAL, 2022–2027 (USD MILLION)
               TABLE 305 DDOS PROTECTION AND MITIGATION SECURITY MARKET, BY REGION, 2016–2021 (USD MILLION)
               TABLE 306 DDOS PROTECTION AND MITIGATION SECURITY MARKET, BY REGION, 2022–2027 (USD MILLION)
 
15 APPENDIX (Page No. - 242)
     15.1 DISCUSSION GUIDE 
     15.2 KNOWLEDGESTORE: MARKETSANDMARKETS’ SUBSCRIPTION PORTAL 
     15.3 CUSTOMIZATION OPTIONS 
     15.4 RELATED REPORTS 
     15.5 AUTHOR DETAILS 

The study involved four major activities in estimating the current size of the global managed DNS market. Exhaustive secondary research was done to collect information on the market, peer market, and parent market. The next step was to validate these findings, assumptions, and sizing with industry experts across the value chain through primary research. Both top-down and bottom-up approaches were employed to estimate the total managed DNS market size. After that, the market breakup and data triangulation techniques were used to estimate the market size of segments and subsegments.

Secondary Research

In the secondary research process, various secondary sources, such as Bloomberg and BusinessWeek, have been referred to identify and collect information for this study. The secondary sources included annual reports, press releases, and investor presentations of companies; white papers; and journals, such as Linux Journal and Container Journal, and articles from recognized authors, directories, and databases.

Primary Research

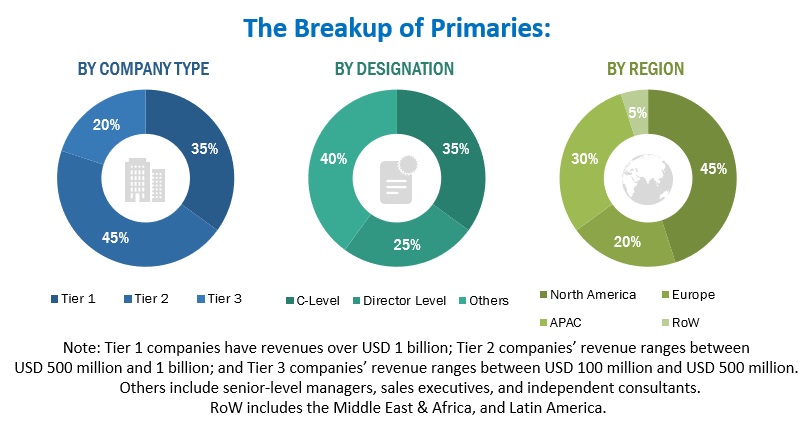
Various primary sources from both the supply and demand sides were interviewed to obtain qualitative and quantitative information for this report. The primary sources from the supply side included industry experts, such as Chief Executive Officers (CEOs), Chief Marketing Officers (CMO), Vice Presidents (VPs), Managing Directors (MDs), technology and innovation directors, and related key executives from various key companies and organizations operating in the managed DNS market along with the associated service providers, and system integrators operating in the targeted regions. All possible parameters that affect the market covered in this research study have been accounted for, viewed in extensive detail, verified through primary research, and analyzed to get the final quantitative and qualitative data. Following is the breakup of primary respondents.
Managed Domain Name System (DNS) Market Size, and Share

To know about the assumptions considered for the study, download the pdf brochure

Company Name

Designation

GoDaddy

Senior Manager

BlueCat

VP

Cloudflare

Business Executive

Market Size Estimation

For making market estimates and forecasting the managed DNS market, and other dependent submarkets, the top-down and bottom-up approaches were used. The bottom-up procedure was used to arrive at the overall market size of the global managed DNS market using key companies’ revenue and their offerings in the market. The research methodology used to estimate the market size includes the following:

  • The key players in the Managed DNS market have been identified through extensive secondary research.
  • The market size, in terms of value, has been determined through primary and secondary research processes.
  • All percentage shares, splits, and breakups have been determined using secondary sources and verified through primary sources.

Managed DNS market Size: Bottom-Up Approach

Managed Domain Name System (DNS) Market Size, and Share

To know about the assumptions considered for the study, Request for Free Sample Report

Managed DNS market Size: Top-Down Approach

Managed Domain Name System (DNS) Market Size, and Share

Data Triangulation

With data triangulation and validation through primary interviews, the exact value of the overall parent market size was determined and confirmed using this study. The overall market size was then used in the top-down procedure to estimate the size of other individual markets via percentage splits of the market segmentation.


Market Definition

Managed DNS refers to the storage of DNS records on an authoritative DNS server hosted by DNS service providers. Enterprises and service providers can use managed DNS service providers to access websites and email services, as well as scale and support businesses' DNS infrastructure. These services include primary and secondary DNS servers, DNS failover, GeoDNS, Domain Name System Security Extensions (DNSSEC), Distributed Denial of Service (DDoS) protection, load balancing, and 99.999% service availability.

Key Stakeholders

  • Managed DNS service providers
  • Web hosting providers
  • DNS security providers
  • Domain name registrars
  • Mobile Network Operators (MNOs)
  • Independent Software Vendors (ISVs)
  • Communication Service Providers (CSPs)
  • Content Delivery Network (CDN) Providers
  • System Integrators (SIs)
  • Resellers
  • Value-added Resellers (VARs)
  • Managed Service Providers (MSPs)
  • Compliance regulatory authorities
  • Government authorities
  • Investment firms
  • Cloud service providers
  • Technology vendors

Report Objectives

  • To determine, segment, and forecast the global managed DNS market based on DNS service, DNS server, cloud deployment, end user, enterprise, and region in terms of value.
  • To forecast the size of the market segments to five main regions: North America, Europe, Asia Pacific, Middle East & Africa, and Latin America.
  • To provide detailed information about the major factors (drivers, opportunities, threats, and challenges) influencing the growth of the market.
  • To study the complete value chain and related industry segments and perform a value chain analysis of the market landscape.
  • To strategically analyze the macro and micro markets to individual growth trends, prospects, and contributions to the total market.
  • To analyze the industry trends, pricing data, patents, and innovations related to the market.
  • To analyze the opportunities for stakeholders by identifying the high-growth segments of the market.
  • To profile the key players in the market and comprehensively analyze their market share/ranking and core competencies.
  • To track and analyze competitive developments, such as mergers & acquisitions, product launches & developments, partnerships, agreements, collaborations, business expansions, and Research & Development (R&D) activities.

Available Customizations

With the given market data, MarketsandMarkets offers customizations as per the company’s specific needs. The following customization options are available for the report:

Company Information

  • Detailed analysis and profiling of an additional two market players
Custom Market Research Services

We will customize the research for you, in case the report listed above does not meet with your exact requirements. Our custom research will comprehensively cover the business information you require to help you arrive at strategic and profitable business decisions.

Request Customization
Report Code
TC 6076
Published ON
Dec, 2023
Choose License Type
BUY NOW
  • SHARE
X
Request Customization
Speak to Analyst
Speak to Analyst
OR FACE-TO-FACE MEETING
PERSONALIZE THIS RESEARCH
  • Triangulate with your Own Data
  • Get Data as per your Format and Definition
  • Gain a Deeper Dive on a Specific Application, Geography, Customer or Competitor
  • Any level of Personalization
REQUEST A FREE CUSTOMIZATION
LET US HELP YOU!
  • What are the Known and Unknown Adjacencies Impacting the Managed Domain Name System (DNS) Market
  • What will your New Revenue Sources be?
  • Who will be your Top Customer; what will make them switch?
  • Defend your Market Share or Win Competitors
  • Get a Scorecard for Target Partners
CUSTOMIZED WORKSHOP REQUEST
+1-888-600-6441
  • Call Us
  • +1-888-600-6441 (Corporate office hours)
  • +1-888-600-6441 (US/Can toll free)
  • +44-800-368-9399 (UK office hours)
CONNECT WITH US
ABOUT TRUST ONLINE
©2024 MarketsandMarkets Research Private Ltd. All rights reserved
DMCA.com Protection Status Website Feedback