Email Encryption Market

Email Encryption Market by Offering (Solution and Services), Deployment (On-premises and cloud), Vertical (BFSI, healthcare, government, IT & ITeS, telecommunications, manufacturing, retail & eCommerce) and Region - Global Forecast to 2028

Report Code: TC 3895 Oct, 2023, by marketsandmarkets.com

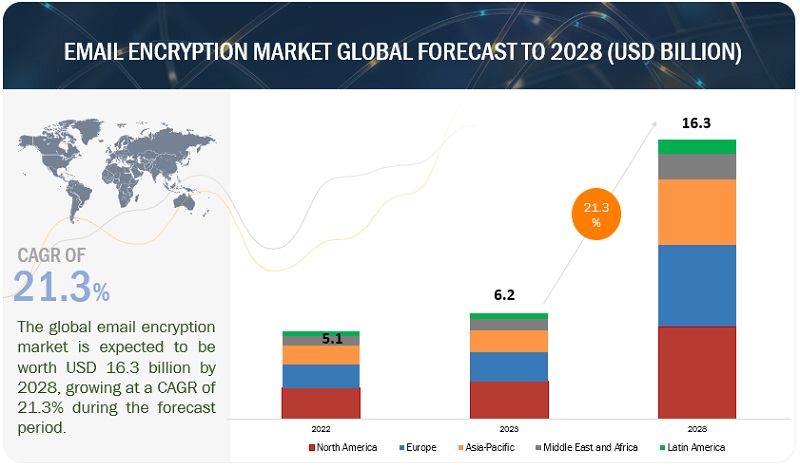
[287 Pages Report] The global Email Encryption market size is projected to grow from USD 6.2 billion in 2023 to USD 16.3 billion by 2028 at a CAGR of 21.3% during the forecast period.

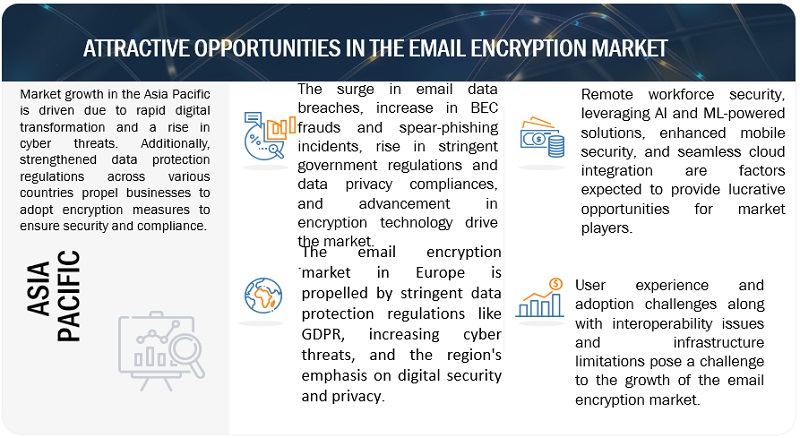
Various pivotal elements influence the Email Encryption market’s expansion. One of the primary drivers is the noticeable surge in email data breaches, which has raised alarm bells for businesses and individuals alike. The security landscape is further complicated by a rising tide of BEC frauds and spear-phishing attacks, tactics employed by cybercriminals to deceive recipients into revealing sensitive information or transferring funds. On the regulatory front, governments across the globe are tightening their data protection frameworks and imposing stringent mandates to ensure that personal and business data remains confidential and secure. This has pressured firms to adopt robust security measures, further boosting the demand for advanced encryption solutions. Furthermore, there is a constant stream of innovations and advancements in encryption techniques, ensuring that communications remain ahead of potential threats. This continuous evolution and refinement in methodologies are integral to the sustained growth of the email encryption market.

The Email Encryption market benefits from opportunities driven by remote workforce security, leveraging AI and ML-powered solutions, enhanced mobile security, and seamless cloud integration. These factors create favorable conditions for the market’s growth, with organizations seeking advanced solutions to safeguard their systems and valuable data, further contributing to the rising demand for Email Encryption solutions.
Email Encryption Market

To know about the assumptions considered for the study, Request for Free Sample Report
Email Encryption Market

To know about the assumptions considered for the study, download the pdf brochure

The impact of a recession on the email encryption market is multifaceted. Generally, recessions tend to reduce overall IT spending as businesses cut costs and delay investments. However, the email encryption market shows resilience or even growth during economic downturns for a few reasons. Firstly, as companies move to trim costs, there’s an increased emphasis on digital operations and remote work, heightening the need for secure communication channels and emphasizing the importance of email encryption. Secondly, cybercriminals often exploit economic vulnerabilities and uncertainties to increase their malicious activities, pushing companies to prioritize cybersecurity measures, including email encryption, to safeguard their sensitive data. Furthermore, regulatory compliance requirements related to data protection don’t wane during recessions, meaning businesses must maintain or bolster their encryption standards irrespective of economic conditions. Thus, while a downturn generally poses challenges for most sectors, the email encryption market witnesses sustained demand due to the essential nature of cybersecurity in an increasingly digital business landscape.

COVID-19 Impact

The COVID-19 pandemic pronounced affected the email encryption market, vastly amplifying its significance. As the pandemic forced businesses and institutions to transition swiftly to remote working and digital operations, the volume of email communication surged exponentially. This rapid shift highlighted the critical need for secure communication channels and presented opportunities for cybercriminals to exploit the vulnerabilities of hastily implemented digital setups. There was a noticeable uptick in phishing attempts and cyber-attacks, leveraging the pandemic’s theme to deceive users. As organizations grappled with these challenges, the demand for robust email encryption solutions soared, seen as a frontline defense against these threats. Furthermore, with heightened data protection and privacy awareness in a remote work environment, businesses were more inclined to invest in cybersecurity tools, positioning email encryption as an essential component. Thus, the pandemic underscored the indispensability of email encryption in an era of unpredictability and accelerated digital transformation.

Email Encryption Market Dynamics

Driver: Advancements in Encryption Technology

The email encryption market is witnessing robust growth fueled by recent advances in encryption technology. Key developments in recent years have fortified email security, with quantum physics introducing accelerated encryption for various devices. Concurrently, research in cryptography is paving the way for more secure telecom networks, addressing quantum bit decay in fiber-optic cables.

Furthermore, some noteworthy strides in the sector include the rise of biometric encryption, eliminating the heavy dependence on passwords, and the consistent role of VPNs in augmenting email security.

Restraint: Cost Constraints Associated with Email Encryption Solutions

A primary restraint in adopting email encryption solutions among businesses is the significant financial commitment involved. Although these tools are vital for preventing data breaches, they considerably inflate operational expenses. The root of this increase is the expanded IT infrastructure needed for secure email communication.

Typically, the cost structure for such solutions is based on a monthly fee per user, ranging from USD 4 to USD 10. This price could surge based on the size of the encrypted files. While free encryption tools exist, they often lack the sophistication required for adequate data protection.

Furthermore, for budget-conscious SMEs, the financial implications are particularly pronounced. Beyond the upfront costs, recurrent expenditures such as licensing fees, software maintenance, and technical support amplify the overall financial load. Thus, integrating these solutions with pre-existing IT systems introduces another dimension of complexity and potential costs.

Opportunity:Seamless Cloud Integration

The increasing adoption of cloud platforms like Microsoft 365 and Google Workspace has emphasized the need for secure email communication. As organizations blend remote and on-site work, there’s a growing demand for email encryption solutions that integrate effortlessly with cloud services and traditional on-premises systems. This transition to hybrid models and cloud integration is driving the demand in the email encryption market.

Challenge:Interoperability Issues and Infrastructure Limitations

In the email encryption market, one of the predominant challenges is interoperability and infrastructure limitations. Different organizations using a variety of encryption solutions lead to compatibility roadblocks, especially given the absence of a universal encryption standard. Additionally, smaller entities, in particular, face the dual challenge of managing the costs and complexities associated with setting up dedicated on-premises encryption infrastructures. Therefore, when some turn to smaller cloud providers as an alternative, they often encounter disruptions in their workflow. This amalgamation of challenges underscores the complexities organizations, especially the smaller ones, must navigate to implement effective email encryption.

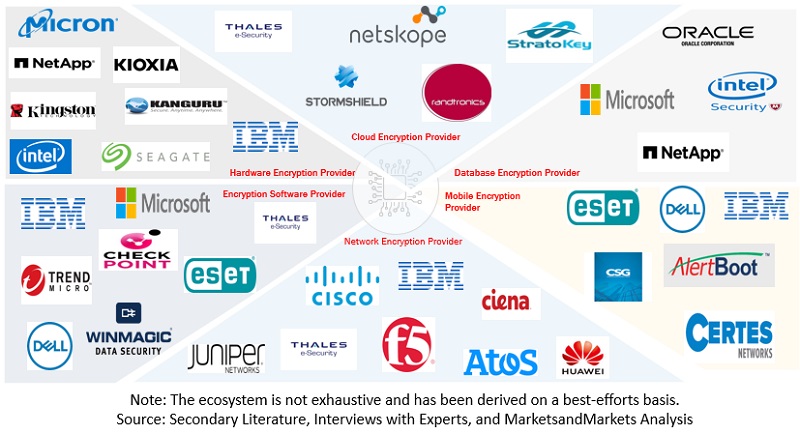
Email Encryption Market Ecosystem
Email Encryption Market

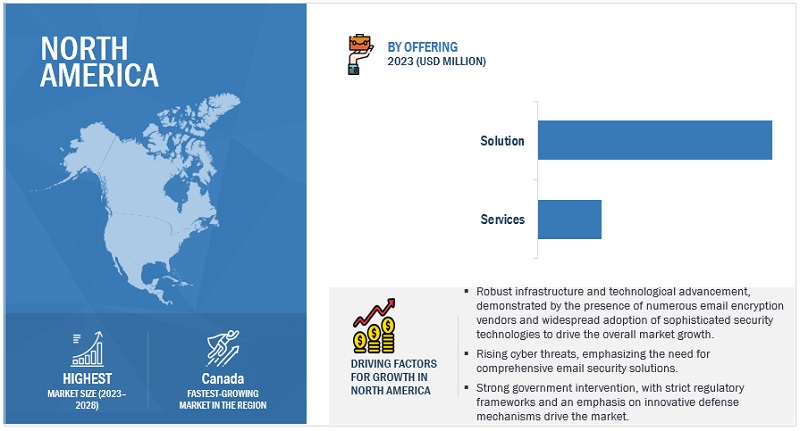
By region, North America accounts for the highest market size during the forecast period.

North America dominates the email encryption market primarily because of its advanced technological infrastructure, stringent regulatory compliance requirements, and heightened awareness of cybersecurity threats. The region is home to many global corporations, which necessitates adopting secure communication methods to protect sensitive data. Furthermore, regulations such as the Health Insurance Portability and Accountability Act (HIPAA) and the General Data Protection Regulation (GDPR) compel businesses to implement robust data protection measures, further driving the demand for email encryption solutions. Moreover, with a significant presence of leading email encryption vendors, North America enjoys a proactive approach to cybersecurity, fostering a larger market size for email encryption.  
Email Encryption Market Size, and Share

Key Market Players

Some of the well-established and key market players in the Email Encryption market include Fortinet (US), BAE Systems (UK), Mimecast (UK), Cisco (US), Proofpoint (US), Zoho (India), Broadcom (US), OpenText (Canada), Barracuda Networks (US), Thales (France), HPE (US), Entrust (US), Fortra (US), Sophos (UK), Trend Micro (Japan), Seclore (US), Egress Software (UK), Echoworx (Canada), LuxSci (US), Neocertified (US), SSH Communication (Finland), Retarus (Germany), Paubox (US), PreVeil (US), Sealit Technologies (UK), SendSafely (US), and Zivver (Netherlands).

Get online access to the report on the World's First Market Intelligence Cloud

  • Easy to Download Historical Data & Forecast Numbers
  • Company Analysis Dashboard for high growth potential opportunities
  • Research Analyst Access for customization & queries
  • Competitor Analysis with Interactive dashboard
  • Latest News, Updates & Trend analysis
Request Sample

Scope of the Report

Report Metrics

Details

Market size available for years

  • 2017-2028

Base year considered

  • 2022

Forecast period

  • 2023–2028

Forecast units

  • Value (USD Million/Billion)

Segments Covered

  • Offering, Deployment, Verticals, and Regions

Geographies covered

  • North America, Europe, Asia Pacific, Middle East and Africa, and Latin America

Companies covered

  • Major vendors in the global Email Encryption market include Fortinet (US), BAE Systems (UK), Mimecast (UK), Cisco (US), Proofpoint (US), Zoho (India), Broadcom (US), OpenText (Canada), Barracuda Networks (US), Thales (France), HPE (US), Entrust (US), Fortra (US), Sophos (UK), Trend Micro (Japan), Seclore (US), Egress Software (UK), Echoworx (Canada), LuxSci (US), Neocertified (US), SSH Communication (Finland), Retarus (Germany), Paubox (US), PreVeil (US), Sealit Technologies (UK), SendSafely (US), and Zivver (Netherlands).   

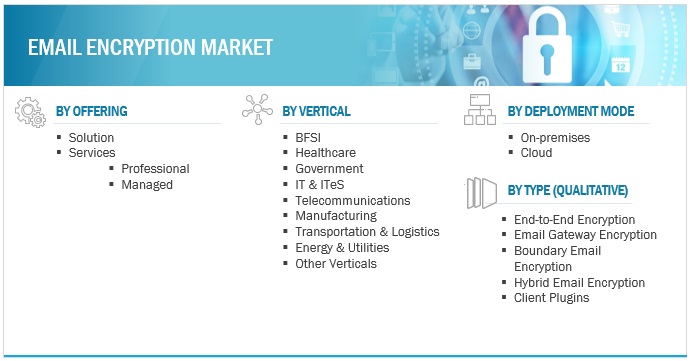
The study categorizes the Email Encryption market by offering, deployment, verticals, and regions.
Email Encryption Market Size, and Share

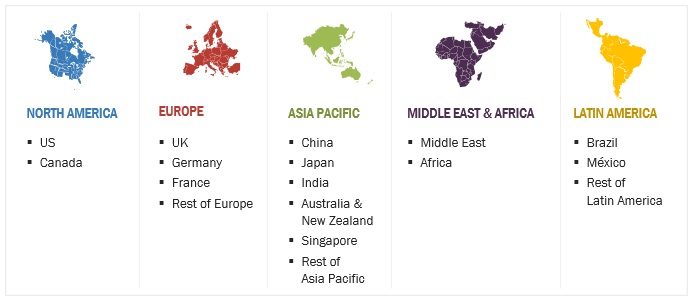
By Region:

Email Encryption Market Size, and Share

Recent Developments

  • In July 2023, Telefónica Tech (Spain) partnered with Proofpoint to introduce ‘Clean Email Business’ in Spain, enhancing email security for medium-sized companies. The service incorporates advanced features such as spam filtering, malicious attachment and URL analysis, and protection against BEC attacks. The initiative is geared towards ensuring security, regulatory compliance, and uninterrupted business continuity for its users.     
  • In April 2023, Barracuda Networks, Inc. forged a strategic distribution agreement with Ingram Micro to bolster its presence in the Gulf region. Under this agreement, Ingram Micro will distribute Barracuda’s comprehensive cybersecurity solutions, covering email, applications, cloud, network, and data protection. This partnership aims to provide resellers across the UAE, Kuwait, Qatar, Oman, Bahrain, Yemen, and Pakistan with access to Barracuda’s cutting-edge cybersecurity offerings.
  • In March 2023, proteanTecs (Israel) and BAE Systems partnered to enable a zero-trust supply chain for defense and critical infrastructure applications. With this partnership, proteanTecs’ advanced deep data analytics technology will be leveraged by BAE Systems to ensure product authentication and supply chain integrity, thereby potentially strengthening email encryption by ensuring the hardware components are authentic and secure.
  • In January 2023, Zoho Corporation’s Bigin CRM introduced an ‘Email-In’ topping feature that automates the process of mapping emails sent to different aliases within an organization to the relevant customer records, streamlining email organization and implicitly enhancing security. In addition, the ‘File Cabinet’ topping allows customers to manage documents through unique, secure links, bolstering data protection and suggesting a move towards improved email content security.     
  • In August 2022, Mimecast introduced the Mimecast X1 Platform, an advanced email and collaboration security solution designed to safeguard business communications in hybrid work environments. It uses AI and ML to detect threats, offers scalable cloud-delivered security, and integrates seamlessly with other security systems through its extensive API ecosystem.

Frequently Asked Questions (FAQ):

To speak to our analyst for a discussion on the above findings, click Speak to Analyst

TABLE OF CONTENTS
 
1 INTRODUCTION (Page No. - 29)
    1.1 STUDY OBJECTIVES 
    1.2 MARKET DEFINITION 
           1.2.1 INCLUSIONS & EXCLUSIONS
    1.3 STUDY SCOPE 
           1.3.1 MARKET SEGMENTATION
           1.3.2 REGIONS COVERED
    1.4 YEARS CONSIDERED 
    1.5 CURRENCY CONSIDERED 
           TABLE 1 USD EXCHANGE RATES, 2017–2021
    1.6 STAKEHOLDERS 
    1.7 SUMMARY OF CHANGES 
 
2 RESEARCH METHODOLOGY (Page No. - 34)
    2.1 RESEARCH DATA 
           FIGURE 1 RESEARCH DESIGN
           2.1.1 SECONDARY DATA
           2.1.2 PRIMARY DATA
                    2.1.2.1 Breakup of primaries
                    2.1.2.2 Key industry insights
    2.2 DATA TRIANGULATION 
           FIGURE 2 DATA TRIANGULATION
    2.3 EMAIL ENCRYPTION MARKET SIZE ESTIMATION 
           2.3.1 TOP-DOWN APPROACH
                    FIGURE 3 MARKET SIZE ESTIMATION – APPROACH 1 (SUPPLY-SIDE): REVENUE FROM SOLUTIONS AND SERVICES OFFERED BY EMAIL ENCRYPTION VENDORS
                    FIGURE 4 MARKET SIZE ESTIMATION: APPROACH 1 (SUPPLY-SIDE) ANALYSIS
                    FIGURE 5 MARKET SIZE ESTIMATION: RESEARCH FLOW
           2.3.2 BOTTOM-UP APPROACH
                    FIGURE 6 EMAIL ENCRYPTION MARKET SIZE ESTIMATION – APPROACH 2, BOTTOM-UP (DEMAND-SIDE): EMAIL ENCRYPTION SERVICES
    2.4 MARKET FORECAST 
           TABLE 2 FACTOR ANALYSIS
    2.5 COMPANY EVALUATION MATRIX FOR KEY PLAYERS 
           FIGURE 7 COMPANY EVALUATION MATRIX FOR KEY PLAYERS: CRITERIA WEIGHTAGE
    2.6 COMPANY EVALUATION MATRIX FOR STARTUPS/SMES 
           FIGURE 8 COMPANY EVALUATION MATRIX FOR STARTUPS/SMES: CRITERIA WEIGHTAGE
    2.7 RESEARCH ASSUMPTIONS 
    2.8 LIMITATIONS AND RISK ASSESSMENT 
 
3 EXECUTIVE SUMMARY (Page No. - 47)
    FIGURE 9 EMAIL ENCRYPTION MARKET TO WITNESS SIGNIFICANT GROWTH DURING FORECAST PERIOD 
    FIGURE 10 MARKET: MAJOR SUBSEGMENTS 
    FIGURE 11 MARKET: REGIONAL SNAPSHOT 
 
4 PREMIUM INSIGHTS (Page No. - 51)
    4.1 ATTRACTIVE OPPORTUNITIES FOR PLAYERS IN EMAIL ENCRYPTION MARKET 
           FIGURE 12 SURGE IN DATA BREACHES, REGULATORY STRINGENCY, AND ENCRYPTION ADVANCEMENTS TO BOOST MARKET GROWTH
    4.2 MARKET, BY OFFERING 
           FIGURE 13 SOLUTIONS SEGMENT TO ACCOUNT FOR LARGER MARKET BY 2028
    4.3 MARKET, BY DEPLOYMENT MODE 
           FIGURE 14 ON-PREMISES SEGMENT TO ACCOUNT FOR LARGER MARKET DURING FORECAST PERIOD
    4.4 MARKET, BY VERTICAL 
           FIGURE 15 BFSI SEGMENT TO ACCOUNT FOR LARGEST MARKET BY 2028
    4.5 MARKET, BY SERVICE 
           FIGURE 16 PROFESSIONAL SEGMENT TO ACCOUNT FOR LARGER SHARE IN 2023
    4.6 MARKET INVESTMENT SCENARIO 
           FIGURE 17 ASIA PACIFIC TO EMERGE AS BEST MARKET FOR INVESTMENTS IN NEXT FIVE YEARS
 
5 MARKET OVERVIEW AND INDUSTRY TRENDS (Page No. - 54)
    5.1 INTRODUCTION 
           FIGURE 18 EMAIL ENCRYPTION MARKET PROCESS
    5.2 MARKET: EVOLUTION AND TIMELINE 
           FIGURE 19 MARKET: EVOLUTION AND TIMELINE
           5.2.1 COMPREHENSIVE EXAMINATION OF MODERN EMAIL ENCRYPTION PROTOCOLS
                    5.2.1.1 Modern Email Encryption Protocols: Holistic Overview
                               FIGURE 20 SSL HANDSHAKE PROCESS
                               5.2.1.1.1 SSL Handshake: Ensuring Secure Email Communication
    5.3 BENEFITS OF EMAIL ENCRYPTION 
    5.4 EMAIL ENCRYPTION MARKET FRAMEWORK 
           FIGURE 21 MARKET FRAMEWORK: ASYMMETRIC KEY CRYPTOGRAPHY
    5.5 MARKET DYNAMICS 
           FIGURE 22 MARKET: DRIVERS, RESTRAINTS, OPPORTUNITIES, AND CHALLENGES
           5.5.1 DRIVERS
                    5.5.1.1 Surge in email data breaches
                    5.5.1.2 Increase in BEC frauds and spear-phishing incidents
                    5.5.1.3 Rise in stringent government regulations and data privacy compliance
                    5.5.1.4 Advancements in encryption technology
           5.5.2 RESTRAINTS
                    5.5.2.1 Complex implementation and compatibility issues
                    5.5.2.2 Cost constraints associated with email encryption solutions
           5.5.3 OPPORTUNITIES
                    5.5.3.1 Rapid adoption of remote work
                    5.5.3.2 Advancements in AI and ML-powered solutions
                    5.5.3.3 Proliferation of mobile devices
                    5.5.3.4 Migration of email infrastructure to cloud-based platforms
           5.5.4 CHALLENGES
                    5.5.4.1 Lack of seamless integration with operating systems
                    5.5.4.2 Interoperability issues and infrastructure limitations
    5.6 CASE STUDY ANALYSIS 
           5.6.1 GLOBAL BANK DEPLOYED SYSCOM’S IN-HOUSE VIRTUAL APPLIANCE TO STRENGTHEN EMAIL ENCRYPTION
           5.6.2 NORTHEASTERN RURAL HEALTH CLINICS DEPLOYED TRUSTIFI’S PLATFORM TO ESTABLISH USER-FRIENDLY MANAGEMENT CONSOLE
           5.6.3 ZEVA AND MICROSOFT COLLABORATED AND INTRODUCED DECRYPTNABOX TO OVERCOME CHALLENGES OF TRADITIONAL EMAIL ENCRYPTION
           5.6.4 ORIGO IMPLEMENTED TREND MICRO’S EMAIL ENCRYPTION SOLUTION TO ESTABLISH ROBUST AND EASY-TO-USE APPROACH TO EMAIL SECURITY
    5.7 VALUE CHAIN ANALYSIS 
           FIGURE 23 VALUE CHAIN ANALYSIS
    5.8 ECOSYSTEM ANALYSIS 
           FIGURE 24 ECOSYSTEM MAP
           TABLE 3 ROLE OF PLAYERS IN MARKET ECOSYSTEM
    5.9 PORTER’S FIVE FORCES ANALYSIS 
           FIGURE 25 PORTER’S FIVE FORCES ANALYSIS
           TABLE 4 PORTER’S FIVE FORCES MODEL: IMPACT ANALYSIS
           5.9.1 THREAT OF NEW ENTRANTS
           5.9.2 BARGAINING POWER OF SUPPLIERS
           5.9.3 BARGAINING POWER OF BUYERS
           5.9.4 THREAT OF SUBSTITUTES
           5.9.5 INTENSITY OF COMPETITIVE RIVALRY
    5.10 PRICING ANALYSIS 
           5.10.1 AVERAGE SELLING PRICE TREND OF KEY PLAYERS, BY SOLUTION
                    TABLE 5 PRICING ANALYSIS
    5.11 TECHNOLOGY ANALYSIS 
           5.11.1 ARTIFICIAL INTELLIGENCE AND MACHINE LEARNING
           5.11.2 ZERO TRUST SECURITY
           5.11.3 PUBLIC KEY INFRASTRUCTURE
           5.11.4 CLOUD-NATIVE SECURITY
           5.11.5 DIGITAL SIGNATURES
           5.11.6 BLOCKCHAIN TECHNOLOGY
           5.11.7 MAILCHAIN TECHNOLOGY
           5.11.8 QUANTUM-SAFE CRYPTOGRAPHY
           5.11.9 EMERGING TRENDS AND INNOVATIONS IN EMAIL ENCRYPTION TECHNOLOGY
    5.12 PATENT ANALYSIS 
                    FIGURE 26 EMAIL ENCRYPTION MARKET: PATENT ANALYSIS
    5.13 TRENDS AND DISRUPTIONS IMPACTING CUSTOMERS’ BUSINESSES 
                    FIGURE 27 TRENDS AND DISRUPTIONS IMPACTING CUSTOMERS’ BUSINESSES
    5.14 MARKET: TECHNOLOGY ROADMAP 
                    TABLE 6 MARKET: TECHNOLOGY ROADMAP
    5.15 MARKET: BUSINESS MODEL 
    5.16 TARIFF AND REGULATORY LANDSCAPE 
           5.16.1 PAYMENT CARD INDUSTRY DATA SECURITY STANDARD (PCI–DSS)
           5.16.2 GENERAL DATA PROTECTION REGULATION (GDPR)
           5.16.3 SARBANES-OXLEY ACT (SOX)
           5.16.4 CANADA’S ANTI-SPAM LEGISLATION (CASL)
           5.16.5 SERVICE ORGANIZATION CONTROL (SOC 2)
           5.16.6 HEALTH INSURANCE PORTABILITY AND ACCOUNTABILITY ACT (HIPAA)
           5.16.7 CAN-SPAM ACT
           5.16.8 REGULATORY BODIES, GOVERNMENT AGENCIES, AND OTHER ORGANIZATIONS
                    TABLE 7 LIST OF REGULATORY BODIES, GOVERNMENT AGENCIES, AND OTHER ORGANIZATIONS
    5.17 KEY STAKEHOLDERS AND BUYING CRITERIA 
           5.17.1 KEY STAKEHOLDERS IN BUYING PROCESS
                    FIGURE 28 INFLUENCE OF STAKEHOLDERS ON BUYING PROCESS
                    TABLE 8 INFLUENCE OF STAKEHOLDERS ON BUYING PROCESS
    5.18 KEY CONFERENCES & EVENTS 
                    TABLE 9 KEY CONFERENCES & EVENTS, 2023–2024
    5.19 EMAIL ENCRYPTION PROTOCOLS 
           5.19.1 PGP (PRETTY GOOD PRIVACY)
           5.19.2 S/MIME (SECURE/MULTIPURPOSE INTERNET MAIL EXTENSIONS)
           5.19.3 STARTTLS
           5.19.4 DKIM (DOMAINKEYS IDENTIFIED MAIL)
           5.19.5 OPEN PGP
           5.19.6 AES-256
 
6 EMAIL ENCRYPTION MARKET, BY TYPE (Page No. - 98)
    6.1 INTRODUCTION 
    6.2 END-TO-END ENCRYPTION 
           6.2.1 ADVANCED SECURITY NEEDS AND RISING PRIVACY IMPERATIVES TO DRIVE MARKET
    6.3 EMAIL GATEWAY ENCRYPTION 
           6.3.1 NEED FOR CENTRALIZED SECURITY AND VIRTUALIZATION TO BOOST GROWTH
    6.4 BOUNDARY EMAIL ENCRYPTION 
           6.4.1 FOCUS ON SEAMLESS INTEGRATION AND MINIMIZED MAINTENANCE TO PROPEL MARKET EXPANSION
    6.5 HYBRID EMAIL ENCRYPTION 
           6.5.1 NEED FOR BALANCING DATA SECURITY AND ACCESSIBILITY TO BOOST ADOPTION OF HYBRID EMAIL ENCRYPTION SOLUTIONS
    6.6 CLIENT PLUGINS 
           6.6.1 DEMAND FOR ENHANCING EMAIL SECURITY AND ENSURING REGULATORY COMPLIANCE TO BOOST GROWTH
 
7 EMAIL ENCRYPTION MARKET, BY OFFERING (Page No. - 101)
    7.1 INTRODUCTION 
           7.1.1 OFFERINGS: MARKET DRIVERS
                    FIGURE 29 SOLUTIONS SEGMENT TO ACCOUNT FOR LARGER MARKET DURING FORECAST PERIOD
                    TABLE 10 MARKET, BY OFFERING, 2017–2022 (USD MILLION)
                    TABLE 11 MARKET, BY OFFERING, 2023–2028 (USD MILLION)
    7.2 SOLUTIONS 
           7.2.1 NEED FOR PLAYERS TO SECURE SENSITIVE DATA AND PRESENCE OF EMINENT EMAIL ENCRYPTION SOLUTION VENDORS TO DRIVE MARKET
                    TABLE 12 SOLUTIONS: MARKET, BY REGION, 2017–2022 (USD MILLION)
                    TABLE 13 SOLUTIONS: MARKET, BY REGION, 2023–2028 (USD MILLION)
    7.3 SERVICES 
           TABLE 14 SERVICES: MARKET, BY REGION, 2017–2022 (USD MILLION)
           TABLE 15 SERVICES: MARKET, BY REGION, 2023–2028 (USD MILLION)
           TABLE 16 MARKET, BY SERVICE, 2017–2022 (USD MILLION)
           TABLE 17 MARKET, BY SERVICE, 2023–2028 (USD MILLION)
           7.3.1 PROFESSIONAL
                    7.3.1.1 Growing emphasis on expertise-driven implementation and regulatory compliance to drive market
           7.3.2 MANAGED
                    7.3.2.1 Need for round-the-clock protection and swift incident response to prove lucrative for market growth
 
8 EMAIL ENCRYPTION MARKET, BY DEPLOYMENT MODE (Page No. - 107)
    8.1 INTRODUCTION 
           8.1.1 DEPLOYMENT MODES: MARKET DRIVERS
                    FIGURE 30 ON-PREMISES SEGMENT TO LEAD MARKET DURING FORECAST PERIOD
                    TABLE 18 MARKET, BY DEPLOYMENT MODE, 2017–2022 (USD MILLION)
                    TABLE 19 MARKET, BY DEPLOYMENT MODE, 2023–2028 (USD MILLION)
    8.2 ON-PREMISES 
           8.2.1 INCREASING CYBERSECURITY THREATS AND DEMAND FOR REAL-TIME PROTECTION TO DRIVE MARKET
                    TABLE 20 ON-PREMISES: MARKET, BY REGION, 2017–2022 (USD MILLION)
                    TABLE 21 ON-PREMISES: MARKET, BY REGION, 2023–2028 (USD MILLION)
    8.3 CLOUD 
           8.3.1 BENEFITS OF CLOUD DEPLOYMENT MODE TO SURGE DEMAND FOR CLOUD-BASED EMAIL ENCRYPTION SOLUTIONS
                    TABLE 22 CLOUD: MARKET, BY REGION, 2017–2022 (USD MILLION)
                    TABLE 23 CLOUD: MARKET, BY REGION, 2023–2028 (USD MILLION)
 
9 EMAIL ENCRYPTION MARKET, BY VERTICAL (Page No. - 111)
    9.1 INTRODUCTION 
           9.1.1 VERTICALS: MARKET DRIVERS
                    FIGURE 31 HEALTHCARE SEGMENT TO ACHIEVE HIGHEST GROWTH DURING FORECAST PERIOD
                    TABLE 24 MARKET, BY VERTICAL, 2017–2022 (USD MILLION)
                    TABLE 25 MARKET, BY VERTICAL, 2023–2028 (USD MILLION)
    9.2 BFSI 
           9.2.1 INCREASING EMPHASIS ON DATA SECURITY AND REGULATORY COMPLIANCE TO SPUR GROWTH
                    TABLE 26 BFSI: MARKET, BY REGION, 2017–2022 (USD MILLION)
                    TABLE 27 BFSI: MARKET, BY REGION, 2023–2028 (USD MILLION)
    9.3 GOVERNMENT 
           9.3.1 RISING NEED TO MAINTAIN SENSITIVITY IN DEALING WITH PRIVATE CITIZEN RECORDS TO PROPEL MARKET
                    TABLE 28 GOVERNMENT: EMAIL ENCRYPTION MARKET, BY REGION, 2017–2022 (USD MILLION)
                    TABLE 29 GOVERNMENT: MARKET, BY REGION, 2023–2028 (USD MILLION)
    9.4 IT & ITES 
           9.4.1 HIGH TECHNOLOGICAL ADVANCEMENTS AND NEED FOR ENHANCED SECURITY TO BOOST GROWTH
                    TABLE 30 IT & ITES: MARKET, BY REGION, 2017–2022 (USD MILLION)
                    TABLE 31 IT & ITES: MARKET, BY REGION, 2023–2028 (USD MILLION)
    9.5 HEALTHCARE 
           9.5.1 INCREASING DIGITALIZATION OF HEALTHCARE SECTOR TO ENCOURAGE USE OF EMAIL ENCRYPTION FOR ENHANCED PROTECTION OF PATIENT DATA
                    TABLE 32 HEALTHCARE: MARKET, BY REGION, 2017–2022 (USD MILLION)
                    TABLE 33 HEALTHCARE: MARKET, BY REGION, 2023–2028 (USD MILLION)
    9.6 TELECOMMUNICATIONS 
           9.6.1 INCREASING EMAIL-BORNE ATTACKS AND DIGITAL TRANSFORMATION TO ACCELERATE DEMAND FOR EMAIL ENCRYPTION SOLUTIONS
                    TABLE 34 TELECOMMUNICATIONS: EMAIL ENCRYPTION MARKET, BY REGION, 2017–2022 (USD MILLION)
                    TABLE 35 TELECOMMUNICATIONS: MARKET, BY REGION, 2023–2028 (USD MILLION)
    9.7 MANUFACTURING 
           9.7.1 ADOPTION OF VAST, INTRICATE DATA NETWORKS IN MANUFACTURING SECTOR TO ENCOURAGE GROWTH
                    TABLE 36 MANUFACTURING: MARKET, BY REGION, 2017–2022 (USD MILLION)
                    TABLE 37 MANUFACTURING: MARKET, BY REGION, 2023–2028 (USD MILLION)
    9.8 ENERGY & UTILITIES 
           9.8.1 GROWING SECURITY REQUIREMENTS IN ENERGY & UTILITIES SECTOR TO DRIVE ADOPTION OF EMAIL ENCRYPTION SOLUTIONS AND SERVICES
                    TABLE 38 ENERGY & UTILITIES: MARKET, BY REGION, 2017–2022 (USD MILLION)
                    TABLE 39 ENERGY & UTILITIES: MARKET, BY REGION, 2023–2028 (USD MILLION)
    9.9 RETAIL & ECOMMERCE 
           9.9.1 ELEVATED DEMAND FOR EMAIL SECURITY ACROSS RETAIL CHANNELS TO ENCOURAGE GROWTH
                    TABLE 40 RETAIL & ECOMMERCE: MARKET, BY REGION, 2017–2022 (USD MILLION)
                    TABLE 41 RETAIL & ECOMMERCE: MARKET, BY REGION, 2023–2028 (USD MILLION)
    9.10 OTHER VERTICALS 
 
10 EMAIL ENCRYPTION MARKET, BY REGION (Page No. - 123)
     10.1 INTRODUCTION 
               FIGURE 32 ASIA PACIFIC TO GROW AT HIGHEST CAGR BY 2028
               TABLE 42 MARKET, BY REGION, 2017–2022 (USD MILLION)
               TABLE 43 MARKET, BY REGION, 2023–2028 (USD MILLION)
     10.2 NORTH AMERICA 
             10.2.1 NORTH AMERICA: MARKET DRIVERS
             10.2.2 NORTH AMERICA: RECESSION IMPACT
             10.2.3 NORTH AMERICA: REGULATORY LANDSCAPE
                       FIGURE 33 NORTH AMERICA: MARKET SNAPSHOT
                       TABLE 44 NORTH AMERICA: EMAIL ENCRYPTION MARKET, BY OFFERING, 2017–2022 (USD MILLION)
                       TABLE 45 NORTH AMERICA: MARKET, BY OFFERING, 2023–2028 (USD MILLION)
                       TABLE 46 NORTH AMERICA: MARKET, BY SERVICE, 2017–2022 (USD MILLION)
                       TABLE 47 NORTH AMERICA: MARKET, BY SERVICE, 2023–2028 (USD MILLION)
                       TABLE 48 NORTH AMERICA: MARKET, BY DEPLOYMENT MODE, 2017–2022 (USD MILLION)
                       TABLE 49 NORTH AMERICA: MARKET, BY DEPLOYMENT MODE, 2023–2028 (USD MILLION)
                       TABLE 50 NORTH AMERICA: MARKET, BY VERTICAL, 2017–2022 (USD MILLION)
                       TABLE 51 NORTH AMERICA: MARKET, BY VERTICAL, 2023–2028 (USD MILLION)
                       TABLE 52 NORTH AMERICA: MARKET, BY COUNTRY, 2017–2022 (USD MILLION)
                       TABLE 53 NORTH AMERICA: MARKET, BY COUNTRY, 2023–2028 (USD MILLION)
             10.2.4 US
                       10.2.4.1 Emerging digital trends and rising cybersecurity incidents to drive demand for email encryption services
                                   TABLE 54 US: EMAIL ENCRYPTION MARKET, BY OFFERING, 2017–2022 (USD MILLION)
                                   TABLE 55 US: MARKET, BY OFFERING, 2023–2028 (USD MILLION)
                                   TABLE 56 US: MARKET, BY DEPLOYMENT MODE, 2017–2022 (USD MILLION)
                                   TABLE 57 US: MARKET, BY DEPLOYMENT MODE, 2023–2028 (USD MILLION)
                                   TABLE 58 US: MARKET, BY VERTICAL, 2017–2022 (USD MILLION)
                                   TABLE 59 US: MARKET, BY VERTICAL, 2023–2028 (USD MILLION)
             10.2.5 CANADA
                       10.2.5.1 Rising governmental initiatives to counter cyber attacks to boost adoption of email encryption services
                                   TABLE 60 CANADA: MARKET, BY OFFERING, 2017–2022 (USD MILLION)
                                   TABLE 61 CANADA: MARKET, BY OFFERING, 2023–2028 (USD MILLION)
                                   TABLE 62 CANADA: MARKET, BY DEPLOYMENT MODE, 2017–2022 (USD MILLION)
                                   TABLE 63 CANADA: MARKET, BY DEPLOYMENT MODE, 2023–2028 (USD MILLION)
                                   TABLE 64 CANADA: MARKET, BY VERTICAL, 2017–2022 (USD MILLION)
                                   TABLE 65 CANADA: MARKET, BY VERTICAL, 2023–2028 (USD MILLION)
     10.3 EUROPE 
             10.3.1 EUROPE: MARKET DRIVERS
             10.3.2 EUROPE: RECESSION IMPACT
             10.3.3 EUROPE: REGULATORY LANDSCAPE
                       TABLE 66 EUROPE: EMAIL ENCRYPTION MARKET, BY OFFERING, 2017–2022 (USD MILLION)
                       TABLE 67 EUROPE: MARKET, BY OFFERING, 2023–2028 (USD MILLION)
                       TABLE 68 EUROPE: MARKET, BY SERVICE, 2017–2022 (USD MILLION)
                       TABLE 69 EUROPE: MARKET, BY SERVICE, 2023–2028 (USD MILLION)
                       TABLE 70 EUROPE: MARKET, BY DEPLOYMENT MODE, 2017–2022 (USD MILLION)
                       TABLE 71 EUROPE: MARKET, BY DEPLOYMENT MODE, 2023–2028 (USD MILLION)
                       TABLE 72 EUROPE: MARKET, BY VERTICAL, 2017–2022 (USD MILLION)
                       TABLE 73 EUROPE: MARKET, BY VERTICAL, 2023–2028 (USD MILLION)
                       TABLE 74 EUROPE: MARKET, BY COUNTRY, 2017–2022 (USD MILLION)
                       TABLE 75 EUROPE: MARKET, BY COUNTRY, 2023–2028 (USD MILLION)
             10.3.4 UK
                       10.3.4.1 Technological evolution and growing need to challenge cybercrime to propel market expansion
                                   TABLE 76 UK: EMAIL ENCRYPTION MARKET, BY OFFERING, 2017–2022 (USD MILLION)
                                   TABLE 77 UK: MARKET, BY OFFERING, 2023–2028 (USD MILLION)
                                   TABLE 78 UK: MARKET, BY DEPLOYMENT MODE, 2017–2022 (USD MILLION)
                                   TABLE 79 UK: MARKET, BY DEPLOYMENT MODE, 2023–2028 (USD MILLION)
                                   TABLE 80 UK: MARKET, BY VERTICAL, 2017–2022 (USD MILLION)
                                   TABLE 81 UK: MARKET, BY VERTICAL, 2023–2028 (USD MILLION)
             10.3.5 GERMANY
                       10.3.5.1 Rising trend toward machine learning and artificial intelligence to drive adoption of email encryption services
                                   TABLE 82 GERMANY: MARKET, BY OFFERING, 2017–2022 (USD MILLION)
                                   TABLE 83 GERMANY: MARKET, BY OFFERING, 2023–2028 (USD MILLION)
                                   TABLE 84 GERMANY: MARKET, BY DEPLOYMENT MODE, 2017–2022 (USD MILLION)
                                   TABLE 85 GERMANY: MARKET, BY DEPLOYMENT MODE, 2023–2028 (USD MILLION)
                                   TABLE 86 GERMANY: MARKET, BY VERTICAL, 2017–2022 (USD MILLION)
                                   TABLE 87 GERMANY: MARKET, BY VERTICAL, 2023–2028 (USD MILLION)
             10.3.6 FRANCE
                       10.3.6.1 Focus on establishing secure and confidential communication channels to boost growth
                                   TABLE 88 FRANCE: EMAIL ENCRYPTION MARKET, BY OFFERING, 2017–2022 (USD MILLION)
                                   TABLE 89 FRANCE: MARKET, BY OFFERING, 2023–2028 (USD MILLION)
                                   TABLE 90 FRANCE: MARKET, BY DEPLOYMENT MODE, 2017–2022 (USD MILLION)
                                   TABLE 91 FRANCE: MARKET, BY DEPLOYMENT MODE, 2023–2028 (USD MILLION)
                                   TABLE 92 FRANCE: MARKET, BY VERTICAL, 2017–2022 (USD MILLION)
                                   TABLE 93 FRANCE: MARKET, BY VERTICAL, 2023–2028 (USD MILLION)
             10.3.7 REST OF EUROPE
                       TABLE 94 REST OF EUROPE: MARKET, BY OFFERING, 2017–2022 (USD MILLION)
                       TABLE 95 REST OF EUROPE: MARKET, BY OFFERING, 2023–2028 (USD MILLION)
                       TABLE 96 REST OF EUROPE: MARKET, BY DEPLOYMENT MODE, 2017–2022 (USD MILLION)
                       TABLE 97 REST OF EUROPE: MARKET, BY DEPLOYMENT MODE, 2023–2028 (USD MILLION)
                       TABLE 98 REST OF EUROPE: MARKET, BY VERTICAL, 2017–2022 (USD MILLION)
                       TABLE 99 REST OF EUROPE: MARKET, BY VERTICAL, 2023–2028 (USD MILLION)
     10.4 ASIA PACIFIC 
             10.4.1 ASIA PACIFIC: MARKET DRIVERS
             10.4.2 ASIA PACIFIC: RECESSION IMPACT
             10.4.3 ASIA PACIFIC: REGULATORY LANDSCAPE
                       FIGURE 34 ASIA PACIFIC: EMAIL ENCRYPTION MARKET SNAPSHOT
                       TABLE 100 ASIA PACIFIC: MARKET, BY OFFERING, 2017–2022 (USD MILLION)
                       TABLE 101 ASIA PACIFIC: MARKET, BY OFFERING, 2023–2028 (USD MILLION)
                       TABLE 102 ASIA PACIFIC: MARKET, BY SERVICE, 2017–2022 (USD MILLION)
                       TABLE 103 ASIA PACIFIC: MARKET, BY SERVICE, 2023–2028 (USD MILLION)
                       TABLE 104 ASIA PACIFIC: MARKET, BY DEPLOYMENT MODE, 2017–2022 (USD MILLION)
                       TABLE 105 ASIA PACIFIC: MARKET, BY DEPLOYMENT MODE, 2023–2028 (USD MILLION)
                       TABLE 106 ASIA PACIFIC: MARKET, BY VERTICAL, 2017–2022 (USD MILLION)
                       TABLE 107 ASIA PACIFIC: MARKET, BY VERTICAL, 2023–2028 (USD MILLION)
                       TABLE 108 ASIA PACIFIC: MARKET, BY COUNTRY, 2017–2022 (USD MILLION)
                       TABLE 109 ASIA PACIFIC: MARKET, BY COUNTRY, 2023–2028 (USD MILLION)
             10.4.4 CHINA
                       10.4.4.1 Growing emphasis on securing digital communications to encourage market growth
                                   TABLE 110 CHINA: EMAIL ENCRYPTION MARKET, BY OFFERING, 2017–2022 (USD MILLION)
                                   TABLE 111 CHINA: MARKET, BY OFFERING, 2023–2028 (USD MILLION)
                                   TABLE 112 CHINA: MARKET, BY DEPLOYMENT MODE, 2017–2022 (USD MILLION)
                                   TABLE 113 CHINA: MARKET, BY DEPLOYMENT MODE, 2023–2028 (USD MILLION)
                                   TABLE 114 CHINA: MARKET, BY VERTICAL, 2017–2022 (USD MILLION)
                                   TABLE 115 CHINA: MARKET, BY VERTICAL, 2023–2028 (USD MILLION)
             10.4.5 JAPAN
                       10.4.5.1 Demand for robust email security alongside adoption of cutting-edge solutions to boost growth
                                   TABLE 116 JAPAN: MARKET, BY OFFERING, 2017–2022 (USD MILLION)
                                   TABLE 117 JAPAN: MARKET, BY OFFERING, 2023–2028 (USD MILLION)
                                   TABLE 118 JAPAN: MARKET, BY DEPLOYMENT MODE, 2017–2022 (USD MILLION)
                                   TABLE 119 JAPAN: MARKET, BY DEPLOYMENT MODE, 2023–2028 (USD MILLION)
                                   TABLE 120 JAPAN: MARKET, BY VERTICAL, 2017–2022 (USD MILLION)
                                   TABLE 121 JAPAN: MARKET, BY VERTICAL, 2023–2028 (USD MILLION)
             10.4.6 INDIA
                       10.4.6.1 Rapid surge of IT ecosystem and robust digital transformation to propel market expansion
                                   TABLE 122 INDIA: EMAIL ENCRYPTION MARKET, BY OFFERING, 2017–2022 (USD MILLION)
                                   TABLE 123 INDIA: MARKET, BY OFFERING, 2023–2028 (USD MILLION)
                                   TABLE 124 INDIA: MARKET, BY DEPLOYMENT MODE, 2017–2022 (USD MILLION)
                                   TABLE 125 INDIA: MARKET, BY DEPLOYMENT MODE, 2023–2028 (USD MILLION)
                                   TABLE 126 INDIA: MARKET, BY VERTICAL, 2017–2022 (USD MILLION)
                                   TABLE 127 INDIA: MARKET, BY VERTICAL, 2023–2028 (USD MILLION)
             10.4.7 SINGAPORE
                       10.4.7.1 Digital evolution and increasing government initiatives to support popularity of email encryption services
                                   TABLE 128 SINGAPORE: MARKET, BY OFFERING, 2017–2022 (USD MILLION)
                                   TABLE 129 SINGAPORE: MARKET, BY OFFERING, 2023–2028 (USD MILLION)
                                   TABLE 130 SINGAPORE: MARKET, BY DEPLOYMENT MODE, 2017–2022 (USD MILLION)
                                   TABLE 131 SINGAPORE: MARKET, BY DEPLOYMENT MODE, 2023–2028 (USD MILLION)
                                   TABLE 132 SINGAPORE: MARKET, BY VERTICAL, 2017–2022 (USD MILLION)
                                   TABLE 133 SINGAPORE: MARKET, BY VERTICAL, 2023–2028 (USD MILLION)
             10.4.8 AUSTRALIA & NEW ZEALAND
                       10.4.8.1 Rising digital challenges to propel adoption of advanced email encryption solutions and services
                                   TABLE 134 AUSTRALIA & NEW ZEALAND: EMAIL ENCRYPTION MARKET, BY OFFERING, 2017–2022 (USD MILLION)
                                   TABLE 135 AUSTRALIA & NEW ZEALAND: MARKET, BY OFFERING, 2023–2028 (USD MILLION)
                                   TABLE 136 AUSTRALIA & NEW ZEALAND: MARKET, BY DEPLOYMENT MODE, 2017–2022 (USD MILLION)
                                   TABLE 137 AUSTRALIA & NEW ZEALAND: MARKET, BY DEPLOYMENT MODE, 2023–2028 (USD MILLION)
                                   TABLE 138 AUSTRALIA & NEW ZEALAND: MARKET, BY VERTICAL, 2017–2022 (USD MILLION)
                                   TABLE 139 AUSTRALIA & NEW ZEALAND: MARKET, BY VERTICAL, 2023–2028 (USD MILLION)
             10.4.9 REST OF ASIA PACIFIC
                       TABLE 140 REST OF ASIA PACIFIC: MARKET, BY OFFERING, 2017–2022 (USD MILLION)
                       TABLE 141 REST OF ASIA PACIFIC: MARKET, BY OFFERING, 2023–2028 (USD MILLION)
                       TABLE 142 REST OF ASIA PACIFIC: MARKET, BY DEPLOYMENT MODE, 2017–2022 (USD MILLION)
                       TABLE 143 REST OF ASIA PACIFIC: MARKET, BY DEPLOYMENT MODE, 2023–2028 (USD MILLION)
                       TABLE 144 REST OF ASIA PACIFIC: MARKET, BY VERTICAL, 2017–2022 (USD MILLION)
                       TABLE 145 REST OF ASIA PACIFIC: MARKET, BY VERTICAL, 2023–2028 (USD MILLION)
     10.5 MIDDLE EAST & AFRICA 
             10.5.1 MIDDLE EAST & AFRICA: MARKET DRIVERS
             10.5.2 MIDDLE EAST & AFRICA: RECESSION IMPACT
             10.5.3 MIDDLE EAST & AFRICA: REGULATORY LANDSCAPE
                       TABLE 146 MIDDLE EAST & AFRICA: EMAIL ENCRYPTION MARKET, BY OFFERING, 2017–2022 (USD MILLION)
                       TABLE 147 MIDDLE EAST & AFRICA: MARKET, BY OFFERING, 2023–2028 (USD MILLION)
                       TABLE 148 MIDDLE EAST & AFRICA: MARKET, BY SERVICE, 2017–2022 (USD MILLION)
                       TABLE 149 MIDDLE EAST & AFRICA: MARKET, BY SERVICE, 2023–2028 (USD MILLION)
                       TABLE 150 MIDDLE EAST & AFRICA: MARKET, BY DEPLOYMENT MODE, 2017–2022 (USD MILLION)
                       TABLE 151 MIDDLE EAST & AFRICA: MARKET, BY DEPLOYMENT MODE, 2023–2028 (USD MILLION)
                       TABLE 152 MIDDLE EAST & AFRICA: MARKET, BY VERTICAL, 2017–2022 (USD MILLION)
                       TABLE 153 MIDDLE EAST & AFRICA: MARKET, BY VERTICAL, 2023–2028 (USD MILLION)
                       TABLE 154 MIDDLE EAST & AFRICA: MARKET, BY COUNTRY, 2017–2022 (USD MILLION)
                       TABLE 155 MIDDLE EAST & AFRICA: MARKET, BY COUNTRY, 2023–2028 (USD MILLION)
             10.5.4 MIDDLE EAST
                       10.5.4.1 Rising research and development activities to encourage adoption of email encryption solutions and services
                                   TABLE 156 MIDDLE EAST: EMAIL ENCRYPTION MARKET, BY OFFERING, 2017–2022 (USD MILLION)
                                   TABLE 157 MIDDLE EAST: MARKET, BY OFFERING, 2023–2028 (USD MILLION)
                                   TABLE 158 MIDDLE EAST: MARKET, BY DEPLOYMENT MODE, 2017–2022 (USD MILLION)
                                   TABLE 159 MIDDLE EAST: MARKET, BY DEPLOYMENT MODE, 2023–2028 (USD MILLION)
                                   TABLE 160 MIDDLE EAST: MARKET, BY VERTICAL, 2017–2022 (USD MILLION)
                                   TABLE 161 MIDDLE EAST: MARKET, BY VERTICAL, 2023–2028 (USD MILLION)
             10.5.5 AFRICA
                       10.5.5.1 Increasing instances of email phishing and scams to drive demand for email encryption solutions
                                   TABLE 162 AFRICA: MARKET, BY OFFERING, 2017–2022 (USD MILLION)
                                   TABLE 163 AFRICA: MARKET, BY OFFERING, 2023–2028 (USD MILLION)
                                   TABLE 164 AFRICA: MARKET, BY DEPLOYMENT MODE, 2017–2022 (USD MILLION)
                                   TABLE 165 AFRICA: MARKET, BY DEPLOYMENT MODE, 2023–2028 (USD MILLION)
                                   TABLE 166 AFRICA: MARKET, BY VERTICAL, 2017–2022 (USD MILLION)
                                   TABLE 167 AFRICA: MARKET, BY VERTICAL, 2023–2028 (USD MILLION)
     10.6 LATIN AMERICA 
             10.6.1 LATIN AMERICA: MARKET DRIVERS
             10.6.2 LATIN AMERICA: RECESSION IMPACT
             10.6.3 LATIN AMERICA: REGULATORY LANDSCAPE
                       TABLE 168 LATIN AMERICA: EMAIL ENCRYPTION MARKET, BY OFFERING, 2017–2022 (USD MILLION)
                       TABLE 169 LATIN AMERICA: MARKET, BY OFFERING, 2023–2028 (USD MILLION)
                       TABLE 170 LATIN AMERICA: MARKET, BY SERVICE, 2017–2022 (USD MILLION)
                       TABLE 171 LATIN AMERICA: MARKET, BY SERVICE, 2023–2028 (USD MILLION)
                       TABLE 172 LATIN AMERICA: MARKET, BY DEPLOYMENT MODE, 2017–2022 (USD MILLION)
                       TABLE 173 LATIN AMERICA: MARKET, BY DEPLOYMENT MODE, 2023–2028 (USD MILLION)
                       TABLE 174 LATIN AMERICA: MARKET, BY VERTICAL, 2017–2022 (USD MILLION)
                       TABLE 175 LATIN AMERICA: MARKET, BY VERTICAL, 2023–2028 (USD MILLION)
                       TABLE 176 LATIN AMERICA: MARKET, BY COUNTRY, 2017–2022 (USD MILLION)
                       TABLE 177 LATIN AMERICA: MARKET, BY COUNTRY, 2023–2028 (USD MILLION)
             10.6.4 BRAZIL
                       10.6.4.1 Increasing digital penetration and popularity of social media to surge adoption of email encryption solutions
                                   TABLE 178 BRAZIL: EMAIL ENCRYPTION MARKET, BY OFFERING, 2017–2022 (USD MILLION)
                                   TABLE 179 BRAZIL: MARKET, BY OFFERING, 2023–2028 (USD MILLION)
                                   TABLE 180 BRAZIL: MARKET, BY DEPLOYMENT MODE, 2017–2022 (USD MILLION)
                                   TABLE 181 BRAZIL: MARKET, BY DEPLOYMENT MODE, 2023–2028 (USD MILLION)
                                   TABLE 182 BRAZIL: MARKET, BY VERTICAL, 2017–2022 (USD MILLION)
                                   TABLE 183 BRAZIL: MARKET, BY VERTICAL, 2023–2028 (USD MILLION)
             10.6.5 MEXICO
                       10.6.5.1 Rapid expansion of infrastructure across verticals to push need for advancements in email service
                                   TABLE 184 MEXICO: MARKET, BY OFFERING, 2017–2022 (USD MILLION)
                                   TABLE 185 MEXICO: MARKET, BY OFFERING, 2023–2028 (USD MILLION)
                                   TABLE 186 MEXICO: MARKET, BY DEPLOYMENT MODE, 2017–2022 (USD MILLION)
                                   TABLE 187 MEXICO: MARKET, BY DEPLOYMENT MODE, 2023–2028 (USD MILLION)
                                   TABLE 188 MEXICO: MARKET, BY VERTICAL, 2017–2022 (USD MILLION)
                                   TABLE 189 MEXICO: MARKET, BY VERTICAL, 2023–2028 (USD MILLION)
             10.6.6 REST OF LATIN AMERICA
                       TABLE 190 REST OF LATIN AMERICA: EMAIL ENCRYPTION MARKET, BY OFFERING, 2017–2022 (USD MILLION)
                       TABLE 191 REST OF LATIN AMERICA: MARKET, BY OFFERING, 2023–2028 (USD MILLION)
                       TABLE 192 REST OF LATIN AMERICA: MARKET, BY DEPLOYMENT MODE, 2017–2022 (USD MILLION)
                       TABLE 193 REST OF LATIN AMERICA: MARKET, BY DEPLOYMENT MODE, 2023–2028 (USD MILLION)
                       TABLE 194 REST OF LATIN AMERICA: MARKET, BY VERTICAL, 2017–2022 (USD MILLION)
                       TABLE 195 REST OF LATIN AMERICA: MARKET, BY VERTICAL, 2023–2028 (USD MILLION)
 
11 COMPETITIVE LANDSCAPE (Page No. - 190)
     11.1 OVERVIEW 
     11.2 GLOBAL SNAPSHOT OF KEY MARKET PARTICIPANTS 
               FIGURE 35 GLOBAL SNAPSHOT OF KEY MARKET PARTICIPANTS, 2022
     11.3 HISTORICAL REVENUE ANALYSIS FOR KEY PLAYERS 
               FIGURE 36 HISTORICAL REVENUE ANALYSIS FOR KEY PLAYERS, 2017–2022 (USD MILLION)
     11.4 VALUATION AND FINANCIAL METRICS OF KEY EMAIL ENCRYPTION VENDORS 
               FIGURE 37 VALUATION AND FINANCIAL METRICS OF KEY EMAIL ENCRYPTION VENDORS, 2022
     11.5 RANKING OF KEY PLAYERS 
               FIGURE 38 RANKINGS OF KEY PLAYERS
     11.6 MARKET SHARE ANALYSIS 
               FIGURE 39 MARKET SHARE ANALYSIS, 2022
               TABLE 196 EMAIL ENCRYPTION MARKET: INTENSITY OF COMPETITIVE RIVALRY
     11.7 COMPANY EVALUATION MATRIX 
             11.7.1 STARS
             11.7.2 EMERGING LEADERS
             11.7.3 PERVASIVE PLAYERS
             11.7.4 PARTICIPANTS
                       FIGURE 40 COMPANY EVALUATION MATRIX FOR KEY PLAYERS, 2022
             11.7.5 COMPANY FOOTPRINT
                       TABLE 197 COMPANY FOOTPRINT FOR KEY PLAYERS, BY REGION
     11.8 STARTUP/SME EVALUATION MATRIX 
             11.8.1 PROGRESSIVE COMPANIES
             11.8.2 RESPONSIVE COMPANIES
             11.8.3 DYNAMIC COMPANIES
             11.8.4 STARTING BLOCKS
                       FIGURE 41 COMPANY EVALUATION MATRIX FOR STARTUPS/SMES, 2022
             11.8.5 COMPETITIVE BENCHMARKING
                       TABLE 198 LIST OF STARTUPS/SMES AND FUNDING
                       TABLE 199 COMPANY FOOTPRINT FOR STARTUPS/SMES, BY REGION
     11.9 COMPETITIVE SCENARIO AND TRENDS 
             11.9.1 PRODUCT LAUNCHES & ENHANCEMENTS
                       TABLE 200 MARKET: PRODUCT LAUNCHES & ENHANCEMENTS, 2021–2023
             11.9.2 DEALS
                       TABLE 201 EMAIL ENCRYPTION MARKET: DEALS, 2021–2023
 
12 COMPANY PROFILES (Page No. - 205)
(Business overview, Products/Solutions/Services offered, Recent developments & MnM View)*
     12.1 KEY PLAYERS 
             12.1.1 FORTINET
                       TABLE 202 FORTINET: BUSINESS OVERVIEW
                       FIGURE 42 FORTINET: COMPANY SNAPSHOT
                       TABLE 203 FORTINET: PRODUCTS/SOLUTIONS/SERVICES OFFERED
             12.1.2 BAE SYSTEMS
                       TABLE 204 BAE SYSTEMS: BUSINESS OVERVIEW
                       FIGURE 43 BAE SYSTEMS: COMPANY SNAPSHOT
                       TABLE 205 BAE SYSTEMS: PRODUCTS/SOLUTIONS/SERVICES OFFERED
                       TABLE 206 BAE SYSTEMS: DEALS
             12.1.3 MIMECAST
                       TABLE 207 MIMECAST: BUSINESS OVERVIEW
                       TABLE 208 MIMECAST: PRODUCTS/SOLUTIONS/SERVICES OFFERED
                       TABLE 209 MIMECAST: PRODUCT LAUNCHES
                       TABLE 210 MIMECAST: DEALS
             12.1.4 CISCO
                       TABLE 211 CISCO: BUSINESS OVERVIEW
                       FIGURE 44 CISCO: COMPANY SNAPSHOT
                       TABLE 212 CISCO: PRODUCTS/SOLUTIONS/SERVICES OFFERED
             12.1.5 PROOFPOINT
                       TABLE 213 PROOFPOINT: BUSINESS OVERVIEW
                       TABLE 214 PROOFPOINT: PRODUCTS/SOLUTIONS/SERVICES OFFERED
                       TABLE 215 PROOFPOINT: PRODUCT LAUNCHES
                       TABLE 216 PROOFPOINT: DEALS
             12.1.6 ZOHO
                       TABLE 217 ZOHO: BUSINESS OVERVIEW
                       TABLE 218 ZOHO: PRODUCTS/SOLUTIONS/SERVICES OFFERED
                       TABLE 219 ZOHO: PRODUCT LAUNCHES
             12.1.7 BROADCOM
                       TABLE 220 BROADCOM: BUSINESS OVERVIEW
                       FIGURE 45 BROADCOM: COMPANY SNAPSHOT
                       TABLE 221 BROADCOM: PRODUCTS/SOLUTIONS/SERVICES OFFERED
                       TABLE 222 BROADCOM: PRODUCT LAUNCHES
                       TABLE 223 BROADCOM: DEALS
             12.1.8 OPENTEXT
                       TABLE 224 OPENTEXT: BUSINESS OVERVIEW
                       FIGURE 46 OPENTEXT: COMPANY SNAPSHOT
                       TABLE 225 OPENTEXT: PRODUCTS/SOLUTIONS/SERVICES OFFERED
                       TABLE 226 OPENTEXT: PRODUCT LAUNCHES
                       TABLE 227 OPENTEXT: DEALS
             12.1.9 BARRACUDA NETWORKS
                       TABLE 228 BARRACUDA NETWORKS: BUSINESS OVERVIEW
                       TABLE 229 BARRACUDA NETWORKS: PRODUCTS/SOLUTIONS/SERVICES OFFERED
                       TABLE 230 BARRACUDA NETWORKS: PRODUCT LAUNCHES
                       TABLE 231 BARRACUDA NETWORKS: DEALS
             12.1.10 THALES
                       TABLE 232 THALES: BUSINESS OVERVIEW
                       FIGURE 47 THALES: COMPANY SNAPSHOT
                       TABLE 233 THALES: PRODUCTS/SOLUTIONS/SERVICES OFFERED
                       TABLE 234 THALES: PRODUCT LAUNCHES
                       TABLE 235 THALES: DEALS
             12.1.11 HPE
                       TABLE 236 HPE: BUSINESS OVERVIEW
                       FIGURE 48 HPE: COMPANY SNAPSHOT
                       TABLE 237 HPE: PRODUCTS/SOLUTIONS/SERVICES OFFERED
                       TABLE 238 HPE: PRODUCT LAUNCHES
                       TABLE 239 HPE: DEALS
             12.1.12 ENTRUST
                       TABLE 240 ENTRUST: BUSINESS OVERVIEW
                       TABLE 241 ENTRUST: PRODUCTS/SOLUTIONS/SERVICES OFFERED
                       TABLE 242 ENTRUST: PRODUCT LAUNCHES
             12.1.13 FORTRA
                       TABLE 243 FORTRA: BUSINESS OVERVIEW
                       TABLE 244 FORTRA: PRODUCTS/SOLUTIONS/SERVICES OFFERED
                       TABLE 245 FORTRA: DEALS
             12.1.14 SOPHOS
                       TABLE 246 SOPHOS: BUSINESS OVERVIEW
                       TABLE 247 SOPHOS: PRODUCTS/SOLUTIONS/SERVICES OFFERED
                       TABLE 248 SOPHOS: PRODUCT LAUNCHES
                       TABLE 249 SOPHOS: DEALS
             12.1.15 TREND MICRO
                       TABLE 250 TREND MICRO: BUSINESS OVERVIEW
                       FIGURE 49 TREND MICRO: COMPANY SNAPSHOT
                       TABLE 251 TREND MICRO: PRODUCTS/SOLUTIONS/SERVICES OFFERED
                       TABLE 252 TREND MICRO: PRODUCT LAUNCHES
             12.1.16 SECLORE
                       TABLE 253 SECLORE: BUSINESS OVERVIEW
                       TABLE 254 SECLORE: PRODUCTS/SOLUTIONS/SERVICES OFFERED
                       TABLE 255 SECLORE: PRODUCT LAUNCHES
                       TABLE 256 SECLORE: DEALS
*Details on Business overview, Products/Solutions/Services offered, Recent developments & MnM View might not be captured in case of unlisted companies.
     12.2 OTHER PLAYERS 
             12.2.1 EGRESS SOFTWARE
             12.2.2 ECHOWORX
             12.2.3 LUXSCI
             12.2.4 NEOCERTIFIED
             12.2.5 SSH COMMUNICATION
             12.2.6 RETARUS
             12.2.7 PAUBOX
             12.2.8 PREVEIL
             12.2.9 SEALIT TECHNOLOGIES
             12.2.10 SENDSAFELY
             12.2.11 ZIVVER
 
13 ADJACENT MARKETS (Page No. - 268)
     13.1 INTRODUCTION 
               TABLE 257 ADJACENT MARKETS AND FORECASTS
     13.2 LIMITATIONS 
             13.2.1 CERTIFICATE AUTHORITY MARKET
                       TABLE 258 CERTIFICATE AUTHORITY MARKET, BY COMPONENT, 2016–2020 (USD THOUSAND)
                       TABLE 259 CERTIFICATE AUTHORITY MARKET, BY COMPONENT, 2021–2026 (USD THOUSAND)
                       TABLE 260 CERTIFICATE AUTHORITY MARKET, BY CERTIFICATE TYPE, 2016–2020 (USD THOUSAND)
                       TABLE 261 CERTIFICATE AUTHORITY MARKET, BY CERTIFICATE TYPE, 2021–2026 (USD THOUSAND)
                       TABLE 262 CERTIFICATE AUTHORITY MARKET, BY SERVICE, 2016–2020 (USD THOUSAND)
                       TABLE 263 CERTIFICATE AUTHORITY MARKET, BY SERVICE, 2021–2026 (USD THOUSAND)
                       TABLE 264 CERTIFICATE AUTHORITY MARKET, BY ORGANIZATION SIZE, 2016–2020 (USD THOUSAND)
                       TABLE 265 CERTIFICATE AUTHORITY MARKET, BY ORGANIZATION SIZE, 2021–2026 (USD THOUSAND)
                       TABLE 266 CERTIFICATE AUTHORITY MARKET, BY VERTICAL, 2016–2020 (USD THOUSAND)
                       TABLE 267 CERTIFICATE AUTHORITY MARKET, BY VERTICAL, 2021–2026 (USD THOUSAND)
                       TABLE 268 CERTIFICATE AUTHORITY MARKET, BY REGION, 2016–2020 (USD THOUSAND)
                       TABLE 269 CERTIFICATE AUTHORITY MARKET, BY REGION, 2021–2026 (USD THOUSAND)
             13.2.2 BUSINESS EMAIL COMPROMISE MARKET
                       TABLE 270 BUSINESS EMAIL COMPROMISE MARKET, BY OFFERING, 2016–2021 (USD MILLION)
                       TABLE 271 BUSINESS EMAIL COMPROMISE MARKET, BY OFFERING, 2022–2027 (USD MILLION)
                       TABLE 272 BUSINESS EMAIL COMPROMISE MARKET, BY DEPLOYMENT MODE, 2016–2021 (USD MILLION)
                       TABLE 273 BUSINESS EMAIL COMPROMISE MARKET, BY DEPLOYMENT MODE, 2022–2027 (USD MILLION)
                       TABLE 274 BUSINESS EMAIL COMPROMISE MARKET, BY ORGANIZATION SIZE, 2016–2021 (USD MILLION)
                       TABLE 275 BUSINESS EMAIL COMPROMISE MARKET, BY ORGANIZATION SIZE, 2022–2027 (USD MILLION)
                       TABLE 276 BUSINESS EMAIL COMPROMISE MARKET, BY VERTICAL, 2016–2021 (USD MILLION)
                       TABLE 277 BUSINESS EMAIL COMPROMISE MARKET, BY VERTICAL, 2022–2027 (USD MILLION)
                       TABLE 278 BUSINESS EMAIL COMPROMISE MARKET, BY REGION, 2016–2021 (USD MILLION)
                       TABLE 279 BUSINESS EMAIL COMPROMISE MARKET, BY REGION, 2022–2027 (USD MILLION)
             13.2.3 ENCRYPTION SOFTWARE MARKET
                       TABLE 280 ENCRYPTION SOFTWARE MARKET, BY COMPONENT, 2015–2020 (USD MILLION)
                       TABLE 281 ENCRYPTION SOFTWARE MARKET, BY COMPONENT, 2021–2026 (USD MILLION)
                       TABLE 282 ENCRYPTION SOFTWARE MARKET, BY SERVICE, 2015–2020 (USD MILLION)
                       TABLE 283 ENCRYPTION SOFTWARE MARKET, BY SERVICE, 2021–2026 (USD MILLION)
                       TABLE 284 ENCRYPTION SOFTWARE MARKET, BY APPLICATION, 2015–2020 (USD MILLION)
                       TABLE 285 ENCRYPTION SOFTWARE MARKET, BY APPLICATION, 2021–2026 (USD MILLION)
                       TABLE 286 ENCRYPTION SOFTWARE MARKET, BY DEPLOYMENT MODE, 2015–2020 (USD MILLION)
                       TABLE 287 ENCRYPTION SOFTWARE MARKET, BY DEPLOYMENT MODE, 2021–2026 (USD MILLION)
                       TABLE 288 ENCRYPTION SOFTWARE MARKET, BY ORGANIZATION SIZE, 2015–2020 (USD MILLION)
                       TABLE 289 ENCRYPTION SOFTWARE MARKET, BY ORGANIZATION SIZE, 2021–2026 (USD MILLION)
                       TABLE 290 ENCRYPTION SOFTWARE MARKET, BY VERTICAL, 2015–2020 (USD MILLION)
                       TABLE 291 ENCRYPTION SOFTWARE MARKET, BY VERTICAL, 2021–2026 (USD MILLION)
 
14 APPENDIX (Page No. - 280)
     14.1 DISCUSSION GUIDE 
     14.2 KNOWLEDGESTORE: MARKETSANDMARKETS’ SUBSCRIPTION PORTAL 
     14.3 CUSTOMIZATION OPTIONS 
     14.4 RELATED REPORTS 
     14.5 AUTHOR DETAILS 

The study involved significant activities in estimating the current market size for Email Encryption. Intensive secondary research was conducted to collect information about Email Encryption and related ecosystems. The industry executives validated these findings, assumptions, and sizing across the value chain using a primary research process as a next step. Top-down and bottom-up market estimation approaches were used to estimate the market size globally, followed by the market breakup and data triangulation procedures to assess the market segment and sub-segments in Email Encryption.

Secondary Research Process:

In the secondary research process, various sources were referred to for identifying and collecting information regarding Email Encryption. These sources include annual reports, press releases, Email Encryption software and service vendor investor presentations, forums, vendor-certified publications, and industry/association white papers. These secondary sources were utilized to obtain key information about Email Encryption’s solutions and services supply & value chain, a list of 100+ key players and SMEs, market classification, and segmentation per the industry trends and regional markets. The secondary research also gives us insights into the key developments from market and technology perspectives, which primary respondents further validated.

The factors considered for estimating the regional market size include technological initiatives undertaken by governments of different countries, gross domestic product (GDP) growth, ICT spending, recent market developments, and market ranking analysis of primary Email Encryption solutions and service vendors.

Primary Research Process:

We have conducted primary research with industry executives from both the supply and demand sides. The primary sources from the supply side include chief executive officers (CEOs), vice presidents (VPs), marketing directors, and technology and innovation executives of key companies operating in the Email Encryption market. We have conducted primary interviews with the executives to obtain qualitative and quantitative information for Email Encryption.

The market engineering process implemented the top-down and bottom-up approaches and various data triangulation methods to estimate and forecast the market segments and subsegments. During the post-market engineering process, we conducted primary research to verify and validate the critical numbers we arrived at. The primary analysis was also undertaken to identify the segmentation types, industry trends, the competitive landscape of the Email Encryption market players, and fundamental market dynamics, such as drivers, restraints, opportunities, challenges, industry trends, and key strategies.

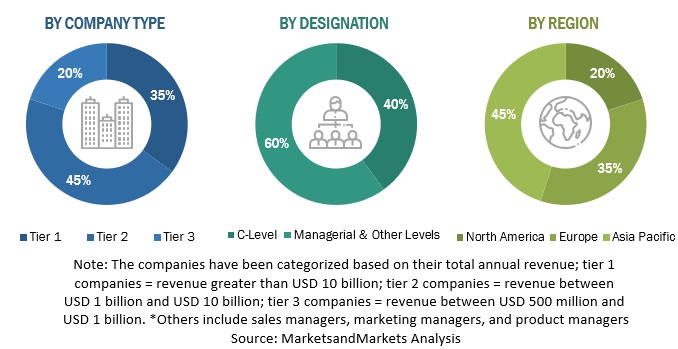
Following is the breakup of the primary research:
Email Encryption Market Size, and Share

To know about the assumptions considered for the study, download the pdf brochure

Market Size Estimation Process:

Both top-down and bottom-up approaches were implemented for market size estimation to estimate, project, and forecast the size of the global and other dependent sub-segments in the overall Email Encryption market.

The research methodology that has been used to estimate the market size includes these steps:

  • The key players, SMEs, and startups were identified through secondary sources. Their revenue contributions in the market were determined through primary and secondary sources.
  • Annual and financial reports of the publicly listed market players were considered for the company’s revenue details, and,
  • Primary interviews were also conducted with industry leaders to collect information about their companies, competitors, and key players in the market.
  • All percentage splits and breakups were determined using secondary sources and verified through primary sources. 

Top-down and Bottom-up Approach-
Email Encryption Market Size, and Share

To know about the assumptions considered for the study, Request for Free Sample Report

Data Triangulation

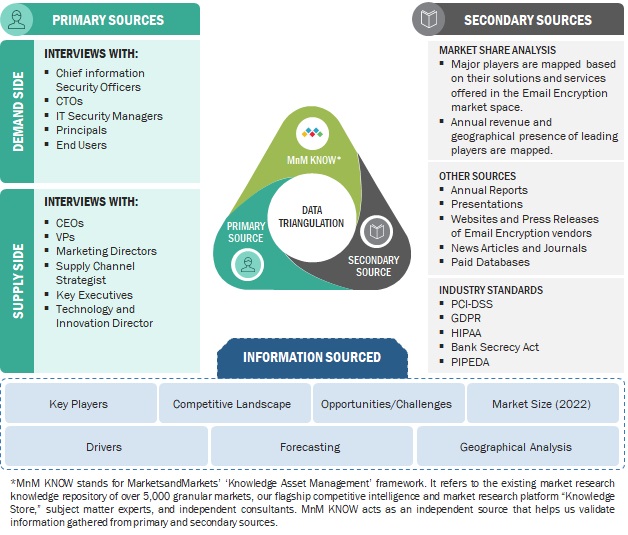
Data triangulation is a crucial step in the market engineering process for Email Encryption. It involves utilizing multiple data sources and methodologies to validate and cross-reference findings, thereby enhancing the reliability and accuracy of the market segment and subsegment statistics. To conduct data triangulation, various factors and trends related to the Email Encryption market are studied from both the demand and supply sides. It includes analyzing data from diverse sources such as market research reports, industry publications, regulatory bodies, financial institutions, and technology providers. By examining data from different perspectives and sources, data triangulation helps mitigate potential biases and discrepancies. It provides a more comprehensive understanding of the market dynamics, including the size, growth rate, market trends, and customer preferences.

Furthermore, data triangulation aids in identifying any inconsistencies or outliers in the data, enabling researchers to refine their analysis and make informed decisions. It strengthens the credibility of the market engineering process by ensuring that the conclusions drawn are based on robust and corroborated data. Data triangulation is a rigorous and systematic approach that enhances the reliability and validity of market segment and subsegment statistics in Email Encryption. It provides a solid foundation for informed decision-making and strategic planning within the industry.

Market Definition

As defined by MarketsandMarkets, Email encryption is a security measure that employs cryptographic methods to shield email contents from unsolicited access. This ensures the preservation of the relayed information’s secrecy and reliability. Additionally, when emails are encrypted, the content, attachments, and occasionally the metadata gets converted into an encoded or ciphertext form, making it inaccessible to anyone lacking the necessary decryption key.

Key Stakeholders

  • Government agencies
  • Email encryption solution vendors
  • Open-source providers
  • Internet service providers
  • Independent software vendors
  • Cloud service providers
  • Third-party providers
  • System integrators
  • Value-Added Resellers (VARs)
  • Information Technology (IT) security agencies
  • Research organizations

Report Objectives

  • To define, describe, and forecast the Email Encryption market based on offering, deployment, verticals, and regions:
  • To predict and estimate the market size of five main regions: North America, Europe, Asia Pacific, Middle East & Africa, and Latin America
  • To analyze the subsegments of the market with respect to individual growth trends, prospects, and contributions to the overall market
  • To provide detailed information related to the primary factors (drivers, restraints, opportunities, and challenges) influencing the growth of the market
  • To analyze opportunities in the market for stakeholders by identifying high-growth segments of the market
  • To profile the key players of the market and comprehensively analyze their market size and core competencies. 
  • Track and analyze competitive developments, such as new product launches, mergers and acquisitions, partnerships, agreements, and collaborations in the global Email Encryption market.

Customization Options

With the given market data, MarketsandMarkets offers customizations based on company-specific needs. The following customization options are available for the report:

Geographic Analysis

  • Further breakup of the Asia Pacific market into countries contributing 75% to the regional Email Encryption market size
  • Further breakup of the North American market into countries contributing 75% to the regional market size
  • Further breakup of the Latin American market into countries contributing 75% to the regional market size
  • Further breakup of the Middle Eastern and African market into countries contributing 75% to the regional market size
  • Further breakup of the European market into countries contributing 75% to the regional market size

Company Information

  • Detailed analysis and profiling of additional market players (up to 5)
Custom Market Research Services

We will customize the research for you, in case the report listed above does not meet with your exact requirements. Our custom research will comprehensively cover the business information you require to help you arrive at strategic and profitable business decisions.

Request Customization

Instant Answers with GPT - Ask Now!

Ask real questions. Get complete answers !
Report Code
TC 3895
Published ON
Oct, 2023
Choose License Type
BUY NOW
  • SHARE
X
Request Customization
Speak to Analyst
Speak to Analyst
OR FACE-TO-FACE MEETING
PERSONALIZE THIS RESEARCH
  • Triangulate with your Own Data
  • Get Data as per your Format and Definition
  • Gain a Deeper Dive on a Specific Application, Geography, Customer or Competitor
  • Any level of Personalization
REQUEST A FREE CUSTOMIZATION
LET US HELP YOU!
  • What are the Known and Unknown Adjacencies Impacting the Email Encryption Market
  • What will your New Revenue Sources be?
  • Who will be your Top Customer; what will make them switch?
  • Defend your Market Share or Win Competitors
  • Get a Scorecard for Target Partners
CUSTOMIZED WORKSHOP REQUEST
+1-888-600-6441
  • Call Us
  • +1-888-600-6441 (Corporate office hours)
  • +1-888-600-6441 (US/Can toll free)
  • +44-800-368-9399 (UK office hours)
CONNECT WITH US
ABOUT TRUST ONLINE
©2024 MarketsandMarkets Research Private Ltd. All rights reserved
DMCA.com Protection Status Website Feedback