Embedded Analytics Market by Component (Software and Services), Business Function (IT, Marketing and Sales, Finance, Production, and HR), Deployment Model (On-Premises and On-Demand), Organization Size, Industry, and Region - Global Forecast to 2022


[169 Pages Report] The global embedded analytics market is expected to grow from USD 26.77 billion in 2017 to USD 51.78 billion by 2022 at a CAGR of 14.1% during the forecast period. Embedded analytics offers crucial benefits, such as cutting inevitable losses, creating new opportunities, saving costs by ensuring uninterrupted operations, and increasing efficiency by analyzing and acting on any business issue in real time, to enterprises. In the coming years, more applications will be equipped with advanced analytics capabilities, thus driving the growth of embedded analytics market. Major business functions that are adopting embedded analytics software and services are IT, marketing and sales, finance, Human Resources (HR), production, and others (product development and legal). The base year considered for the study is 2016, and the forecast has been provided for the period between 2017 and 2022.
Selected Market Dynamics in Embedded Analytics Market
Rise of data-driven organizations
Organizations are always eager to unlock values classified inside the massive volume of collected data. Data-driven decision-making helps employees make informed decisions, which eventually enables organizations to beat their competition. Employees need to analyze and explore the available data to make the best decisions. They need applications integrated with analytics to help them make sense of data. The need for analytics has changed the expectations that employees have from software. Employees expect applications they use to be equipped with customizable reports and dashboards, and want a quick and easy interaction with data sets. The increasing complexity and variations in data sets is creating increasing demand for embedded analytics to help customers gain the insights they need, without any delay. To build a data-driven organization, it is vital that the relevant information is available in the context of the applications that people access every day. Embedded analytics provides software and services that can be used to process and analyze data within an application to generate valuable insights, which helps in data-driven decision-making. Hence, the rise of data-driven organizations is expected to further drive growth of the embedded analytics market.
Lack of integration with legacy systems and higher replacement cost
Adoption of embedded analytics for various applications has surged. However, it is crucial to integrate such data management systems alongside well-established, legacy, and proven systems. Legacy systems could have major flaws, as these systems do not have well-defined interfaces and their documentation is scarce. The possibility of errors such as incorrect or inadequate data increases manifold, as the legacy systems sometimes lack compatibility with new APIs. Further, traditional applications may not always be compatible with the third-party software used for embedded analytics, thus causing errors. The integration of analytics into an application can be a complicated task for enterprises as it can affect the system�s performance. Further, organizations already benefit from traditional BI tools and are skeptical about using the embedded tools present in an application. Though there are plenty of benefits of adopting embedded analytics, the cost of replacing traditional systems with a suitable embedded analytics software, implementing it in the organization, and maintaining and training the employees on using it remain very high.
To know about the assumptions considered for the study, download the pdf brochure
The following are the major objectives of the study.
- To describe and forecast the embedded analytics market on the basis of components (software and services), business functions, deployment models, organization sizes, industries, and regions
- To provide a detailed information regarding the major factors influencing the growth of the market (drivers, restraints, opportunities, and challenges)
- To analyze the subsegments with respect to individual growth trends, prospects, and contribution to the total market
- To analyze the opportunities in the market for stakeholders and provide the details of a competitive landscape for the major players
- To forecast the revenue of market segments with respect to all the major regions, namely, North America, Europe, Asia Pacific (APAC), Latin America, and Middle East and Africa (MEA)
- To profile the key players and comprehensively analyze their recent developments and positioning
- To analyze competitive developments, such as mergers and acquisitions, new product launches, and R&D activities in the market
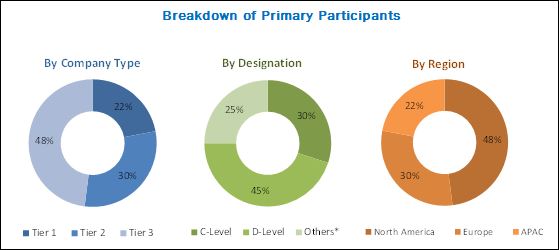
The research methodology used to estimate and forecast the embedded analytics market began with capturing the data on key vendor�s revenues through secondary research sources, such as companies� websites, Factiva, and Hoovers. The other secondary sources included annual reports, press releases, and investor presentations of companies; white papers and certified publications; and articles from recognized authors, directories, and databases. The vendor offerings were also taken into consideration to determine the market segmentation. The bottom-up procedure was employed to arrive at the overall market size of the global embedded analytics market from the revenue of the key players in the market. After arriving at the overall market size, the total market was split into several segments and subsegments, which were then verified through primary research by conducting extensive interviews with the key people, such as Chief Executive Officers (CEOs), Vice Presidents (VPs), directors, and executives. The data triangulation and market breakdown procedures were employed to complete the overall market engineering process and arrive at the exact statistics for all the segments and subsegments. The breakdown of profiles of primary is depicted in the below figure.
The embedded analytics ecosystem comprises vendors, such as Microsoft Corporation (US), IBM (US), SAP SE (Germany), SAS Institute (US), Oracle Corporation (US), MicroStrategy Incorporated (US), Tableau Software (US), TIBCO Software (US), Birst (US), Logi Analytics (US), QlikTech International (US), Sisense (US), Information Builders (US), OpenText (Canada), and Yellowfin International (Australia). These Embedded Analytics Software Vendors are rated and listed by us on the basis of product quality, reliability, and their business strategy. Please visit 360Quadrants to see the vendor listing of Embedded Analytics Software.
Major Market Developments in Embedded Analytics Market:
- In May 2017, Microsoft introduced Power Business Intelligence (BI) Premium, which builds on the existing Power BI portfolio, with a capacity-based licensing model that increases the flexibility in terms of accessing, sharing, and distributing the content. As a part of the new offering, Power BI Embedded is converged with the Power BI service, to deliver one API surface, a consistent set of capabilities and provides access to the latest features.
- In June 2017, IBM launched the first suite of cognitive solutions to help financial institution professionals manage their regulatory and fiduciary responsibilities. Its Watson-powered software can be deployed on the IBM Cloud and was designed to help financial professionals in 3 areas: understanding the regulatory requirements, delivering increased insights into potential financial crimes, and managing financial risks with a new architectural approach for data.
- In July 2017, OpenText launched OpenText Magellan, a flexible AI and analytics platform that combines open source machine learning with advanced analysis. It also has he capabilities to acquire, merge, manage, and analyze big data and big content.
Key Target Audience for Embedded Analytics Market
- Solution vendors
- Original equipment manufacturers
- System integrators
- Advisory firms
- National regulatory authorities
- Venture capitalists
- Private equity groups
- Investment houses
- Equity research firms
Scope of the Embedded Analytics Market research report
By Component
- Software
- Services
By Service
- Managed services
- Professional services
- Consulting services
- Education and training
- Support and maintenance
By Business Function
- IT
- Marketing and sales
- Production
- Finance
- Human resources (HR)
- Others (product development and legal)
By Deployment Model
- On-premises
- On-demand
By Organization Size
- Small and Medium-sized Enterprises (SMEs)
- Large enterprises
By Industry
- Banking, Financial Services, and Insurance (BFSI)
- Telecommunications and IT
- Retail and consumer goods
- Healthcare and life sciences
- Manufacturing
- Government
- Energy and utilities
- Media and entertainment
- Transportation and logistics
- Others (travel and hospitality, education, and outsourcing services)
By Region
- North America
- Europe
- APAC
- Latin America
- MEA
Critical questions which the report answers
- What are new application areas which the embedded analytics companies are exploring?
- Which are the key players in the market and how intense is the competition?
Available Customizations
With the given market data, MarketsandMarkets offers customizations as per the company�s specific needs. The following customization options are available for the report:
Geographic Analysis
- Further breakdown of the North American embedded analytics market
- Further breakdown of the European embedded analytics market
- Further breakdown of the APAC embedded analytics market
- Further breakdown of the MEA embedded analytics market
- Further breakdown of the Latin American embedded analytics market
Company Information
- Detailed analysis and profiling of additional market players
The global embedded analytics market is expected to grow from USD 26.77 billion in 2017 to USD 51.78 billion by 2022 at a CAGR of 14.1% during the forecast period. In the coming years, more applications will be equipped with advanced analytics capabilities, thus driving the growth of embedded analytics market. The major drivers of the embedded analytics market are rise of data-driven organizations, higher adoption of self-service analytics, and increasing demand to integrate analytics into business applications.
Embedded analytics enables business users to access business data and analyze them at any place and any time to generate insights within an application, even though they do not have data science and analytical skills. The origin of embedded analytics lies behind the need for real-time data analysis within an application, where decision makers can have quick access to data and analytical capabilities, thus enabling them to take required actions without the need of exporting the data. Embedded analytics further adds much more value to the application. Deeper the integration of analytics into an application, more is the value of the application.
The embedded analytics market is segmented by software and service. The services segment is expected to grow at the highest CAGR between 2017 and 2022, out of which, education and training services in the professional services segment is projected to witness the highest demand, due to the growing need of embedded analytics software solutions across organizations.
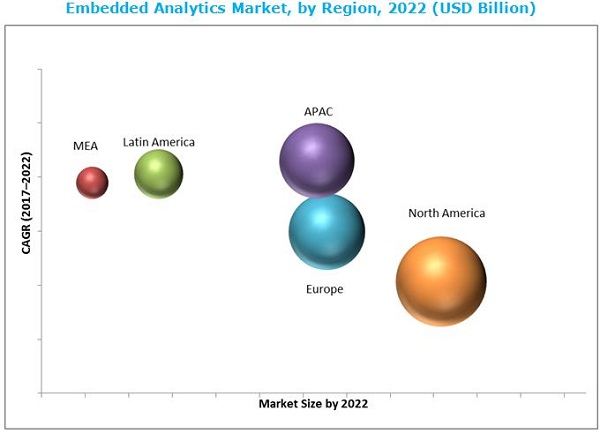
The embedded analytics market in APAC is expected to grow at the highest CAGR during the forecast period. This grow is mainly driven by the increasing amount of business data and Bring Your Own Device (BYOD) across various industries in this region. Nearly half of the internet-using population resides in APAC, thereby challenging the traditional business models and BI technologies, adopted by eCommerce companies operating in this region. Companies are adopting the embedded analytics technology to quickly delve into this vast amount of data generated and gain faster business insights. Globalization and developing the economy in this region are the major drivers behind the increased adoption of embedded analytics by various companies.
Embedded analytics applications in Information Technology (IT), production, and finance business functions drive the growth of embedded analytics market
Information Technology
IT departments are responsible for system implementations, support and strategic technology acquisitions in an organization. Costs, maintenance, time-to-deploy, and user adoption are some of the key metrics needed by IT teams during purchases and reporting on the success of projects. Analytics solutions deliver crucial insights into the data � from reporting on progress at-a-glance, to detailed analysis of process optimization. With an embedded analytics solution, IT teams can have access to real-time analytics on Key Performance Indicators (KPIs), visualization of the percentage of helpdesk ticket requests resolved in the agreed time-frame to assess the success of ongoing support, in their applications itself.
Production
Production teams can benefit by embedding analytics into process monitoring for preventive maintenance to predict risk of process failure or even events that might have a negative impact on product quality. This approach can be extended to intelligent monitoring of all kinds of processes in extreme environments. For example, off-shore oil platforms use predictive analytics to prevent breakdowns of their production processes by analyzing impacts of combination of events and optimal times for intervention. Based on historical data on actions taken to fix problems of the operational oil production process, the embedded analytics predict the risk of breakdowns, pinpoint the most likely cause, and suggest the best action to fix the problem.
Finance
The finance department of any organization always relies on data accuracy and its correct interpretation. Financial departments utilize the power of analytics to determine the risk factor, enhance business processes, invest judiciously, determine the profitability, identify the target customers, and predict future events. Along with this, analytics software also assists in improving client relations, driving revenue, managing risk, meeting regulatory obligations, streamlining back office processes, and developing high quality products and services.
Human Resources
Human Resources (HR) business function deploys embedded analytics capabilities for various processes, including planning for talent acquisition, attrition risk management, and employee sentiment analysis and capacity planning. The amount of data generated in HR business application is huge and organizations are aware that employee satisfaction is vital for their success. Hence, organizations having the HR business applications have considerably leveraged embedded analytics.
Critical questions the report answers:
- Where will all these developments take the industry in the mid to long term?
- What are the upcoming industry applications for embedded analytics?
Major vendors that offer embedded analytics software and services globally are Microsoft Corporation (US), IBM Corporation (US), SAP SE (Germany), SAS Institute (US), Oracle Corporation (US), MicroStrategy Incorporated (US), Tableau Software (US), TIBCO Software (US), Birst (US), Logi Analytics (US), QlikTech International (US), Sisense (US), Information Builders (US), Open Text Corporation (Canada), and Yellowfin International (Australia). These vendors adopted various types of organic as well as inorganic growth strategies, such as new product launches, product developments, partnerships, collaborations, and mergers and acquisitions, to expand their offerings in the embedded analytics market.
To speak to our analyst for a discussion on the above findings, click Speak to Analyst
Table of Contents
1 Introduction (Page No. - 16)
1.1 Objectives of the Study
1.2 Market Definition
1.3 Market Scope
1.4 Years Considered for the Study
1.5 Currency
1.6 Stakeholders
2 Research Methodology (Page No. - 19)
2.1 Research Data
2.1.1 Secondary Data
2.1.2 Primary Data
2.1.2.1 Breakdown of Primaries
2.1.2.2 Key Industry Insights
2.2 Market Size Estimation
2.3 Microquadrant Research Methodology
2.3.1 Vendor Inclusion Criteria
2.4 Research Assumptions and Limitations
2.4.1 Embedded Analytics Market: Assumptions
2.4.2 Limitations
3 Executive Summary (Page No. - 26)
4 Premium Insights (Page No. - 32)
4.1 Attractive Market Opportunities in the Embedded Analytics Market
4.2 Embedded Analytics Market: Market Share Across Various Regions
4.3 Embedded Analytics Market: Industry and Regions
4.4 Lifecycle Analysis, By Region, 2017
5 Market Overview and Industry Trends (Page No. - 36)
5.1 Market Overview
5.1.1 Introduction
5.1.2 Market Dynamics
5.1.2.1 Drivers
5.1.2.1.1 Rise of Data-Driven Organizations
5.1.2.1.2 Higher Adoption of Self-Service Analytics
5.1.2.1.3 Increasing Demand to Integrate Analytics Into Business Applications
5.1.2.2 Restraints
5.1.2.2.1 Lack of Integration With Legacy Systems and Higher Replacement Cost
5.1.2.3 Opportunities
5.1.2.3.1 Increasing Adoption of Mobile Bi and Cloud Computing
5.1.2.3.2 Higher Adoption By SMES
5.1.2.4 Challenges
5.1.2.4.1 Lack of Skilled Workforce
5.1.2.4.2 Managing Data Quality and Security
5.2 Industry Trends
5.2.1 Introduction
5.2.2 Embedded Analytics Use Cases
5.2.2.1 Introduction
5.2.2.2 Use Case #1
5.2.2.3 Use Case #2
5.2.2.4 Use Case #3
5.2.3 Key Benefits of Embedded Analytics
5.2.3.1 Higher Adoption Than Traditional Bi
5.2.3.2 Engaging End-Users
5.2.3.3 Adding Value to the Application
5.2.3.4 Improves the End-User Experience
5.2.3.5 Increases Revenue
6 Embedded Analytics Market Analysis, By Component (Page No. - 42)
6.1 Introduction
6.1.1 Software
6.1.2 Services
6.1.2.1 Professional Services
6.1.2.1.1 Consulting Services
6.1.2.1.2 Support and Maintenance
6.1.2.1.3 Education and Training
6.1.2.2 Managed Services
7 Embedded Analytics Market Analysis, By Business Function (Page No. - 51)
7.1 Introduction
7.2 Information Technology
7.3 Marketing and Sales
7.4 Finance
7.5 Production
7.6 Human Resources
7.7 Others
8 Embedded Analytics Market Analysis, By Deployment Model (Page No. - 59)
8.1 Introduction
8.2 On-Premises
8.3 On-Demand
9 Embedded Analytics Market Analysis, By Organization Size (Page No. - 63)
9.1 Introduction
9.2 Small and Medium-Sized Enterprises
9.3 Large Enterprises
10 Embedded Analytics Market Analysis, By Industry (Page No. - 67)
10.1 Introduction
10.2 Banking, Financial Services, and Insurance
10.3 Healthcare and Life Sciences
10.4 Manufacturing
10.5 Retail and Consumer Goods
10.6 Energy and Utilities
10.7 Telecommunications and IT
10.8 Transportation and Logistics
10.9 Government and Defense
10.10 Media and Entertainment
10.11 Others
11 Geographic Analysis (Page No. - 79)
11.1 Introduction
11.2 North America
11.2.1 By Country
11.2.1.1 Us
11.2.1.2 Canada
11.2.2 North America, By Component
11.2.3 North America, By Service
11.2.4 North America, By Professional Service
11.2.5 North America, By Business Function
11.2.6 North America, By Deployment Model
11.2.7 North America, By Organization Size
11.2.8 North America, By Industry
11.3 Europe
11.3.1 By Country
11.3.1.1 Uk
11.3.1.2 Germany
11.3.1.3 France
11.3.1.4 Rest of Europe
11.3.2 Europe, By Component
11.3.3 Europe, By Service
11.3.4 Europe, By Professional Service
11.3.5 Europe, By Business Function
11.3.6 Europe, By Deployment Model
11.3.7 Europe, By Organization Size
11.3.8 Europe, By Industry
11.4 Asia Pacific
11.4.1 By Country
11.4.1.1 China
11.4.1.2 Japan
11.4.1.3 Australia
11.4.1.4 India
11.4.1.5 Rest of Asia Pacific
11.4.2 Asia Pacific, By Component
11.4.3 Asia Pacific, By Service
11.4.4 Asia Pacific, By Professional Service
11.4.5 Asia Pacific, By Business Function
11.4.6 Asia Pacific, By Deployment Model
11.4.7 Asia Pacific, By Organization Size
11.4.8 Asia Pacific, By Industry
11.5 Latin America
11.5.1 By Country
11.5.1.1 Mexico
11.5.1.2 Brazil
11.5.1.3 Rest of Latin America
11.5.2 Latin America, By Component
11.5.3 Latin America, By Service
11.5.4 Latin America, By Professional Service
11.5.5 Latin America, By Business Function
11.5.6 Latin America, By Deployment Model
11.5.7 Latin America, By Organization Size
11.5.8 Latin America, By Industry
11.6 Middle East and Africa
11.6.1 By Country
11.6.1.1 Middle East
11.6.1.2 Africa
11.6.2 Middle East and Africa, By Component
11.6.3 Middle East and Africa, By Service
11.6.4 Middle East and Africa, By Professional Service
11.6.5 Middle East and Africa, By Business Function
11.6.6 Middle East and Africa, By Deployment Model
11.6.7 Middle East and Africa, By Organization Size
11.6.8 Middle East and Africa, By Industry
12 Competitive Landscape (Page No. - 106)
12.1 Microquadrant Overview
12.1.1 Visionary Leaders
12.1.2 Innovators
12.1.3 Dynamic Differentiators
12.1.4 Emerging Companies
12.2 Competitive Benchmarking
12.2.1 Strength of Product Portfolio in the Embedded Analytics Market (25 Players)
12.2.2 Business Strategy Excellence Adopted in the Embedded Analytics Market (25 Players)
13 Company Profiles (Page No. - 110)
(Overview, Strength of Product Portfolio, Business Strategy Excellence, Recent Developments)*
13.1 International Business Machines Corporation
13.2 Microsoft Corporation
13.3 Opentext Corporation
13.4 Oracle Corporation
13.5 SAP SE
13.6 SAS Institute
13.7 Tableau Software Inc.
13.8 BIRST, Inc.
13.9 Information Builders
13.10 Logi Analytics
13.11 Microstrategy Incorporated
13.12 Sisense, Inc.
13.13 Tibco Software, Inc.
13.14 Qliktech International Ab
13.15 Yellowfin International Pty Ltd
*Details on Overview, Strength of Product Portfolio, Business Strategy Excellence, Recent Developments Might Not Be Captured in Case of Unlisted Companies.
14 Appendix (Page No. - 159)
14.1 Insights of Industry Experts
14.2 Discussion Guide
14.3 Knowledge Store: Marketsandmarkets� Subscription Portal
14.4 Introducing RT: Real-Time Market Intelligence
14.5 Available Customization
14.6 Related Reports
14.7 Author Details
List of Tables (72 Tables)
Table 1 United States Dollar Exchange Rate, 2014�2016
Table 2 Evaluation Criteria
Table 3 Embedded Analytics Market Size, By Component, 2015�2022 (USD Billion)
Table 4 Software: Market Size, By Region, 2015�2022 (USD Million)
Table 5 Services: Market Size, By Type, 2015�2022 (USD Billion)
Table 6 Services: Market Size, By Region, 2015�2022 (USD Million)
Table 7 Professional Services Market Size, By Type, 2015�2022 (USD Billion)
Table 8 Professional Services Market Size, By Region, 2015�2022 (USD Million)
Table 9 Consulting Services Market Size, By Region, 2015�2022 (USD Million)
Table 10 Support and Maintenance Services Market Size, By Region, 2015�2022 (USD Million)
Table 11 Education and Training Services Market Size, By Region, 2015�2022 (USD Million)
Table 12 Managed Services Market Size, By Region, 2015�2022 (USD Million)
Table 13 Embedded Analytics Market Size, By Business Function, 2015�2022 (USD Billion)
Table 14 Information Technology: Market Size, By Region, 2015�2022 (USD Million)
Table 15 Marketing and Sales: Market Size, By Region, 2015�2022 (USD Million)
Table 16 Finance: Market Size, By Region, 2015�2022 (USD Million)
Table 17 Production: Market Size, By Region, 2015�2022 (USD Million)
Table 18 Human Resources: Market Size, By Region, 2015�2022 (USD Million)
Table 19 Others: Market Size, By Region, 2015�2022 (USD Million)
Table 20 Embedded Analytics Market Size, By Deployment Model, 2015�2022 (USD Billion)
Table 21 On-Premises: Market Size, By Region, 2015�2022 (USD Million)
Table 22 On-Demand: Market Size, By Region, 2015�2022 (USD Million)
Table 23 Embedded Analytics Market Size, By Organization Size, 2015�2022 (USD Billion)
Table 24 Small and Medium-Sized Enterprises: Market Size, By Region, 2015�2022 (USD Million)
Table 25 Large Enterprises: Market Size, By Region, 2015�2022 (USD Million)
Table 26 Embedded Analytics Market Size, By Industry, 2015�2022 (USD Billion)
Table 27 Banking, Financial Services, and Insurance: Market Size, By Region, 2015�2022 (USD Million)
Table 28 Healthcare and Life Sciences: Market Size, By Region, 2015�2022 (USD Million)
Table 29 Manufacturing: Market Size, By Region, 2015�2022 (USD Million)
Table 30 Retail and Consumer Goods: Market Size, By Region, 2015�2022 (USD Million)
Table 31 Energy and Utilities: Market Size, By Region, 2015�2022 (USD Million)
Table 32 Telecommunications and IT: Market Size, By Region, 2015�2022 (USD Million)
Table 33 Transportation and Logistics: Market Size, By Region, 2015�2022 (USD Million)
Table 34 Government and Defense: Market Size, By Region, 2015�2022 (USD Million)
Table 35 Media and Entertainment: Market Size, By Region, 2015�2022 (USD Million)
Table 36 Others: Market Size, By Region, 2015�2022 (USD Million)
Table 37 Embedded Analytics Market Size, By Region, 2015�2022 (USD Billion)
Table 38 North America: Market Size, By Component, 2015�2022 (USD Million)
Table 39 North America: Market Size, By Service, 2015�2022 (USD Million)
Table 40 North America: Market Size, By Professional Service, 2015�2022 (USD Million)
Table 41 North America: Market Size, By Business Function, 2015�2022 (USD Million)
Table 42 North America: Market Size, By Deployment Model, 2015�2022 (USD Million)
Table 43 North America: Market Size, By Organization Size , 2015�2022 (USD Million)
Table 44 North America: Market Size, By Industry, 2015�2022 (USD Million)
Table 45 Europe: Embedded Analytics Market Size, By Component, 2015�2022 (USD Million)
Table 46 Europe: Market Size, By Service, 2015�2022 (USD Million)
Table 47 Europe: Market Size, By Professional Service, 2015�2022 (USD Million)
Table 48 Europe: Market Size, By Business Function, 2015�2022 (USD Million)
Table 49 Europe: Market Size, By Deployment Model, 2015�2022 (USD Million)
Table 50 Europe: Market Size, By Organization Size, 2015�2022 (USD Million)
Table 51 Europe: Market Size, By Industry, 2015�2022 (USD Million)
Table 52 Asia Pacific: Embedded Analytics Market Size, By Component, 2015�2022 (USD Million)
Table 53 Asia Pacific: Market Size, By Service, 2015�2022 (USD Million)
Table 54 Asia Pacific: Market Size, By Professional Service, 2015�2022 (USD Million)
Table 55 Asia Pacific: Market Size, By Business Function, 2015�2022 (USD Million)
Table 56 Asia Pacific: Market Size, By Deployment Model, 2015�2022 (USD Million)
Table 57 Asia Pacific: Market Size, By Organization Size, 2015�2022 (USD Million)
Table 58 Asia Pacific: Market Size, By Industry, 2015�2022 (USD Million)
Table 59 Latin America: Embedded Analytics Market Size, By Component, 2015�2022 (USD Million)
Table 60 Latin America: Market Size, By Service, 2015�2022 (USD Million)
Table 61 Latin America: Market Size, By Professional Service, 2015�2022 (USD Million)
Table 62 Latin America: Market Size, By Business Function, 2015�2022 (USD Million)
Table 63 Latin America: Market Size, By Deployment Model, 2015�2022 (USD Million)
Table 64 Latin America: Market Size, By Organization Size, 2015�2022 (USD Million)
Table 65 Latin America: Market Size, By Industry, 2015�2022 (USD Million)
Table 66 Middle East and Africa: Embedded Analytics Market Size, By Component, 2015�2022 (USD Million)
Table 67 Middle East and Africa: Market Size, By Service, 2015�2022 (USD Million)
Table 68 Middle East and Africa: Market Size, By Professional Service, 2015�2022 (USD Million)
Table 69 Middle East and Africa: Market Size, By Business Function, 2015�2022 (USD Million)
Table 70 Middle East and Africa: Market Size, By Deployment Model, 2015�2022 (USD Million)
Table 71 Middle East and Africa: Market Size, By Organization Size , 2015�2022 (USD Million)
Table 72 Middle East and Africa: Market Size, By Industry, 2015�2022 (USD Million)
List of Figures (40 Figures)
Figure 1 Embedded Analytics Market: Market Segmentation
Figure 2 Market: Research Design
Figure 3 Data Triangulation
Figure 4 Market Size Estimation Methodology: Bottom-Up Approach
Figure 5 Market Size Estimation Methodology: Top-Down Approach
Figure 6 Embedded Analytics Market is Expected to Witness Growth in the Global Market Between 2017 and 2022
Figure 7 Embedded Analytics Market Snapshot, By Component (2017 vs 2022)
Figure 8 Market Snapshot, By Service (2017�2022)
Figure 9 Market Snapshot, By Professional Service (2017�2022)
Figure 10 Market Snapshot, By Business Function (2017�2022)
Figure 11 Market Snapshot, By Deployment Model (2017�2022)
Figure 12 Market Snapshot, By Organization Size (2017�2022)
Figure 13 Market Snapshot, By Industry (2017 vs 2022)
Figure 14 Increasing Need for Competitive Insights Within an Application is the Major Factor Contributing to the Growth of the Embedded Analytics Market
Figure 15 North America is Estimated to Hold the Largest Market Share in 2017
Figure 16 Banking, Financial Services, and Insurance Industry and North America are Estimated to Have the Largest Market Shares in 2017
Figure 17 Asia Pacific is Expected to Enter the Exponential Growth Phase During the Forecast Period
Figure 18 Embedded Analytics Market: Drivers, Restraints, Opportunities, and Challenges
Figure 19 Growth of Global Self-Service Bi Market
Figure 20 Global Mobile Bi Market
Figure 21 Software Segment is Expected to Have the Larger Market Size During the Forecast Period
Figure 22 Professional Services Segment is Expected to Have the Larger Market Size During the Forecast Period
Figure 23 Education and Training Segment is Expected to Grow at the Highest CAGR During the Forecast Period
Figure 24 Information Technology Segment is Expected to Have the Largest Market Size During the Forecast Period
Figure 25 On-Premises Deployment Model is Expected to Have the Larger Market Size During the Forecast Period
Figure 26 Large Enterprises Segment is Expected to Have the Larger Market Size During the Forecast Period
Figure 27 Banking, Financial Services, and Insurance Industry is Expected to Have the Largest Market Size During the Forecast Period
Figure 28 Asia Pacific is Expected to Grow at the Highest CAGR in the Embedded Analytics Market During the Forecast Period
Figure 29 North America is Expected to Have the Largest Market Size in the Embedded Analytics Market During the Forecast Period
Figure 30 North America: Market Snapshot
Figure 31 Asia Pacific: Market Snapshot
Figure 32 Embedded Analytics Market (Global), Competitive Leadership Mapping, 2017
Figure 33 International Business Machines Corporation: Company Snapshot
Figure 34 Microsoft Corporation: Company Snapshot
Figure 35 Opentext Corporation: Company Snapshot
Figure 36 Oracle Corporation: Company Snapshot
Figure 37 SAP SE: Company Snapshot
Figure 38 SAS Institute: Company Snapshot
Figure 39 Tableau Software Inc.: Company Snapshot
Figure 40 Microstrategy Incorporated: Company Snapshot


Growth opportunities and latent adjacency in Embedded Analytics Market