EMI Shielding Market by Material (Conductive Coatings & Paints, Conductive Polymers, Conductive Elastomers, Metal Shielding, EMI Shielding Tapes, EMI/EMC Filters), Method (Radiation, Conduction), Load Type, Industry & Region - Global Forecast to 2028
[210 Pages Report] The global EMI shielding market was valued at USD 7.0 billion in 2023 and is estimated to reach USD 9.4 billion by 2028, registering a CAGR of 5.9% during the forecast period. Growing industrialization and increasing demand for consumer electronics has driven the demand for EMI shielding. Also, the stringent government regulations in various industries such as automotive, consumer electronics and telecom, and incrasing investments by the manufacturers for expansion are fueling the market growth.
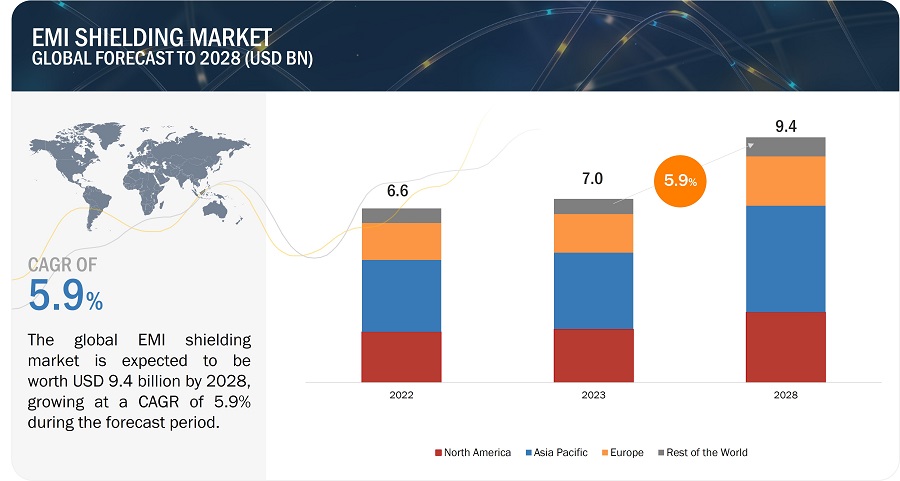
EMI Shielding Market Forecast to 2028
To know about the assumptions considered for the study, Request for Free Sample Report
Market Dynamics:
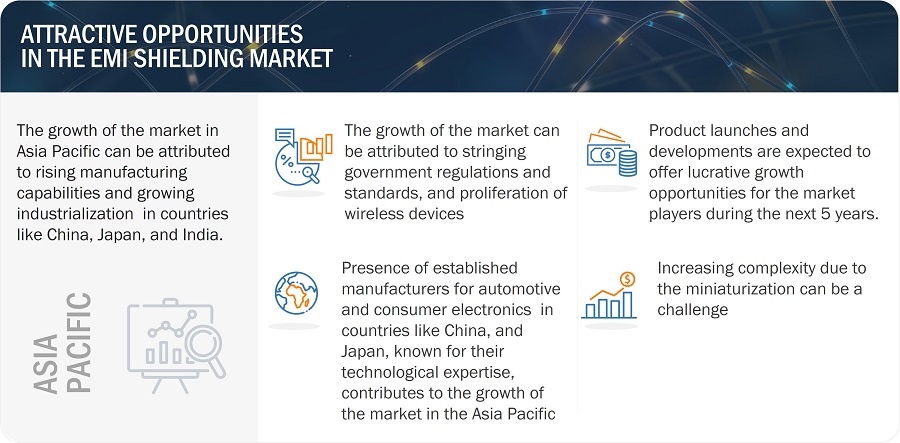
Driver: Rapid industrialization across the globe
As industries modernize and expand, they increasingly rely on electronic and wireless devices to improve productivity, efficiency, and automation. However, this proliferation of electronic equipment and machinery can lead to a denser electromagnetic environment within industrial settings. With numerous devices operating simultaneously, the risk of electromagnetic interference (EMI) also escalates. EMI can disrupt the proper functioning of critical industrial equipment, potentially causing operational inefficiencies, data corruption, and even safety hazards. To mitigate these risks and ensure the uninterrupted operation of industrial machinery, EMI shielding becomes essential.
Restraint: Limited effectiveness of traditional methods
Traditional EMI shielding methods, which typically involve adding layers of shielding materials like metal or conductive coatings, are proving inadequate for protecting contemporary electronic devices from electromagnetic interference (EMI). These conventional approaches face challenges in the field of modern electronics for several reasons. These factors may hamper the growth of the market.
Opportunity: Rising adoption of innovative electronics in various sectors
The widespread adoption of cutting-edge electronics across diverse industries presents a substantial opportunity for the EMI shielding market to expand. For instance, the growing prevalence of digital healthcare solutions, including medical devices and telemedicine, opens doors for EMI shielding providers. As the healthcare sector becomes increasingly dependent on electronic systems, the demand for effective EMI shielding to safeguard patient safety and data integrity becomes paramount. Additionally, the increasing integration of components, such as integrated circuits (ICs) and antennas, within the same semiconductor package, drives the need for package-level EMI shielding solutions. This trend creates opportunities for EMI shielding providers to develop innovative materials and technologies to address the evolving needs of the electronics industry. Overall, the increasing adoption of innovative electronics across various industries, coupled with the growing emphasis on technological advancements and environmental concerns, fosters a favorable market environment for EMI shielding solutions.
Challenge: Increasing complexity due to miniaturization
As electronic devices shrink in size and complexity, traditional EMI shielding methods, often involving the addition of bulky shielding materials, encounter limitations due to the restricted space available in these miniature devices. The compactness of components and their close proximity make it challenging to identify and mitigate EMI issues within these devices. Conventional EMI shielding solutions, such as metal sheets, prove unsuitable for these smaller devices as they cannot be seamlessly integrated into existing designs. This constraint necessitates the development of innovative and space-efficient EMI shielding solutions that can effectively protect smaller electronic devices from electromagnetic interference without compromising their form factor or functionality. This demand for innovative shielding solutions drives up the product cost in the EMI shielding market.
Emi Shielding Market Ecosystem
The EMI shielding market is consolidated, with major companies such as Parker Hannifin Corp, PPG Industries Inc., 3M, Henkel, Laird Technologies Inc. and numerous small- and medium-sized enterprises. Almost all players offer various products in EMI shielding. These products are used for applications including consumer electronics, automotive, telecom and information technology, aerospace, healthcare, and others.
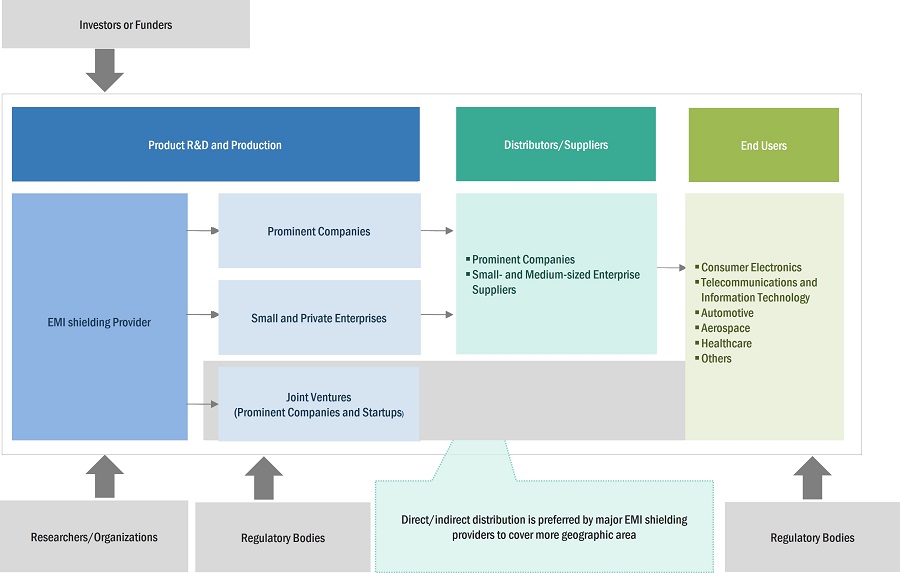
Based on method, radiation segment is expected to dominate during the forecast period.
Radiation-based shielding methods have emerged as a dominant force in the EMI shielding market due to their versatility, effectiveness, and cost-effectiveness. These methods, which involve the use of electromagnetic waves to block or attenuate unwanted electromagnetic interference (EMI), can be applied to a wide range of materials and surfaces, making them a suitable choice for a diverse array of applications. They offer exceptional shielding capabilities, effectively protecting sensitive electronic components from EMI, and are often more cost-effective than other shielding methods, particularly in high-volume applications. Additionally, radiation-based shielding methods are relatively simple to implement and maintain, further contributing to their widespread adoption.
Based on industry, the consumer electronics segment is projected to have largest market share during the forecast period
The consumer electronics dominates in EMI shielding market. This is driven by the proliferation of compact consumer electronics devices that house sensitive electronic components. These components are susceptible to electromagnetic interference (EMI), which can disrupt their proper functioning and lead to performance degradation. As consumer electronics continue to evolve, with smaller form factors, higher data transfer rates, and an array of advanced features, the demand for sophisticated EMI shielding solutions intensifies. Additionally, the widespread adoption of electronic devices and the need to adhere to EMI shielding regulations are expected to serve as significant catalysts for market growth.
Based on region, India is projected to grow fastest in Asia Pacific for the EMI shielding market
The EMI shielding market in India is projected to exhibit the highest CAGR during the forecast period, driven by India's burgeoning electronics manufacturing industry. India has experienced a remarkable surge in the production of electronic devices, encompassing consumer electronics, telecommunications equipment, and IoT devices. This surge has resulted in a substantial increase in demand for EMI shielding solutions to protect these devices from electromagnetic interference. Furthermore, the telecommunications sector in India has witnessed exponential growth, including the deployment of 4G and 5G networks, further fueling the demand for EMI shielding solutions.
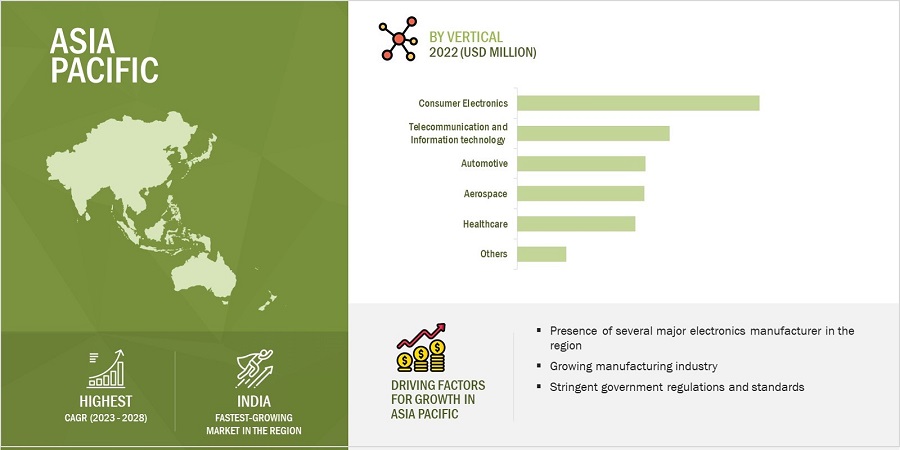
EMI Shielding Market by Region
To know about the assumptions considered for the study, download the pdf brochure
Key Market Players
The EMI shielding companies is dominated by a few globally established players such as Parker Hannifin Corp (US), PPG Industries Inc. (US), 3M (US), Hankel (Germany), Laird Technologies Inc. (US), Leader Tech Inc. (US), MG Chemicals (Canada), Nolato AB (Sweden), Tech Etch Inc. (US), RTP Company (US), Schaffner Holding AG (Switzerland).
Get online access to the report on the World's First Market Intelligence Cloud
- Easy to Download Historical Data & Forecast Numbers
- Company Analysis Dashboard for high growth potential opportunities
- Research Analyst Access for customization & queries
- Competitor Analysis with Interactive dashboard
- Latest News, Updates & Trend analysis
Request Sample Scope of the Report
Get online access to the report on the World's First Market Intelligence Cloud
- Easy to Download Historical Data & Forecast Numbers
- Company Analysis Dashboard for high growth potential opportunities
- Research Analyst Access for customization & queries
- Competitor Analysis with Interactive dashboard
- Latest News, Updates & Trend analysis
|
Report Metric |
Details |
|
Market Size Availability for Years |
2019–2028 |
|
Base Year |
2022 |
|
Forecast Period |
2023–2028 |
|
Forecast Units |
Value (USD) |
|
Segments Covered |
By material, method, industry, and region |
|
Geographies Covered |
North America, Europe, Asia Pacific, and Rest of the world |
|
Companies Covered |
Parker Hannifin Corp (US), PPG Industries Inc. (US), 3M (US), Hankel (Germany), Laird Technologies Inc. (US), Leader Tech Inc. (US), MG Chemicals (Canada), Nolato AB (Sweden), Tech Etch Inc. (US), RTP Company (US), Schaffner Holding AG (Switzerland) |
EMI Shielding Market Highlights
This research report categorizes the EMI shielding market based on material, method, industry, and region
|
Segment |
Subsegment |
|
Based on Material: |
|
|
Based on Method: |
|
|
Based on Vertical: |
|
|
Based on Region: |
|
Recent Developments
- In September 2023, PPG Industries Inc has announced the successful conclusion of a USD 2.7 million project, expanding its powder coatings plant in Sumaré, Brazil. This expansion has boosted the facility's production capacity by 40%.
- In September 2023, Henkel introduces the multifunctional EMI thermal gap pad without silicone. The Bergquist Gap Pad TGP EMI4000 is a silicone-free substance that combines high thermal conductivity (4W/mK) with EMI shielding capabilities, effective up to 77 GHz frequencies.
- In May 2023, PPG Industries Inc. has unveiled a USD 44 million investment plan aimed at enhancing five powder coating manufacturing facilities across the United States and Latin America. These initiatives are a core component of PPG's strategic objectives to broaden its portfolio of powder coatings and amplify worldwide production capacity to cater to the increasing customer demand for environmentally sustainable products.
- In April 2023, Nolato AB has announced that it is in the process of acquiring P&P Technology, a company based in the UK. P&P Technology, specializes in delivering electronic shielding solutions for electromagnetic compatibility (EMC), using both components and materials. This acquisition will afford Nolato AB additional production capabilities, an extended customer portfolio, and a more robust market presence in the UK
- In July 2022, Henkel has added a product to its extensive lineup of automotive pre-applied threadlocker coatings. This product combines the swift application of a flowable substance with the eco-friendly qualities of a water-based material. Introducing the industry's first water-based flowable pre-applied threadlocker, Loctite DRI 2250-W. This threadlocker is designed to meet the stringent specifications of the automotive sector and provides medium to high strength locking properties.
- In June 2022, Laird Performance Materials, a division of DuPont Interconnect Solutions, has leveraged collaborative innovation with DuPont to launch Laird Ttape 1000A thermally conductive adhesive tape. This standalone adhesive tape, measuring at just 50µm, boasts remarkably low thermal resistance. This pressure-sensitive tape eliminates the need for any supplementary mechanical fastening to attach a heatsink to a heat-emitting component
Frequently Asked Questions (FAQs):
Which are the major companies in the EMI shielding market? What are their major strategies to strengthen their market presence?
The major companies in the EMI shielding market are – Parker Hannifin Corp (US), PPG Industries Inc. (US), 3M (US), Hankel (Germany), Laird Technologies Inc. (US). The major strategies adopted by these players are product launches and developments, collaborations, acquisitions, and expansions.
Which is the potential market for the EMI shielding in terms of the region?
The Asia Pacific region is expected to dominate the EMI shielding market due to the presence of major manufacturing companies in industries such as consumer electronics, and automotive.
What are the opportunities for new market entrants?
There are significant opportunities in the EMI shielding market for start-up companies. These companies are providing innovative products.
What are the drivers and opportunities for the EMI shielding market?
Factors such as stringent government regulations, rising proliferation of wireless devices, and rising demand for consumer electronics are among the factors driving the growth of the EMI shielding market.
Who are the major applications of the EMI shielding that are expected to drive the growth of the market in the next 5 years?
The major application for the EMI shielding is consumer electronics. The EMI shielding also have a demand from automotive, telecom, healthcare, and aerospace. They are expected to have a significant share in this market.
To speak to our analyst for a discussion on the above findings, click Speak to Analyst
To estimate the size of the EMI shielding market, the study utilized four major activities. Exhaustive secondary research was conducted to gather information on the market, as well as its peer and parent markets. The next step was to validate these findings, assumptions, and sizing with industry experts across the value chain through primary research. Both top-down and bottom-up approaches were employed to estimate the total market size. Finally, market breakdown and data triangulation methods were utilized to estimate the market size for different segments and subsegments.
Secondary Research
In the secondary research process, various sources have been referred to for identifying and collecting information for this study on the EMI shielding market. Secondary sources for this research study include corporate filings (such as annual reports, investor presentations, and financial statements); trade, business, and professional associations; white papers; certified publications; articles by recognized authors; directories; and databases. The secondary data was collected and analyzed to determine the overall market size, further validated through primary research.
List of key secondary sources
|
SOURCE NAME |
WEBLINK |
|
The Organisation Internationale des Constructeurs d'Automobiles |
|
|
Federal Communications Commission |
|
|
Japan Electronics and Information Technology Industries Association |
|
|
International Electrotechnical Commission (IEC) |
Primary Research
To gather insights on market statistics, revenue data, market breakdowns, size estimations, and forecasting, primary interviews were conducted. Additionally, primary research was used to comprehend the various technology, application, vertical, and regional trends. Interviews with stakeholders from the demand side, including CIOs, CTOs, CSOs, and customer/end-user installation teams using EMI shielding, were also conducted to understand their perspective on suppliers, products, component providers, and their current and future use of EMI shielding, which will impact the overall market. Several primary interviews were conducted across major countries of North America, Europe, Asia Pacific, the Middle East & Africa, and Latin America.
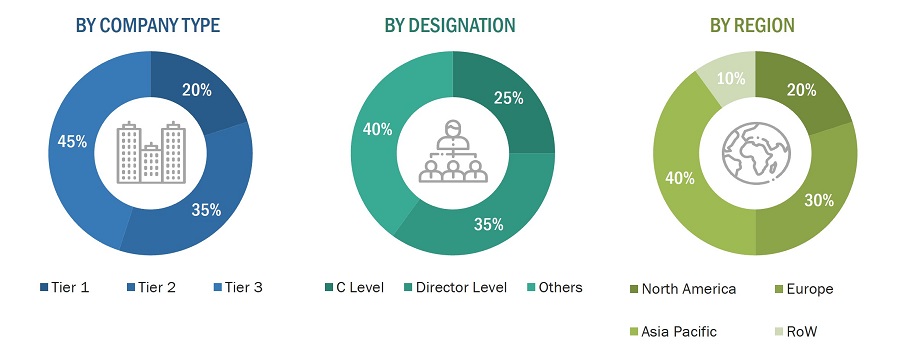
To know about the assumptions considered for the study, download the pdf brochure
Market Size Estimation
To estimate and validate the size of the EMI shielding market and its submarkets, both top-down and bottom-up approaches were utilized. Secondary research was conducted to identify the key players in the market, and primary and secondary research was used to determine their market share in specific regions. The entire process involved studying the annual and financial reports of top players and conducting extensive interviews with industry leaders such as CEOs, VPs, directors, and marketing executives. Secondary sources were used to determine all percentage shares and breakdowns, which were then verified through primary sources. All parameters that could impact the markets covered in this research study were accounted for, analyzed in detail, verified through primary research, and consolidated to obtain the final quantitative and qualitative data.
Global EMI shielding Market Size: Botton Up Approach
- First, companies offering EMI shielding products have been identified, and their product mapping with respect to different parameters, such as materials, method, and industry, has been carried out.
- The market size has been estimated based on the demand for different EMI shielding materials, and dimensions for different applications. The anticipated change in demand for EMI shielding offered by these companies in the recession and company revenues have been analyzed and estimated.
- Primary research has been conducted with a few major players operating in the EMI shielding market to validate the global market size. Discussions included the impact recession impact on the EMI shielding ecosystem.
- Then, the size of the EMI shielding market has been validated through secondary sources, which include the International Trade Centre (ITC), world trade organization, and world economic forum.
- The CAGR of the EMI shielding market has been calculated considering the historical and future market trends and the impact of recession by understanding the adoption rate of EMI shielding for different applications.
- The estimates at every level have been verified and cross-checked through discussions with key opinion leaders, such as corporate executives (CXOs), directors, and sales heads, as well as with the domain experts in MarketsandMarkets.
- Various paid and unpaid information sources, such as company websites, annual reports, press releases, research journals, magazines, white papers, and databases, have also been studied.

Global EMI shielding Market Size: Top Down Approach
The top-down approach has been used to estimate and validate the total size of the EMI shielding market market.
- Focusing initially on the R&D investments and expenditures being made in the ecosystem of the EMI shielding market; further splitting the market on the basis of material, method, industry and region and listing the key developments.
- Identifying leading players in the EMI shielding market through secondary research and verifying them through brief discussions with industry experts
- Analyzing revenue, product mix, geographic presence, and key applications for which products are served by all identified players to estimate and arrive at percentage splits for all key segments.
- Discussing splits with industry experts to validate the information and identify key growth pockets across all key segments.
- Breaking down the total market based on verified splits and key growth pockets across all segments.

Data Triangulation
Once the overall size of the EMI Shielding market was determined using the methods described above, it was divided into multiple segments and subsegments. Market engineering was performed for each segment and subsegment using market breakdown and data triangulation methods, as applicable, to obtain accurate statistics. To triangulate the data, various factors and trends from the demand and supply sides were studied. The market was validated using both top-down and bottom-up approaches.
Market Definition
Electromagnetic Interference (EMI) shielding is a protective measure implemented to minimize or control the impact of electromagnetic interference on electronic devices and systems. EMI shielding involves the use of various materials and techniques to prevent unwanted electromagnetic signals from disrupting the normal functioning of electronic components. EMI shielding solutions, including tapes and laminates, conductive coatings & paints, metal shielding, conductive polymers, and EMI filters, are used across various industries to protect electronics from electromagnetic interference.
Key Stakeholders
- EMI Shielding Solution Suppliers
- EMI Shielding Component Suppliers
- EMI Shielding Regulatory Bodies
- EMI Testing Companies
- Semiconductor Component Manufacturers
- Advanced Chemical Material Suppliers
- Analysts and Strategic Business Planners
- End Users who want to know more about EMI Shielding and the Latest Technology Developments in this Market
Report Objectives
- To define, describe, and forecast the EMI shielding market based on material, method, industry, and region.
- To forecast the market size, in terms of value, for the concerned segments with regard to four main regions, namely, Americas, Europe, Asia Pacific (APAC), and Rest of the World (RoW)
- To strategically analyze the micromarkets with regard to the individual growth trends, prospects, and contribution to the EMI shielding market
- To provide detailed information regarding the major factors (drivers, restraints, opportunities, and industry-specific challenges) influencing the growth of the EMI shielding market
- To analyze opportunities in the market for stakeholders and the details of the competitive landscape for the market leaders
- To provide a detailed overview of the EMI shielding value chain
- To benchmark players within the market using proprietary “Competitive Leadership Mapping” framework, which analyzes market players on various parameters within the broad categories of business and product strategy
- To analyze competitive developments such as partnerships, acquisitions, expansions, agreements, collaborations, contracts, and product launches, along with research and development (R&D) in the EMI shielding market
- To strategically profile key players of the EMI shielding market and comprehensively analyze their market shares and core competencies
Available customizations:
With the given market data, MarketsandMarkets offers customizations according to the specific requirements of companies. The following customization options are available for the report:
- Detailed analysis and profiling of additional market players (up to 5)
- Additional country-level analysis of the EMI shielding market
Product Analysis
- Product matrix, which provides a detailed comparison of the product portfolio of each company in the EMI shielding market.


 Generating Response ...


Growth opportunities and latent adjacency in EMI Shielding Market
I am more interested to know the frequency band to be adopted in 5G devices, the current state-of-the art EMI shielding, and the current pain point if any together with the list of MNCs involved in this and the overall market size.Also, Can you please share a bit more on the EMI shielding value chain? Does your full report contain information on the value chain in terms of OEM/manufacturers, EMS/Sub-cons, component makers/assemblers, module assemblers?