End User Experience Monitoring Market by Component (Products and Services), Access Type (Web and Mobile), Deployment Type, Organization Size, Vertical (BFSI, IT and Telecommunications, and Government and Public Sector), and Region - Global Forecast to 2023


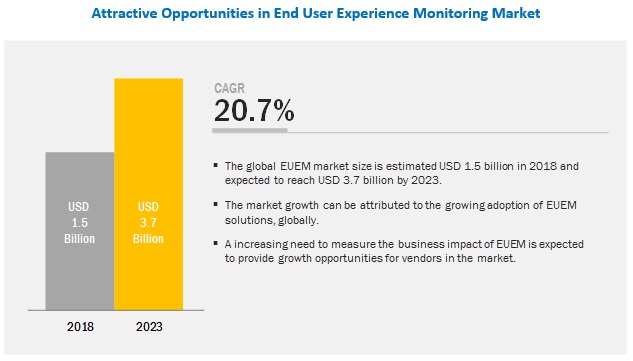
[141 Pages Report] The global end user experience monitoring (EUEM) market size is expected to grow from USD 1.5 billion in 2018 to USD 3.7 billion by 2023, at a Compound Annual Growth Rate (CAGR) of 20.7% during the forecast period. The growing number of agents to provide better end user experience, increasing need to measure business impact of EUEM, and changing end user expectations are major growth factors for the end user experience monitoring market.
By deployment type, the cloud segment to be a larger contributor to the end user experience monitoring market growth during the forecast period
For organizations that have limited budgets, the cloud-based EUEM products are a good option, because of their speed and scalability. The cloud-based deployment model also provides a flexible service by offering on-demand data governance, as customers have to pay according to their utilization of services. Globally, large enterprises and Small and Medium-sized Enterprises (SMEs) are shifting toward cloud-based EUEM products to streamline their processes easily and minimize upfront costs.
Need to provide good user experience to drive the adoption of EUEM products
Organizations with employees between 1 and 999 are categorized under the SMEs segment. The adoption of EUEM products in SMEs is gaining traction, as these organizations are realizing the benefits of providing a good user experience to gain customers and keep up with the competition from large organizations. The websites and applications provided by the SMEs need to be robust and responsive, and should be capable of handling large requests during peak times. EUEM products help in keeping a tab on user trends and various other performance metrics that help organizations improve their websites and applications. SMEs face challenges such as the lack of capital, skills, and scalability. To overcome these challengers, SMEs have started adopting cloud-based EUEM products, as they help in cost saving and can be scaled dynamically as businesses grow.
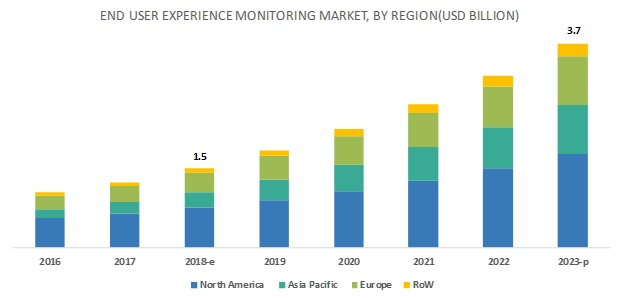
Asia Pacific (APAC) to grow at the highest CAGR during the forecast period
APAC is expected to provide significant growth opportunities during the forecast period. Rapid advancements in telecom infrastructure, cloud computing, and Internet of things (IOT) have led many organizations moving their focus toward providing good end user experience for their web and mobile applications. With the pressure to achieve greater business agility and satisfy their customers, end user experience has become the core of how many businesses operate nowadays. Organizations are working on optimizing both customer-facing and internal applications, and ensuring good end user experience for all enterprise applications.
Key End User Experience Monitoring Market Players
Major vendors in the EUEM market include CA Technologies (US), Micro Focus (UK), SAP (Germany), AppDynamics (US), IBM (US), Riverbed (US), BMC Software (US), Catchpoint (US), Dynatrace (US), New Relic (US), Oracle (US), Lakeside Software (US), Nexthink (Switzerland), Centurylink (US), ControlUp (US), Bitbar (Finland), eG Innovations (US), SmartBear (US), Stackify (US), Alyvix (Italy), AppNeta (US), Datadog (US), Rigor (US), TeamViewer (Germany), and Application Performance Ltd (UK).
Catchpoint, a key player in the end user experience monitoring market, provides a comprehensive range of products. Catchpoint has also adopted organic growth strategies to maintain its leading position in the EUEM market. For instance, in April 2018, Catchpoint launched a new, free benchmarking service, which allows organizations to gain a glimpse into the performance (speed and availability) of their websites, mobile sites, and web applications when compared to the leaders in the industry.
Get online access to the report on the World's First Market Intelligence Cloud
- Easy to Download Historical Data & Forecast Numbers
- Company Analysis Dashboard for high growth potential opportunities
- Research Analyst Access for customization & queries
- Competitor Analysis with Interactive dashboard
- Latest News, Updates & Trend analysis
Request Sample Scope of the Report
Get online access to the report on the World's First Market Intelligence Cloud
- Easy to Download Historical Data & Forecast Numbers
- Company Analysis Dashboard for high growth potential opportunities
- Research Analyst Access for customization & queries
- Competitor Analysis with Interactive dashboard
- Latest News, Updates & Trend analysis

|
Report Metric |
Details |
|
Market size available for years |
2016�2023 |
|
Base year considered |
2017 |
|
Forecast period |
2018�2023 |
|
Forecast unit |
Value (USD Million) |
|
Segments covered |
Components, Access Types, Deployment Types, Organization Size, Verticals, and Regions |
|
Geographies covered |
North America, Europe, Asia Pacific (APAC), Latin America, and Middle East and Africa (MEA) |
|
Companies covered |
CA Technologies (US), Micro Focus (UK), SAP (Germany), AppDynamics (US), IBM (US), Riverbed (US), BMC Software (US), Catchpoint (US), Dynatrace (US), New Relic (US), Oracle (US), Lakeside Software (US), Nexthink (Switzerland), Centurylink (US), ControlUp (US), and 20 more companies |
The research report categorizes the EUEM market to forecast the revenues and analyze the trends in each of the following subsegments:
By Component
- Products
- Synthetic Monitoring
- Real User Monitoring
- Others
- Services
- Professional Services
- Managed Services
By Access Type
- Web
- Mobile
By Deployment Type
- On-premises
- Cloud
By Organization Size
- Small and Medium-sized Enterprises (SMEs)
- Large Enterprises
- Banking, Financial Services, and Insurance (BFSI)
- IT and Telecommunications
- Government and Public Sector
- Retail and Consumer Goods
- Healthcare and Life Sciences
- Others (Media and Entertainment, Travel and Hospitality, and Manufacturing)
By Region
- North America
- US
- Canada
- Europe
- UK
- France
- Germany
- Other European Countries
- APAC
- China
- Japan
- Australia and New Zealand (ANZ)
- Other APAC Countries
- MEA
- Kingdom of Saudi Arabia (KSA)
- South Africa
- Qatar
- United Arab Emirates (UAE)
- Other MEA Countries
- Latin America
- Brazil
- Mexico
- Other Latin American Countries
Critical questions the report answers:
- Where will all these developments take the industry in the mid to long-term?
- What are the upcoming industry applications for the end user experience monitoring market?
- Which segment provides the most opportunity for growth?
- Which are the leading vendors operating in this market?
- What are the opportunities for new market entrants?
To speak to our analyst for a discussion on the above findings, click Speak to Analyst
Table of Contents
1 Introduction (Page No. - 16)
1.1 Objectives of the Study
1.2 Market Definition
1.3 Market Segmentation
1.4 Regions Covered
1.5 Years Considered for the Study
1.6 Currency
1.7 Stakeholders
2 Research Methodology (Page No. - 20)
2.1 Research Data
2.1.1 Secondary Data
2.1.2 Primary Data
2.1.2.1 Breakup of Primaries
2.1.2.2 Key Industry Insights
2.1.2.3 Data Triangulation
2.2 Market Size Estimation
2.2.1 Bottom-Up Approach
2.2.2 Top-Down Approach
2.3 Market Forecast
2.4 Assumptions for the Study
2.5 Limitations
3 Executive Summary (Page No. - 29)
4 Premium Insights (Page No. - 32)
4.1 Attractive Opportunities in the End User Experience Monitoring Market
4.2 Market By Services (2018 vs 2023)
4.3 Market Shares of the Top 3 Verticals in 2018
4.4 Market Investment Scenario
5 Market Overview and Industry Trends (Page No. - 35)
5.1 Introduction
5.2 Market Dynamics
5.2.1 Drivers
5.2.1.1 Growing Number of Agents to Provide Better End User Experience
5.2.1.2 Increasing Need to Measure Business Impact of End User Experience Monitoring
5.2.1.3 Changing End User Expectations
5.2.2 Restraints
5.2.2.1 False Positives and Incorrect Alerts
5.2.3 Opportunities
5.2.3.1 Increasing Adoption of Data-Driven Decision-Making Process and Predictive Analytics
5.2.3.2 Advancements in Application Delivery and Software-Defined Age
5.2.4 Challenges
5.2.4.1 Lack of Advanced Application Performance Monitoring Analytics
5.2.4.2 Lack of Skill Set and Expertise
6 End User Experience Monitoring Market, By Component (Page No. - 39)
6.1 Introduction
6.2 Products
6.2.1 Synthetic Monitoring
6.2.1.1 Need to Know Applications� Capabilities Before Going Live to Drive Adoption of Synthetic Monitoring
6.2.2 Real User Monitoring
6.2.2.1 Growing Need for Gathering Applications� Real-Time Metrics to Drive Adoption of Real User Monitoring
6.2.3 Others
6.3 Services
6.3.1 Professional Services
6.3.1.1 Focus on Improving Technical Capabilities to Drive Adoption of Professional Services
6.3.2 Managed Services
6.3.2.1 Need for Reducing Operational Costs to Drive Adoption of Managed Services
7 End User Experience Monitoring Market, By Access Type (Page No. - 48)
7.1 Introduction
7.2 Web
7.2.1 Growing Need to Attain Operational Efficiency to Drive Growth of Web-Based End User Experience Monitoring
7.3 Mobile
7.3.1 High Mobile Penetration in Recent Times to Drive Growth of Mobile-Based End User Experience Monitoring
8 End User Experience Monitoring Market, By Organization Size (Page No. - 52)
8.1 Introduction
8.2 Large Enterprises
8.2.1 Growing Need to Be Customer-Centric to Drive Adoption of End User Experience Monitoring Products Among Large Enterprises
8.3 Small and Medium-Sized Enterprises
8.3.1 Need to Provide Good User Experience to Drive Adoption of End User Experience Monitoring Products Among Small and Medium-Sized Enterprises
9 End User Experience Monitoring Market, By Deployment Type (Page No. - 56)
9.1 Introduction
9.2 On-Premises
9.2.1 Security Concerns Over Data Leakage Among Enterprises to Drive Adoption of On-Premises End User Experience Monitoring Products
9.3 Cloud
9.3.1 Scalability and Cost -Effectiveness are Major Factors to Drive Adoption of Cloud-Based End User Experience Monitoring Products
10 End User Experience Monitoring Market, By Vertical (Page No. - 60)
10.1 Introduction
10.2 Banking, Financial Services, and Insurance
10.2.1 Focus on Becoming Customer-Centric to Drive Adoption of End User Experience Monitoring Products Among Banking, Financial Services, and Insurance Vertical
10.3 IT and Telecommunications
10.3.1 Growing Need to Reduce Customer Churn to Drive Adoption of End User Experience Monitoring Products
10.4 Government and Public Sector
10.4.1 Government Initiatives Toward Citizen Engagement to Drive Adoption of End User Experience Monitoring Products Among Government and Public Sector Vertical
10.5 Retail and Consumer Goods
10.5.1 Dynamic Customer Requirements to Drive Adoption of End User Experience Monitoring Products Among Retail and Consumer Goods Vertical
10.6 Healthcare and Life Sciences
10.6.1 Rising Need to Improve Efficiency of Healthcare Processes to Drive Adoption of End User Experience Monitoring Products Among Healthcare and Life Sciences Vertical
10.7 Others
11 Geographic Analysis (Page No. - 68)
11.1 Introduction
11.2 North America
11.2.1 United States
11.2.1.1 Easy Availability of Technical Expertise to Drive Growth of Market in the Us
11.2.2 Canada
11.2.2.1 Abundant IT Infrastructure to Increase Adoption of End User Experience Monitoring Products and Services in Canada
11.3 Europe
11.3.1 United Kingdom
11.3.1.1 Growing Focus of BFSI and Government Verticals on End User Experience to Drive Adoption of End User Experience Monitoring Products in the Uk
11.3.2 Germany
11.3.2.1 Focus of Startups to Provide Good End User Experience to Drive Adoption of End User Experience Monitoring Products in Germany
11.3.3 France
11.3.3.1 Growing Need Among Enterprises to Improve Operational Efficiency to Drive Growth of End User Experience Monitoring Market in France
11.3.4 Rest of Europe
11.3.4.1 Digital Transformation Initiatives By Organizations to Drive Growth of Market in Rest of Europe
11.4 Asia Pacific
11.4.1 Japan
11.4.1.1 Growing Need to Provide Good End User Experience to Drive Adoption of End User Experience Monitoring Products in Japan
11.4.2 Australia and New Zealand
11.4.2.1 Digital Transformation Initiatives in Banking Sector to Drive Growth of Market in Australia and New Zealand
11.4.3 China
11.4.3.1 Digitalization in Manufacturing and Telecom Verticals to Drive Adoption of End User Experience Monitoring Products in China
11.4.4 Rest of Asia Pacific
11.4.4.1 Presence of Huge Application-Driven Population to Boost Growth of Market in Rest of APAC
11.5 Latin America
11.5.1 Brazil
11.5.1.1 Focus of BFSI and Telecom Verticals on Providing Good End User Experience to Drive Adoption of End User Experience Monitoring Products in Brazil
11.5.2 Mexico
11.5.2.1 Digitalization Projects in Various Verticals to Drive Growth of Market in Mexico
11.5.3 Rest of Latin America
11.5.3.1 Need to Study User Preferences to Boost Adoption of End User Experience Monitoring Products in Rest of Latin America
11.6 Middle East and Africa
11.6.1 Kingdom of Saudi Arabia
11.6.1.1 Rapid Digitalization Projects in Various Verticals to Drive Adoption of End User Experience Monitoring Products
11.6.2 United Arab Emirates
11.6.2.1 Growing Need to Provide Robust Web and Mobile Applications to Drive Growth of Market in United Arab Emirates
11.6.3 Qatar
11.6.3.1 Focus on Providing Digital Experience to Users to Drive Adoption of End User Experience Monitoring Products in Qatar
11.6.4 South Africa
11.6.4.1 Digital Transformation Initiatives in Banking Sector to Drive Adoption of End User Experience Monitoring Products in South Africa
11.6.5 Rest of Middle East and Africa
11.6.5.1 Growing Need to Understand User Trends to Drive Growth of End User Experience Monitoring Market in Rest of Middle East and Africa(MEA)
12 Competitive Landscape (Page No. - 94)
12.1 Overview
12.2 Competitive Scenario
12.2.1 Partnerships, Agreements, and Collaborations
12.2.2 New Product Launches
12.2.3 Business Expansions
12.2.4 Mergers and Acquisitions
13 Company Profiles (Page No. - 98)
(Business Overview, Products Offered, Recent Developments, MnM View, SWOT Analysis)*
13.1 Oracle
13.2 Micro Focus
13.3 Dynatrace
13.4 Catchpoint
13.5 BMC Software
13.6 CA Technologies
13.7 Appdynamics
13.8 IBM
13.9 SAP
13.10 Riverbed
13.11 Centurylink
13.12 New Relic
13.13 Lakeside Software
13.14 Nexthink
13.15 Smartbear
13.16 Appneta
13.17 Rigor
13.18 Teamviewer
13.19 Stackify
13.20 Application Performance Ltd
13.21 Datadog
13.22 Controlup
13.23 Bitbar
13.24 Wurth Phoenix S.R.L.
13.25 EG Innovations
*Business Overview, Products Offered, Recent Developments, MnM View, SWOT Analysis Might Not Be Captured in Case of Unlisted Companies.
14 Appendix (Page No. - 134)
14.1 Discussion Guide
14.2 Knowledge Store: Marketsandmarkets� Subscription Portal
14.3 Available Customizations
14.4 Related Reports
14.5 Author Details
List of Tables (71 Tables)
Table 1 End User Experience Monitoring Market Size, By Component, 2016�2023 (USD Million)
Table 2 Market Size By Products, 2016�2023 (USD Million)
Table 3 Products: Market Size By Region, 2016�2023 (USD Million)
Table 4 Synthetic Monitoring: Market Size By Region, 2016�2023 (USD Million)
Table 5 Real User Monitoring: Market Size By Region, 2016�2023 (USD Million)
Table 6 Others: Market Size By Region, 2016�2023 (USD Million)
Table 7 End User Experience Monitoring Market Size, By Services, 2016�2023 (USD Million)
Table 8 Services: Market Size By Region, 2016�2023 (USD Million)
Table 9 Professional Services: Market Size By Region, 2016�2023 (USD Million)
Table 10 Managed Services: Market Size By Region, 2016�2023 (USD Million)
Table 11 End User Experience Monitoring Market Size, By Access Type, 2016�2023 (USD Million)
Table 12 Web: Market Size By Region, 2016�2023 (USD Million)
Table 13 Mobile: Market Size By Region, 2016�2023 (USD Million)
Table 14 Market Size By Organization Size, 2016�2023 (USD Million)
Table 15 Large Enterprises: Market Size By Region, 2016�2023 (USD Million)
Table 16 Small and Medium-Sized Enterprises: Market Size By Region, 2016�2023 (USD Million)
Table 17 End User Experience Monitoring Market Size, By Deployment Type, 2016�2023 (USD Million)
Table 18 On-Premises: Market Size By Region, 2016�2023 (USD Million)
Table 19 Cloud: Market Size By Region, 2016�2023 (USD Million)
Table 20 End User Experience Monitoring Market Size, By Vertical, 2016�2023 (USD Million)
Table 21 Banking, Financial Services, and Insurance: Market Size By Region, 2016�2023 (USD Million)
Table 22 IT and Telecommunications: Market Size By Region, 2016�2023 (USD Million)
Table 23 Government and Public Sector: Market Size By Region, 2016�2023 (USD Million)
Table 24 Retail and Consumer Goods: Market Size By Region, 2016�2023 (USD Million)
Table 25 Healthcare and Life Sciences: Market Size By Region, 2016�2023 (USD Million)
Table 26 Others: Market Size By Region, 2016�2023 (USD Million)
Table 27 End User Experience Monitoring Market Size, By Region, 2016�2023 (USD Million)
Table 28 North America: Market Size, By Component, 2016�2023 (USD Million)
Table 29 North America: Market Size, By Products, 2016�2023 (USD Million)
Table 30 North America: Market Size, By Services, 2016�2023 (USD Million)
Table 31 North America: Market Size, By Access Type, 2016�2023 (USD Million)
Table 32 North America: Market Size, By Deployment Type, 2016�2023 (USD Million)
Table 33 North America: Market Size, By Organization Size, 2016�2023 (USD Million)
Table 34 North America: Market Size, By Vertical, 2016�2023 (USD Million)
Table 35 North America: Market Size, By Country, 2016�2023 (USD Million)
Table 36 Europe: End User Experience Monitoring Market Size, By Component, 2016�2023 (USD Million)
Table 37 Europe: Market Size, By Products, 2016�2023 (USD Million)
Table 38 Europe: Market Size, By Services, 2016�2023 (USD Million)
Table 39 Europe: Market Size, By Access Type, 2016�2023 (USD Million)
Table 40 Europe: Market Size, By Deployment Type, 2016�2023 (USD Million)
Table 41 Europe: Market Size, By Organization Size, 2016�2023 (USD Million)
Table 42 Europe: Market Size, By Vertical, 2016�2023 (USD Million)
Table 43 Europe: Market Size, By Country, 2016�2023 (USD Million)
Table 44 Asia Pacific: End User Experience Monitoring Market Size, By Component, 2016�2023 (USD Million)
Table 45 Asia Pacific: Market Size, By Products, 2016�2023 (USD Million)
Table 46 Asia Pacific: Market Size, By Services, 2016�2023 (USD Million)
Table 47 Asia Pacific: Market Size, By Access Type, 2016�2023 (USD Million)
Table 48 Asia Pacific: Market Size, By Deployment Type, 2016�2023 (USD Million)
Table 49 Asia Pacific: Market Size, By Organization Size, 2016�2023 (USD Million)
Table 50 Asia Pacific: Market Size, By Vertical, 2016�2023 (USD Million)
Table 51 Asia Pacific: Market Size, By Country, 2016�2023 (USD Million)
Table 52 Latin America: End User Experience Monitoring Market Size, By Component, 2016�2023 (USD Million)
Table 53 Latin America: Market Size, By Products, 2016�2023 (USD Million)
Table 54 Latin America: Market Size, By Services, 2016�2023 (USD Million)
Table 55 Latin America: Market Size, By Access Type, 2016�2023 (USD Million)
Table 56 Latin America: Market Size, By Deployment Type, 2016�2023 (USD Million)
Table 57 Latin America: Market Size, By Organization Size, 2016�2023 (USD Million)
Table 58 Latin America: Market Size, By Vertical, 2016�2023 (USD Million)
Table 59 Latin America: Market Size, By Country, 2016�2023 (USD Million)
Table 60 Middle East and Africa: End User Experience Monitoring Market Size, By Component, 2016�2023 (USD Million)
Table 61 Middle East and Africa: Market Size, By Products, 2016�2023 (USD Million)
Table 62 Middle East and Africa: Market Size, By Services, 2016�2023 (USD Million)
Table 63 Middle East and Africa: Market Size, By Access Type, 2016�2023 (USD Million)
Table 64 Middle East and Africa: Market Size, By Deployment Type, 2016�2023 (USD Million)
Table 65 Middle East and Africa: Market Size, By Organization Size, 2016�2023 (USD Million)
Table 66 Middle East and Africa: Market Size, By Vertical, 2016�2023 (USD Million)
Table 67 Middle East and Africa: Market Size, By Country, 2016�2023 (USD Million)
Table 68 Partnerships, Agreements, and Collaborations, 2017
Table 69 New Product Launches, 2016�2018
Table 70 Business Expansions, 2018
Table 71 Mergers and Acquisitions, 2017�2018
List of Figures (27 Figures)
Figure 1 End User Experience Monitoring Market: Research Design
Figure 2 Market Bottom-Up Approach
Figure 3 Market Top-Down Approach
Figure 4 Market Size, 2016�2023
Figure 5 Top 3 Segments With the Highest Market Shares in the End User Experience Monitoring Market
Figure 6 End User Experience Monitoring Market: Regional Snapshot
Figure 7 Growing Need to Measure the Business Impact of End User Experience Monitoring to Drive Adoption of End User Experience Monitoring Products
Figure 8 Professional Services to Hold A Larger Market Size in 2018
Figure 9 Banking, Financial Services, and Insurance Vertical to Hold the Highest Market Share in 2018
Figure 10 Asia Pacific to Emerge as the Best Market for Investments in the Next 5 Years
Figure 11 Drivers, Restraints, Opportunities, and Challenges: End User Experience Monitoring Market
Figure 12 Products Segment to Hold A Larger Market Size in 2018
Figure 13 Synthetic Monitoring Segment to Hold the Largest Market Size in 2018
Figure 14 Professional Services Segment to Hold A Larger Market Size in 2018
Figure 15 Web Segment to Hold A Larger Market Size in 2018
Figure 16 Large Enterprises Segment to Hold A Larger Market Size in 2018
Figure 17 On-Premises Deployment Type to Hold A Larger Market Size in 2018
Figure 18 Banking, Financial Services, and Insurance Vertical to Hold the Largest Market Size in 2018
Figure 19 North America to Hold the Largest Market Size in 2018
Figure 20 North America: Market Snapshot
Figure 21 Asia Pacific: Market Snapshot
Figure 22 Oracle: Company Snapshot
Figure 23 Micro Focus: Company Snapshot
Figure 24 CA Technologies: Company Snapshot
Figure 25 IBM: Company Snapshot
Figure 26 SAP: Company Snapshot
Figure 27 Centurylink: Company Snapshot
The study involved 4 major activities to estimate the current market size of End User Experience Monitoring (EUEM) products and services. Exhaustive secondary research was done to collect information on the market, the peer market, and the parent market. The next step was to validate these findings, assumptions, and sizing with industry experts across the value chain through primary research. Both top-down and bottom-up approaches were employed to estimate the complete market size. After that, the market breakup and data triangulation procedures were used to estimate the market size of the segments and subsegments.
Secondary Research
In the secondary research process, various secondary sources were referred to for identifying and collecting information for this study. The secondary sources included annual reports, press releases, and investor presentations of companies; whitepapers such as Cisco Cloud Index; certified publications; and articles from recognized associations, such as data center knowledge and government publishing sources. Secondary sources such as Factiva and D&B Hoovers were also considered for this study. Secondary research was mainly used to obtain key information about the industry�s value chain, the total pool of key players, market classification and segmentation as per the industry trends to the bottom-most level, regional markets, and key developments from both market and technology-oriented perspectives.
Primary Research
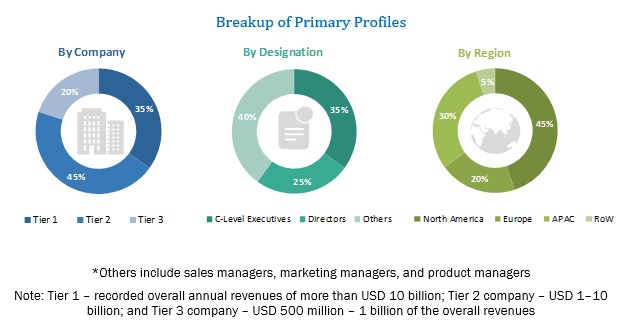
In the primary research process, various primary sources from both the supply and demand sides were interviewed to obtain qualitative and quantitative information for this report. Primary sources from the supply-side included industry experts, such as Chief Executive Officers (CEOs), Vice Presidents (VPs), marketing directors, technology and innovation directors, and related key executives from various key companies and organizations providing EUEM products and services. The primary sources from the demand side included the end-users of EUEM products, which included Chief Information Officers (CIOs), IT technicians and technologists, and IT managers at public and investor-owned utilities.
The following figure depicts the breakup of the primary profiles:
To know about the assumptions considered for the study, download the pdf brochure
Market Size Estimation
Both top-down and bottom-up approaches were used to estimate and validate the total size of the EUEM market. They were also used extensively to estimate the size of various subsegments in the market. The research methodology used to estimate the market size includes the following:
- The key players in the industry and markets have been identified through extensive secondary research.
- The industry�s supply chain and market size, in terms of value, have been determined through primary and secondary research processes.
- All percentage shares, splits, and breakdowns have been determined using secondary sources and verified through primary sources.
Data Triangulation
After arriving at the overall market size using the market size estimation processes as explained above the market was split into several segments and subsegments. To complete the overall market engineering process and arrive at the exact statistics of each market segment and subsegment, the data triangulation and market breakup procedures were employed, wherever applicable. The data was triangulated by studying several factors and trends from both, the demand and supply sides, in the EUEM market.
Report Objectives
- To define, segment, and project the global market size of the EUEM market
- To understand the structure of the EUEM market by identifying its various subsegments
- To provide detailed information about the key factors (drivers, restraints, opportunities, and industry-specific challenges) influencing the growth of the market
- To analyze the micromarkets with respect to individual growth trends, prospects, and their contribution to the total market
- To project the size of the market and its submarkets, in terms of value, with respect to the 5 major regions (along with their respective key countries)
- To profile key players and comprehensively analyze their core competencies
- To understand the competitive landscape and identify major growth strategies adopted by players across key regions
- To analyze the competitive developments, such as expansions and investments, new product launches, mergers and acquisitions, joint ventures, and agreements, in the EUEM market
Available Customizations
With the given market data, MarketsandMarkets offers customizations as per the company�s specific needs and on best effort basis for profiling of additional market players.


Growth opportunities and latent adjacency in End User Experience Monitoring Market