Enterprise Manufacturing Intelligence Market by Deployment Type (Embedded, and Standalone), Offering (Software, and Services), End-User Industry (Automotive, Oil & Gas, Pharmaceutical, Food & Beverages), and Geography - Global Forecast to 2022


The rising need for enhanced operational efficiency, intensifying competitive scenario among manufacturers, and growing supplier complexity are the key factors that influence the enterprise manufacturing intelligence market. The enterprise manufacturing intelligence (EMI) market is estimated to be valued at USD 1.53 Billion in 2016 and is expected to register a CAGR of 17.1%, to reach USD 3.95 Billion by 2022.
The base year considered for the study is 2015 and the forecast period is between 2016 and 2022. The objective of the report is to provide a detailed analysis of the market based on deployment type, offering, application, end-user industry, and geography. The report provides detailed information regarding the major factors influencing the growth of the enterprise manufacturing intelligence market. The report also give detailed overview of the value chain in the market and analyze the market trends with the Porter's five forces analysis.
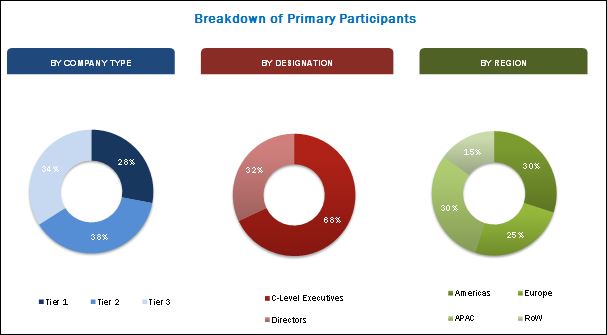
The research methodology used to estimate and forecast the enterprise manufacturing intelligence market begins with capturing data on key vendor revenue through the secondary research such as includes corporate filings (such as annual reports, investor presentations, and financial statements); trade, business, and professional associations; white papers; journals; certified publications; articles from recognized authors; directories, automation world magazine, manufacturing automation magazine, and leading player�s newsletters. The vendor offerings are also taken into consideration to determine the market segmentation. The bottom-up procedure has been employed to arrive at the overall size of the global market from the revenue of key players. After arriving at the overall market size, the total market has been split into several segments and subsegments which have been verified through the primary research by conducting extensive interviews of people holding key positions such as CEOs, VPs, directors, and executives. The market breakdown and data triangulation procedures have been employed to complete the overall market engineering process and arrive at the exact statistics for all segments and subsegments. The breakdown of the profiles of primaries is depicted in the below figure:
To know about the assumptions considered for the study, download the pdf brochure
The value chain of the enterprise manufacturing intelligence market starts with research and development (R&D), followed by EMI software developers, EMI software suppliers, end-user industries, and post-sales services. enterprise manufacturing intelligence research & development and software development add maximum value to the overall price of the system. EMI software suppliers are companies whose core business is to develop EMI software solutions for various industries according to the requirement of different manufacturing companies.
Major key players involved in the enterprise manufacturing intelligence market are ABB Ltd. (U.S.), Aspen Technology, Inc. (U.S.), Dassault Syst�mes (France), Emerson Electric Co. (U.S.), General Electric Co. (U.S.), Honeywell International Inc. (U.S.), Rockwell Automation, Inc. (U.S.), SAP SE (Germany), Schneider Electric SE (France), Siemens AG (Germany), and Yokogawa Electric Corporation (Japan).
Target Audience of the Report:
- Associations, organizations, forums, and alliances
- Distributors and traders
- Manufacturing equipment suppliers
- Process industries like oil and gas, power, chemical, and pharmaceuticals, among others
- Discrete industries like automotive, medical devices, aerospace & defense, among others
- Semiconductor & electronics manufacturers
- Research organizations and consulting companies
- Software and service providers
- System integrators
- Technology solution providers
�This study answers several questions for the stakeholders, primarily which market segments to focus on in the next two to five years for prioritizing efforts and investments.�
Get online access to the report on the World's First Market Intelligence Cloud
Request Sample Scope of the Report
:

This research report categorizes the global enterprise manufacturing intelligence market on the basis of deployment type, offering, end-user industry, and geography.
Market, by Deployment Type:
- Embedded
- Standalone
Market, by Offering:
- Software
- Services
Market, by End-user Industry:
- Process Industries
- Chemical
- Energy & Power
- Food & Beverages
- Oil & Gas
- Pharmaceutical
- Other Process Industries (Mining and Metals, Paper and Pulp)
- Discrete Industries
- Aerospace & Defense
- Automotive
- Medical Devices
- Semiconductor & Electronics
Market, by Geography:
- Americas
- North America
- U.S.
- Canada
- Mexico
- South America
- Brazil
- Argentina
- Rest of South America
- North America
- Europe
- Germany
- U.K.
- France
- Rest of Europe
- Asia-Pacific (APAC)
- China
- Japan
- South Korea
- India
- Rest of APAC
- Rest of the World (RoW)
- Middle East
- Africa
Available Customizations:
With the given market data, MarketsandMarkets offers customizations according to the companies� specific needs. The following customization options are available for the report:
Company Information:
Detailed analysis and profiling of additional market players (up to five)
The enterprise manufacturing intelligence market is expected to be valued at USD 3.95 Billion by 2022, growing at a CAGR of 17.1% between 2016 and 2022. The growth of this market is driven by tough competition among the manufacturing companies, growing need for enhanced operational efficiency, rising supplier complexity, and stringent regulatory framework in the highly regulated industries.
Embedded deployment type is expected to lead the enterprise manufacturing intelligence market between 2016 and 2022. The growth of the market is driven by the factors such as ongoing technological advancements, increasing popularity of IoT, and growing demand for sustainable production.
The market for enterprise manufacturing intelligence services is expected to grow at the highest CAGR between 2016 and 2022. On account of growing pressure among manufacturing firms to reduce the manufacturing cost, improve product quality as well the manufacturing yield, and stringent regulatory compliance, the demand for EMI services is likely to increase during the forecast period.
enterprise manufacturing intelligence is tailor-made software that varies based on the needs and demands of directed end user industries. The requirement of EMI depends on the demand from process and discrete industries. EMI has applications in data integration, data contextualization, analytics and analysis, and visualization across industries.
The automotive sector witnessed rapid changes in the manufacturing technologies. Original equipment manufacturers in the automotive industry are facing the challenges of manufacturing, designing, and upgrading conventional powertrain models to synchronize their manufacturing processes with the emerging technologies for enhanced consumer satisfaction and better experiences. On account of this, enterprise manufacturing intelligence software would gain traction during the forecast period.
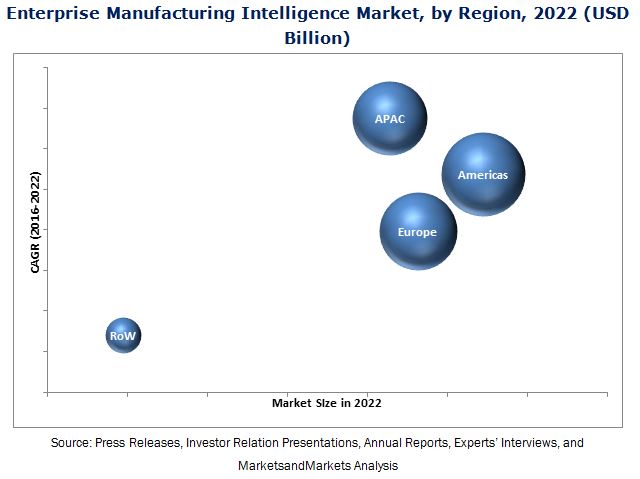
The Americas is expected to account for the largest share of the enterprise manufacturing intelligence market during forecast period. EMI is witnessing a rapid adoption rate across various industries such as oil and gas, automotive, medical devices, chemicals which is expected to support the market growth in the Americas. Further, the presence of leading market players in this region and increasing government�s investments are anticipated to fuel the North American market.
Asian players have a huge growth potential because of continual improvements being done in the existing software and by providing industry-specific services. Major market players competing in the enterprise manufacturing intelligence market are GE�s Fanuc Automation, Rockwell Automation, Inc., Invensys from Schneider Electric, and Hexagon AB.
High initial investments required for the adoption of EMI is perceived as a restraint for the growth of this market. Furthermore, the factors such as high costs associated with integration of EMI along with timely updates of the enterprise manufacturing intelligence software are expected to restrain the EMI market growth during the forecast period.
The key enterprise manufacturing intelligence market players such as ABB Ltd. (U.S.) and Schneider Electric SE (France) are focusing on new product launches and developments, acquisitions, and collaborations strategies to enhance their product offerings and expand their business.
To speak to our analyst for a discussion on the above findings, click Speak to Analyst
Table of Contents
1 Introduction (Page No. - 15)
1.1 Objectives of the Study
1.2 Market Definition
1.3 Scope of the Study
1.3.1 Market Scope
1.3.2 Years Considered for the Study
1.4 Currency
1.5 Limitations
1.6 Stakeholders
2 Research Methodology (Page No. - 18)
2.1 Research Data
2.1.1 Secondary Data
2.1.1.1 Key Data From Secondary Sources
2.1.2 Primary Data
2.1.2.1 Key Data From Primary Sources
2.1.2.2 Key Industry Insights
2.1.2.3 Breakdown of Primaries
2.2 Market Size Estimation
2.3 Market Breakdown & Data Triangulation
2.4 Assumptions
3 Executive Summary (Page No. - 26)
4 Premium Insights (Page No. - 31)
4.1 Enterprise Manufacturing Intelligence Market, 2016�2022 (USD Billion)
4.2 Market, By Deployment Type (2016�2022)
4.3 Market, By Offering (2016)
4.4 Market, By End�User Industry and Region (2016)
4.5 Market, By Region (2016)
5 Market Overview (Page No. - 34)
5.1 Introduction
5.2 Evolution of the EMI Market
5.3 Market Segmentation
5.3.1 By Deployment Type
5.3.2 By Offering
5.3.3 By End-User Industry
5.3.4 By Geography
5.4 Market Dynamics
5.4.1 Drivers
5.4.1.1 Intensifying Competitive Scenario Among Manufacturers Drives the Growth of the EMI Market
5.4.1.2 Rising Need for Enhanced Operational Efficiency Increases the Demand for EMI
5.4.1.3 Increased Complexities in the Supply Chain Process Augmenting Adoption of EMI to Ensure Speedy Response
5.4.1.4 Rising Emphasis on Regulatory Compliances Results Into High Demand for EMI
5.4.2 Restraints
5.4.2.1 Hefty Initial Investments for the Implementation of EMI Limit the Demand From End-User Industries
5.4.2.2 High Costs Associated With Integration Limit the Adoption of EMI in Older Enterprises
5.4.3 Opportunities
5.4.3.1 Developing Economies Expanding Its Production Base
5.4.3.2 Growing Implementation of EMI in Small- and Large-Scale Enterprises for Sustainable Production
5.4.4 Challenges
5.4.4.1 Poor It Networks and Infrastructure for the Implementation of EMI
6 Industry Trends (Page No. - 44)
6.1 Introduction
6.2 Value Chain Analysis
6.3 Porter�s Five Forces Analysis
6.3.1 Intensity of Rivalry
6.3.2 Threat of Substitutes
6.3.3 Bargaining Power of Buyers
6.3.4 Bargaining Power of Suppliers
6.3.5 Threat of New Entrants
7 Market Analysis, By Deployment Type (Page No. - 52)
7.1 Introduction
7.2 Embedded EMI Solutions
7.2.1 Embedded EMI Allowing Suppliers to Digitally Collaborate With Manufacturers
7.2.2 Rising Warranty Concerns Would Boost the Adoption of Embedded EMI Solutions
7.3 Standalone EMI Solutions
7.3.1 Increasing Pressure on Reduction of Tco Drives the Demand for Standalone EMI Solutions
7.3.2 Standalone EMI Work in Silos
8 Market Analysis, By Application (Page No. - 57)
8.1 Introduction
8.2 Data Integration
8.2.1 Data Integration Aids in the Amalgamation of Enterprise Data Expected to Propel the EMI Market Growth
8.2.2 Data Integration Supports End-User Industries to Take Actionable Insights
8.3 Data Contextualization
8.4 Analytics and Analysis
8.4.1 Analytics Allows Manufacturing Enterprises to Gain Significant Insights Into Manufacturing Processes
8.4.2 Growing Demand for High Purity Ingredients in the Pharmaceutical Industry Driving the EMI Market Growth
8.5 Visualization
8.5.1 EMI�s Visualization Exhibits Variations and Flaws in the Manufacturing Processes
9 Market Analysis, By Offering (Page No. - 61)
9.1 Introduction
9.2 Software
9.2.1 Benefits of EMI Software
9.2.2 Major Players Competing in the EMI Software Space
9.3 Services
9.3.1 EMI Services are Industry-Specific in Nature
9.3.2 High Costs Associated With Timely Updates
10 Market Analysis, By End-User Industry (Page No. - 65)
10.1 Introduction
10.2 Process Industries
10.2.1 Chemical
10.2.2 Energy and Power
10.2.3 Food and Beverages
10.2.4 Oil and Gas
10.2.5 Pharmaceutical
10.2.6 Other Process Industries
10.3 Discrete Industries
10.3.1 Aerospace and Defense
10.3.2 Automotive
10.3.3 Medical Devices
10.3.4 Semiconductor and Electronics
11 Geographical Analysis (Page No. - 90)
11.1 Introduction
11.2 Americas
11.2.1 Introduction
11.2.2 North America
11.2.3 High-End Manufacturing in the U.S. to Propel the EMI Market Growth
11.2.4 Canada to Account for the Second-Highest Share of the North American EMI Market
11.2.5 Mexico Anticipated to Witness the Fastest Growth Rate Between 2016 and 2022
11.2.6 South America
11.2.7 Brazil
11.2.8 Argentina
11.2.9 Rest of South America
11.3 Europe
11.3.1 Germany
11.3.2 U.K.
11.3.3 France
11.3.4 Rest of Europe
11.4 APAC
11.4.1 China
11.4.2 Japan
11.4.3 South Korea
11.4.4 India
11.4.5 Rest of APAC
11.5 Rest of the World
11.5.1 Middle East
11.5.2 Africa
12 Competitive Landscape (Page No. - 119)
12.1 Overview
12.2 Analysis of Competition Among Market Players
12.2.1 Market Ranking Analysis of EMI, 2015
12.3 Competitive Situations and Trends
12.3.1 New Product Launches/Developments
12.3.2 Partnerships/ Agreements/ Strategic Alliances/ Collaborations
12.3.3 Acquisitions
13 Company Profiles (Page No. - 126)
13.1 Introduction
(Business Overview, Products & Services, Key Insights, Recent Developments, SWOT Analysis, Ratio Analysis, MnM View)*
13.2 ABB Ltd.
13.3 Honeywell International Inc.
13.4 Rockwell Automation, Inc.
13.5 Schneider Electric SE
13.6 Siemens AG
13.7 Aspen Technology, Inc.
13.8 Dassault Systemes Sa
13.9 Emerson Electric Co.
13.10 General Electric Co.
13.11 SAP SE
13.12 Yokogawa Electric Corporation
*Details on Business Overview, Products & Services, Key Insights, Recent Developments, SWOT Analysis, MnM View Might Not Be Captured in Case of Unlisted Companies.
14 Appendix (Page No. - 155)
14.1 Insights of Industry Experts
14.2 Discussion Guide
14.3 Knowledge Store: Marketsandmarkets� Subscription Portal
14.4 Introducing RT: Real-Time Market Intelligence
14.5 Available Customizations
14.6 Related Reports
14.7 Author Details
List of Tables (68 Tables)
Table 1 Enterprise Manufacturing Intelligence Market, By Deployment Type
Table 2 Market, By Offering
Table 3 Market, By End-User Industry
Table 4 EMI Market, By Deployment Type, 2013�2022 (USD Million)
Table 5 EMI Market, By Offering, 2013�2022 (USD Million)
Table 6 Market for End-User Industries, By Type, 2013�2022 (USD Million)
Table 7 EMI Market, By Process Industry, 2013�2022 (USD Million)
Table 8 Market for Process Industries, By Region, 2013�2022 (USD Million)
Table 9 Market for Process Industry in Americas, By Region, 2013�2022 (USD Million)
Table 10 Market for Chemical Industry, By Region, 2013�2022 (USD Million)
Table 11 Market for Chemical Industry in North America, By Country, 2013�2022 (USD Million)
Table 12 EMI Market for Energy and Power Industry, By Region, 2013�2022 (USD Million)
Table 13 Market for Energy and Power Industry in North America, By Country, 2013�2022 (USD Million)
Table 14 Market for Food and Beverages Industry, By Region, 2013�2022 (USD Million)
Table 15 Market for Food and Beverages Industry in North America, By Country, 2013�2022 (USD Million)
Table 16 Market for Oil and Gas Industry, By Region, 2013�2022 (USD Million)
Table 17 Market for Oil and Gas Industry in North America, By Country, 2013�2022 (USD Million)
Table 18 Market for Pharmaceutical Industry, By Region, 2013�2022 (USD Million)
Table 19 Market for Pharmaceutical Industry in North America, By Country, 2013�2022 (USD Million)
Table 20 Market for Other Process Industries, By Region, 2013�2022 (USD Million)
Table 21 EMI Market for Other Process Industries in North America, By Country, 2013�2022 (USD Million)
Table 22 Market for Discrete Industries, By Type, 2013�2022 (USD Million)
Table 23 Market for Discrete Industries, By Region, 2013�2022 (USD Million)
Table 24 Market for Discrete Industries in Americas, By Region, 2013�2022 (USD Million)
Table 25 Market for Aerospace and Defense Industry, By Region, 2013�2022 (USD Million)
Table 26 Market for Aerospace and Defense Industry in North America, By Country, 2013�2022 (USD Million)
Table 27 Market for Automotive Industry, By Region, 2013�2022 (USD Million)
Table 28 Market for Automotive Industry in North America, By Country, 2013�2022 (USD Million)
Table 29 EMI Market for Medical Devices Industry, By Region, 2013�2022 (USD Million)
Table 30 EMI Market for Medical Devices Industry in North America, By Country, 2013�2022 (USD Million)
Table 31 EMI Market for Semiconductor and Electronics Industry, By Region, 2013�2022 (USD Million)
Table 32 EMI Market for Semiconductor and Electronics Industry in North America, By Country, 2013�2022 (USD Million)
Table 33 Market, By Region, 2013�2022 (USD Million)
Table 34 EMI Market in Americas, By Region, 2013�2022 (USD Million)
Table 35 Market in Americas, By Process Industry, 2013�2022 (USD Million)
Table 36 Market in Americas, By Discrete Industry, 2013�2022 (USD Million)
Table 37 Market in North America, By End-User Industry, 2013�2022 (USD Million)
Table 38 Market in North America, By Country, 2013�2022 (USD Million)
Table 39 Market in North America, By Process Industry, 2013�2022 (USD Million)
Table 40 Market in South America, By End-User Industry, 2013�2022 (USD Million)
Table 41 EMI Market in South America, By Country, 2013�2022 (USD Million)
Table 42 Market in South America, By Process Industry, 2013�2022 (USD Million)
Table 43 Market in Europe, By End-User Industry, 2013�2022 (USD Million)
Table 44 Market in Europe, By Country, 2013�2022 (USD Million)
Table 45 Market in Europe, By Process Industry, 2013�2022 (USD Million)
Table 46 Market in Europe, By Discrete Industry, 2013�2022 (USD Million)
Table 47 EMI Market in APAC, By End-User Industry, 2013�2022 (USD Million)
Table 48 Market in APAC, By Country, 2013�2022 (USD Million)
Table 49 EMI Market in APAC, By Process Industry, 2013�2022 (USD Million)
Table 50 Market for Chemical Industry in APAC, By Country, 2013�2022 (USD Million)
Table 51 Market for Energy and Power Industry in APAC, By Country, 2013�2022 (USD Million)
Table 52 Market for Food and Beverage Industry in APAC, By Country, 2013�2022 (USD Million)
Table 53 Market for Oil and Gas Industry in APAC, By Country, 2013�2022 (USD Million)
Table 54 Market for Pharmaceutical Industry in APAC, By Country, 2013�2022 (USD Million)
Table 55 Market for Other Process Industries in APAC, By Country, 2013�2022 (USD Million)
Table 56 Market in APAC, By Discrete Industry, 2013�2022 (USD Million)
Table 57 Market for Aerospace and Defense Industry in APAC, By Country, 2013�2022 (USD Million)
Table 58 EMI Market for Automotive Industry in APAC, By Country, 2013�2022 (USD Million)
Table 59 Market for Medical Devices Industry in APAC, By Country, 2013�2022 (USD Million)
Table 60 Market for Semiconductor and Electronics Industry in APAC, By Country, 2013�2022 (USD Million)
Table 61 Market in RoW, By End-User Industry, 2013�2022 (USD Million)
Table 62 Market in RoW, By Region, 2013�2022 (USD Million)
Table 63 Market in RoW, By Process Industry, 2013�2022 (USD Million)
Table 64 EMI Market in RoW, By Discrete Industry, 2013�2022 (USD Million)
Table 65 Ranking of Key Players in the Market, 2015
Table 66 Most Significant New Product Launches in the Market
Table 67 Most Significant Collaborations, Partnerships, and Joint Ventures in the Market
Table 68 Recent Acquisitions in the Market
List of Figures (69 Figures)
Figure 1 Enterprise Manufacturing Intelligence Market Segmentation
Figure 2 Enterprise Manufacturing Intelligence Market: Research Design
Figure 3 Market Size Estimation Methodology: Bottom-Up Approach
Figure 4 Market Size Estimation Methodology: Top-Down Approach
Figure 5 Data Triangulation
Figure 6 Market, 2016�2022 (USD Billion)
Figure 7 Embedded Deployment Type Expected to Lead the EMI Market During the Forecast Period
Figure 8 EMI Market, By Application
Figure 9 The EMI Market for Automotive End�User Industry Expected to Hold Largest Market Size During Forecast Period
Figure 10 North America to Hold the Largest Market Share in 2016, While APAC to Grow at the Highest Rate During the Forecast Period
Figure 11 Demand From Automotive Industry is Likely to Create Attractive Growth Opportunities in the Market
Figure 12 Embedded EMI Market Expected to Grow at the Highest Rate Between 2016 and 2022
Figure 13 Services Segment Expected to Hold the Largest Share of the Market in 2016
Figure 14 Automotive Industry to Hold the Largest Share of the Global Market in 2016
Figure 15 U.S. to Hold the Largest Share of the Market in 2016
Figure 16 Impact of Industrial Revolution on EMI
Figure 17 Market, By Geography
Figure 18 Drivers, Restraints, Opportunities, and Challenges of the Market
Figure 19 Value Chain Analysis: Maximum Value is Added During the EMI R&D and Software Development Stage
Figure 20 Threat of New Entrants and Intensity of Rivalry Expected to Have A High Impact
Figure 21 Porter�s Five Forces Analysis, 2015
Figure 22 Impact of Intensity of Rivalry on Market in 2015
Figure 23 Impact of Threat of Substitutes on Market in 2015
Figure 24 Impact of Bargaining Power of Buyers on Market in 2015
Figure 25 Impact of Bargaining Power of Suppliers on Market in 2015
Figure 26 Impact of Threat of New Entrants on Market in 2015
Figure 27 Embedded Deployment Type Expected to Lead the Market Between 2016 and 2022
Figure 28 Market, By Application
Figure 29 Types of Manufacturing Data Acquired for Data Contextualization
Figure 30 Services Segment Likely to Lead the EMI Market Based on Offering Between 2016 and 2022
Figure 31 Process Industry to Hold the Largest Size of the EMI Market Between 2016 and 2022
Figure 32 EMI Market for Food and Beverages Industry Expected to Grow at the Highest Rate Between 2016 and 2022
Figure 33 Americas Expected to Hold the Largest Size of the EMI Market for the Energy and Power Industry By 2022
Figure 34 Americas is Expected to Hold the Largest Size of the EMI Market for Food and Beverages Industry
Figure 35 EMI Market in APAC for Oil and Gas Industry Expected to Grow at the Highest Rate During the Forecast Period
Figure 36 EMI Market in APAC to Grow at the Highest Rate During the Forecast Period
Figure 37 Americas to Hold the Largest Size of the EMI Market for Other Process Industries By 2022
Figure 38 Automotive Industry Expected to Dominate the EMI Market for Discrete Industries Between 2016 and 2022
Figure 39 EMI Market for Aerospace and Defense Industry in APAC Expected to Grow at the Highest Rate During the Forecast Period
Figure 40 EMI Market in APAC for Automotive Industry Expected to Register the Highest Growth Rate During the Forecast Period
Figure 41 Americas Likely to Hold the Largest Size of the EMI Market for Medical Devices Industry By 2022
Figure 42 APAC to Lead the EMI Market in Semiconductor and Electronics Industry During the Forecast Period
Figure 43 Geographic Snapshot: Global EMI Market
Figure 44 EMI Market in APAC Expected to Grow at the Highest Rate Between 2016 and 2022
Figure 45 Snapshot: EMI Market in North America
Figure 46 U.S. to Lead the North American EMI Market Between 2016 and 2022
Figure 47 EMI Market Snapshot in Europe
Figure 48 Germany Expected to Dominate the EMI Market in Europe
Figure 49 China Anticipated to Witness Fastest Growth in the EMI Market By 2022
Figure 50 Companies Adopted New Product Development as the Key Growth Strategy Between 2014 and 2016
Figure 51 Market Evolution Framework: New Product Developments Fuelled the Growth of the Market, 2013�2016
Figure 52 Battle for Market Share: New Product Launches is the Key Strategy
Figure 53 Geographic Revenue Mix of Top 5 Players (2015)
Figure 54 ABB Ltd.: Company Snapshot
Figure 55 ABB Ltd.: SWOT Analysis
Figure 56 Honeywell International Inc.: Company Snapshot
Figure 57 Honeywell International Inc.: SWOT Analysis
Figure 58 Rockwell Automation, Inc.: Company Snapshot
Figure 59 Rockwell Automation, Inc.: SWOT Analysis
Figure 60 Schneider Electric SE : Company Snapshot
Figure 61 Schneider Electric SE: SWOT Analysis
Figure 62 Siemens AG: Company Snapshot
Figure 63 Siemens AG: SWOT Analysis
Figure 64 Aspen Technology, Inc.: Company Snapshot
Figure 65 Dassault Systemes Sa: Company Snapshot
Figure 66 Emerson Electric Co.: Company Snapshot
Figure 67 General Electric Co.: Company Snapshot
Figure 68 SAP SE: Company Snapshot
Figure 69 Yokogawa Electric Corporation: Company Snapshot


Growth opportunities and latent adjacency in Enterprise Manufacturing Intelligence Market