BYOD and Enterprise Mobility Market by Software (MDM, Mobile Content Management), Security (Device Security, Network Security, IAM), Service (Managed & Professional Services), Deployment (Cloud & On-Premise), Vertical, and Region - Global Forecast to 2021


[162 Pages Report] The BYOD and enterprise mobility market size is expected to grow from USD 35.10 Billion in 2016 to USD 73.30 Billion by 2021, at a Compound Annual Growth Rate (CAGR) of 15.87%. The base year considered for the study is 2015 and the forecast period has been determined from 2016 to 2021.
The objectives of the report are to define, describe, and forecast the BYOD and enterprise mobility market size on the basis of software, security, services, deployment, verticals, and regions, to provide detailed information regarding key factors influencing the market growth (drivers, restraints, opportunities, and challenges), to track and analyze the market scenario on the basis of technological developments, product launches, and mergers & acquisitions and to forecast the market size of market segments with respect to five main regions, namely, North America, Europe, Asia-Pacific (APAC), Middle East and Africa (MEA), and Latin America.
This research study involves extensive usage of secondary sources, directories, and databases (such as Hoovers, Bloomberg Businessweek, Factiva, and OneSource) to identify and collect information useful for this technical, market-oriented, and commercial aspects of the market size.
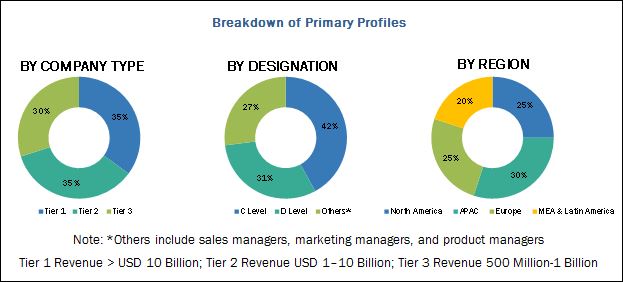
The research methodology used to estimate and forecast the BYOD and enterprise mobility market begins with capturing data on key vendor revenues through secondary research such as cloud computing association and telecom regulatory associations. The vendor offerings are also taken into consideration to determine the market segmentation. The bottom-up procedure is employed to arrive at the overall market size of the global BYOD and enterprise mobility market from the revenue of the key players in the market. After arriving at the overall market size, the total market is split into several segments and subsegments, which are then verified through primary research by conducting extensive interviews with key people, such as CEOs, VPs, directors, and executives. The data triangulation and market breakdown procedures are employed to complete the overall market engineering process and arrive at the exact statistics for all segments. The breakdown of primary profiles is depicted in the below figure:
The figure below shows the break-down of the primaries on the basis of company, designation, and region, conducted during the research study.
To know about the assumptions considered for the study, download the pdf brochure
The BYOD and enterprise mobility market ecosystem comprises aggregators and MNCs such as Microsoft Corporation, Cisco Systems, Inc., Blackberry Limited, Infosys Limited, IBM Corporation, Tata Consultancy Services Limited, SAP SE, Tech Mahindra Limited, AT&T, Honeywell International, Capgemini, Oracle Corporation, Accenture, and HCL Technologies.
Key Target Audience for BYOD and Enterprise Mobility Market
- Mobility Solution Providers
- Mobility Service Providers
- Mobile Application Consumers
- Device Manufactures
- BYOD Service Users
- Application and software developers
- Enterprises/SMEs
- Regulatory Bodies and Telecommunication Organization
Scope of the BYOD and Enterprise Mobility Market Report
|
Report Metrics |
Details |
|
Market size available for years |
2016�2021 |
|
Base year considered |
2015 |
|
Forecast period |
2016�2021 |
|
Forecast units |
Billion (USD) |
|
Segments covered |
Software, Security, Service, Deployment, Vertical and Region |
|
Geographies covered |
North America, Europe, MEA, APAC and Latin America |
|
Companies covered |
Microsoft Corporation (Washington, U.S.), Cisco Systems, Inc. (California, U.S.), Blackberry Limited (Ontario, Canada.), Infosys Limited (Bengaluru, India), IBM Corporation (New York, U.S.), Tata Consultancy Services Limited (Mumbai, India), SAP SE (Walldorf, Germany), Tech Mahindra Limited (Pune, India), AT&T (Texas, U.S.), Honeywell International (New Jersey, U.S.), Capgemini (Paris, France), Oracle Corporation (California, U.S.), Accenture (Dublin, Ireland), and HCL (Noida, India). |
The BYOD and enterprise mobility market report is broadly segmented into the following software, security, services, deployment, vertical, and region.
By Software
- Mobile Device Management
- Mobile Application Management
- Mobile Data Management
- Mobile Email management
- Mobile Telecom Expense Management
- Others (Mobile Recovery Management and Wireless Expense Management)
By Security
- Device Security
- Email Security
- Applications Security
- Mobile Content Security
- Mobile Fleets Security
- Network Security
- Identity Access Management
- Multi-user Management
BYOD and Enterprise Mobility Market By Service
- Managed Services
- Professional Services
By Deployment
- Cloud
- On-Premise
By Vertical
- BFSI
- Automobile
- Manufacturing
- IT & Telecom
- Retail
- Healthcare
- Transportation and Logistics
- Energy and Utilities
- Others (Government, Education, and Media & Entertainment)
By Region
- North America
- Europe
- APAC
- MEA
- Latin America
Available Customizations
With the given market data, MarketsandMarkets offers customizations based on company-specific needs. The following customization options are available for the report:
Geographic Analysis
- Further breakdown of the APAC market into countries contributing 75% to the regional market size
- Further breakdown of the North American market into countries contributing 75% to the regional market size
- Further breakdown of the Latin American market into countries contributing 75% to the regional market size
- Further breakdown of the MEA market into countries contributing 75% to the regional market size
- Further breakdown of the European market into countries contributing 75% to the regional market size
Company Information
- Detailed analysis and profiling of additional market players (Up to 5).
MarketsandMarkets forecasts the BYOD and enterprise mobility market to grow from USD 35.10 Billion in 2016 to USD 73.30 Billion by 2021, at a CAGR of 15.87%. Increased productivity and employee satisfaction, reduced hardware cost for enterprises, increased smartphone penetration, demand for enterprise mobility software in large enterprises with in-house IT departments, and growing prominence of managed mobility services are some of the driving forces of the market.
The objectives of the report are to define, describe, and forecast the BYOD and enterprise mobility market size on the basis of software, security, services, deployment, verticals, and regions. The mobile device management software has the largest market share in the BYOD and enterprise mobility software market during the forecast period. Its market share is expected to grow because of the rapid increase in the use of mobile devices for personal as well as professional work.
Among the security markets, device security segment is expected to hold the largest market share during the forecast period; this segment provides security measures to protect mobile data for individuals and enterprises. Among the service markets, professional services are expected to grow at the fastest rate during the forecast period.
Among deployment, the cloud-based mobility market is expected to have the largest market share during the forecast period. This is because of the rapid use of cloud services and benefits associated with it. On-premises market is projected to grow at the fastest rate during the forecast period.
Among the verticals, the retail sector is expected to hold the largest market share during the forecast period while manufacturing vertical is projected to grow at the highest CAGR from 2016 to 2021 in the BYOD and enterprise mobility market.
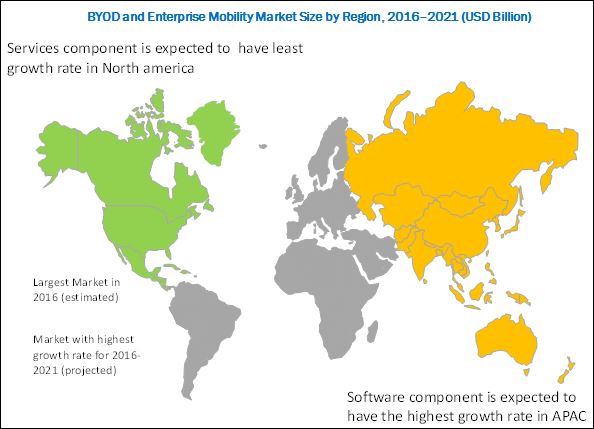
North America is expected to hold the largest market share in 2016 and Asia-Pacific (APAC) is expected to grow at the highest rate in the BYOD and enterprise mobility market during the forecast period. This is because of the huge acceptance of BYOD and enterprise mobility services by the enterprises. The increasing innovative developments in technologies are benefiting all the stakeholders present in the market.
However, the varying nature of government rules and regulations across the globe and risk associated with security of data would be the restraining factors for the BYOD and enterprise mobility market.
The key players in the BYOD and enterprise mobility market include Microsoft Corporation (Washington, U.S.), Cisco Systems, Inc. (California, U.S.), Blackberry Limited (Ontario, Canada.), Infosys Limited (Bengaluru, India), IBM Corporation (New York, U.S.), Tata Consultancy Services Limited (Mumbai, India), SAP SE (Walldorf, Germany), Tech Mahindra Limited (Pune, India), AT&T (Texas, U.S.), Honeywell International (New Jersey, U.S.), Capgemini (Paris, France), Oracle Corporation (California, U.S.), Accenture (Dublin, Ireland), and HCL (Noida, India). These players have adopted various strategies such as partnerships, agreements, mergers & acquisitions, and new product developments to achieve growth in the global market.
To speak to our analyst for a discussion on the above findings, click Speak to Analyst
Table of Contents
1 Introduction (Page No. - 15)
1.1 Objectives of the Study
1.2 Market Definition
1.3 Market Scope
1.3.1 Markets Covered
1.3.2 Years Considered in the Report
1.4 Currency
1.5 Limitations
1.6 Stakeholders
2 Research Methodology (Page No. - 19)
2.1 Research Data
2.1.1 Secondary Data
2.1.1.1 Key Data Taken From Secondary Sources
2.1.2 Primary Data
2.1.2.1 Key Data Taken From Primary Sources
2.1.2.2 Breakdown of Primary Interviews
2.2 Market Size Estimation
2.2.1 Bottom-Up Approach
2.2.2 Top-Down Approach
2.3 Market Breakdown and Data Triangulation
2.4 Assumptions
3 Executive Summary (Page No. - 26)
4 Premium Insights (Page No. - 30)
4.1 Attractive Market Opportunities in the BYOD and Enterprise Mobility Market
4.2 Market, By Software
4.3 BYOD and Enterprise Mobility Market
4.4 BYOD and Enterprise Mobility Market Potential
4.5 BYOD and Enterprise Mobility: Regional Market
4.6 Lifecycle Analysis, By Region, 2016
5 Market Overview (Page No. - 33)
5.1 Introduction
5.2 Market Segmentation
5.3 Market Dynamics
5.3.1 Drivers
5.3.1.1 Increased Productivity and Employee Satisfaction
5.3.1.2 Reduced Hardware Cost for Enterprises
5.3.1.3 Increase in Smartphone Penetration
5.3.1.4 Increase in Mobile Data and Mobile Devices
5.3.2 Restraints
5.3.2.1 Government and Compliance Issues
5.3.2.2 High Cost of BYOD and Enterprise Mobility Solutions
5.3.2.3 Security Risks Vis-�-Vis Device Management
5.3.3 Opportunities
5.3.3.1 Increase in Adoption of Cloud-Based Technology
5.3.3.2 Increasing Trend of BYOD
5.3.4 Challenges
5.3.4.1 Difficulties With Selecting the Best Enterprise Mobility and BYOD Solution
5.3.4.2 Complexities in Upgradation and Lack of System Integrators
5.3.4.3 Policy Compliance Issues
5.3.4.4 Information Security Concerns
5.4 Regulatory Implications
5.4.1 Introduction
5.4.1.1 Health Insurance Portability and Accountability Act (HIPAA)
5.4.1.2 Federal Information Security Management Act (FISMA)
5.4.1.3 Federal Information Processing Standard (FIPS)
5.4.1.4 Children�s Online Privacy Protection Act (COPAA)
5.4.1.5 Child Internet Protection Act (CIPA)
5.4.1.6 the Personal Data (Protection) Bill, 2013�India
5.4.1.7 Data Protection Act 1998 (DPA)�U.K.
5.4.1.8 It Security Act (ITSA)�Germany
6 Industry Trends (Page No. - 44)
6.1 Introduction
6.2 Evolution
6.3 Value Chain Analysis
7 Market Analysis, By Device (Page No. - 47)
7.1 Introduction
7.2 Smartphones
7.3 Laptops
7.4 Tablets/Phablets
8 BYOD and Enterprise Mobility Market Analysis, By Component (Page No. - 52)
8.1 Market Analysis, By Software
8.1.1 Introduction
8.1.2 Mobile Device Management
8.1.3 Mobile Application Management
8.1.4 Mobile Data Management
8.1.5 Mobile Email Management
8.1.6 Mobile Telecom Expense Management
8.1.7 Others
8.2 Market Analysis, By Security
8.2.1 Introduction
8.2.2 Device Security
8.2.3 Email Security
8.2.4 Application Security
8.2.5 Mobile Content Security
8.2.6 Network Security
8.2.7 Identity Access Management
8.2.8 Multi-User Management
8.3 Market Analysis, By Service
8.3.1 Introduction
8.3.2 Managed Services
8.3.3 Professional Services
9 Market Analysis, By Deployment (Page No. - 68)
9.1 Introduction
9.2 Cloud
9.3 On-Premises
10 BYOD and Enterprise Mobility Market Analysis, By Vertical (Page No. - 71)
10.1 Introduction
10.2 Banking, Financial Services, and Insurance
10.3 Automobile
10.4 Manufacturing
10.5 IT and Telecom
10.6 Retail
10.7 Healthcare
10.8 Transportation and Logistics
10.9 Energy and Utilities
10.10 Others
11 Geographic Analysis (Page No. - 82)
11.1 Introduction
11.2 North America
11.3 Europe
11.4 Asia-Pacific
11.5 Middle East and Africa
11.6 Latin America
12 Competitive Landscape (Page No. - 103)
12.1 Overview
12.2 Portfolio Comparison
12.3 Competitive Situation and Trends
12.3.1 Agreements, Partnerships, and Collaborations
12.3.2 New Products and Service Developments
12.3.3 Mergers and Acquisitions
12.3.4 Business Expansion
13 Company Profiles (Page No. - 109)
13.1 Introduction
(Overview, Financials, Products & Services, Strategy, and Developments)*
13.2 Microsoft Corporation
13.3 Cisco Systems, Inc.
13.4 Blackberry Limited
13.5 Infosys Limited
13.6 International Business Machines Corporation
13.7 Tata Consultancy Services Limited
13.8 SAP SE
13.9 Tech Mahindra Limited
13.10 AT&T
13.11 Honeywell International, Inc.
13.12 Capgemini
13.13 Oracle Corporation
13.14 Accenture
13.15 HCL Technologies Limited
*Details on Overview, Financials, Product & Services, Strategy, and Developments Might Not Be Captured in Case of Unlisted Companies.
14 Appendix (Page No. - 148)
14.1 Other Developments
14.1.1 Agreements, Partnerships, and Collaborations, 2014 - 2016
14.1.2 New Product Developments, 2014 - 2016
14.1.3 Mergers and Acquisitions, 2014 - 2016
14.1.4 Business Expansions, 2016
14.2 Discussion Guide
14.3 Knowledge Store: Marketsandmarkets� Subscription Portal
14.4 Introducing RT: Real-Time Market Intelligence
14.5 Available Customizations
14.6 Related Reports
14.7 Author Details
List of Tables (76 Tables)
Table 1 Global BYOD and Enterprise Mobility Market Size and Growth Rate, 2014�2021 (USD Billion, Yoy %)
Table 2 BYOD and Enterprise Mobility Devices Market Shipment, 2014�2021 (Million Units)
Table 3 Smartphones: Market Shipment, By Region, 2014�2021 (Million Units)
Table 4 Laptops: Market Shipment, By Region, 2014�2021 (Million Units)
Table 5 Tablets/Phablets: Market Shipment, By Region, 2014�2021 (Million Units)
Table 6 BYOD and Enterprise Mobility Market Size, By Software, 2014�2021 (USD Billion)
Table 7 Mobile Device Management: Market Size, By Region, 2014�2021 (USD Million)
Table 8 Mobile Application Management: Market Size, By Region, 2014�2021 (USD Million)
Table 9 Mobile Data Management: Market Size, By Region, 2014�2021 (USD Million)
Table 10 Mobile Email Management: Market Size, By Region, 2014�2021 (USD Million)
Table 11 Mobile Telecom Expense Management: Market Size, By Region, 2014�2021 (USD Million)
Table 12 Others: Market Size, By Region, 2014�2021 (USD Million)
Table 13 BYOD and Enterprise Mobility Market Size, By Security, 2014�2021 (USD Billion)
Table 14 Device Security: Market Size, By Region, 2014�2021 (USD Million)
Table 15 Email Security: Market Size, By Region, 2014�2021 (USD Million)
Table 16 Application Security: Market Size, By Region, 2014�2021 (USD Million)
Table 17 Mobile Content Security: Market Size, By Region, 2014�2021 (USD Million)
Table 18 Network Security: Market Size, By Region, 2014�2021 (USD Million)
Table 19 Identity Access Management: Market Size, By Region, 2014�2021 (USD Million)
Table 20 Multi-User Management: Market Size, By Region, 2014�2021 (USD Million)
Table 21 BYOD and Enterprise Mobility Market Size, By Service, 2014�2021 (USD Billion)
Table 22 Managed Services: Market Size, By Region, 2014�2021 (USD Million)
Table 23 Professional Services: Market Size, By Region, 2014�2021 (USD Million)
Table 24 BYOD and Enterprise Mobility Market Size, By Deployment, 2014�2021 (USD Billion)
Table 25 Cloud: BYOD and Enterprise Mobility, By Region, 2014�2021 (USD Billion)
Table 26 On-Premises: BYOD and Enterprise Mobility, By Region, 2014�2021 (USD Million)
Table 27 Market Size, By Vertical, 2014�2021 (USD Billion)
Table 28 Banking, Financial Services, and Insurance: BYOD and Enterprise Mobility Market Size, By Region, 2014�2021 (USD Million)
Table 29 Automobile: Market Size, By Region, 2014�2021 (USD Million)
Table 30 Manufacturing: Market Size, By Region, 2014�2021 (USD Million)
Table 31 IT and Telecom: Market Size, By Region, 2014�2021 (USD Million)
Table 32 Retail: Market Size, By Region, 2014�2021 (USD Million)
Table 33 Healthcare: Market Size, By Region, 2014�2021 (USD Million)
Table 34 Transportation and Logistics: Market Size, By Region, 2014�2021 (USD Million)
Table 35 Energy and Utilities: Market Size, By Region, 2014�2021 (USD Million)
Table 36 Others: Market Size, By Region, 2014�2021 (USD Million)
Table 37 BYOD and Enterprise Mobility Market Size, By Region, 2014�2021 (USD Billion)
Table 38 North America: BYOD and Enterprise Mobility Market Size, By Country, 2014�2021 (USD Billion)
Table 39 North America: Market Size, By Component, 2014�2021 (USD Billion)
Table 40 North America: Market Size, By Software, 2014�2021 (USD Million)
Table 41 North America: Market Size, By Security, 2014�2021 (USD Million)
Table 42 North America: Market Size, By Service, 2014�2021 (USD Million)
Table 43 North America: Market Size, By Deployment, 2014�2021 (USD Billion)
Table 44 North America: Market Size, By Vertical, 2014�2021 (USD Million)
Table 45 Europe : BYOD and Enterprise Mobility Market Size, By Country, 2014�2021 (USD Million)
Table 46 Europe : Market Size, By Component, 2014�2021 (USD Billion)
Table 47 Europe : Market Size, By Software, 2014�2021 (USD Million)
Table 48 Europe : Market Size, By Security, 2014�2021 (USD Million)
Table 49 Europe : Market Size, By Service, 2014�2021 (USD Million)
Table 50 Europe : Market Size, By Deployment, 2014�2021 (USD Billion)
Table 51 Europe : Market Size, By Vertical, 2014�2021 (USD Million)
Table 52 Asia-Pacific: BYOD and Enterprise Mobility Market Size, By Country, 2014�2021 (USD Million)
Table 53 Asia-Pacific: Market Size, By Component, 2014�2021 (USD Billion)
Table 54 Asia-Pacific: Market Size, By Software, 2014�2021 (USD Million)
Table 55 Asia-Pacific: Market Size, By Security, 2014�2021 (USD Million)
Table 56 Asia-Pacific: Market Size, By Service, 2014�2021 (USD Million)
Table 57 Asia-Pacific: Market Size, By Deployment, 2014�2021 (USD Billion)
Table 58 Asia-Pacific: Market Size, By Vertical, 2014�2021 (USD Million)
Table 59 Middle East and Africa: BYOD and Enterprise Mobility Market Size, By Sub-Region, 2014�2021 (USD Billion)
Table 60 Middle East and Africa: Market Size, By Component, 2014�2021 (USD Million)
Table 61 Middle East and Africa: Market Size, By Software, 2014�2021 (USD Million)
Table 62 Middle East and Africa: Market Size, By Security, 2014�2021 (USD Million)
Table 63 Middle East and Africa: Market Size, By Service, 2014�2021 (USD Million)
Table 64 Middle East and Africa: Market Size, By Deployment, 2014�2021 (USD Million)
Table 65 Middle East and Africa: Market Size, By Vertical, 2014�2021 (USD Million)
Table 66 Latin America: BYOD and Enterprise Mobility Market Size, By Country, 2014�2021 (USD Million)
Table 67 Latin America: Market Size, By Component, 2014�2021 (USD Million)
Table 68 Latin America: Market Size, By Software, 2014�2021 (USD Million)
Table 69 Latin America: Market Size, By Security, 2014�2021 (USD Million)
Table 70 Latin America: Market Size, By Service, 2014�2021 (USD Million)
Table 71 Latin America: Market Size, By Deployment, 2014�2021 (USD Million)
Table 72 Latin America: Market Size, By Vertical, 2014�2021 (USD Million)
Table 73 Agreements, Partnerships, and Collaborations, 2016
Table 74 New Product Developments, 2016
Table 75 Mergers and Acquisitions, 2016
Table 76 Business Expansions, 2014�2016
List of Figures (63 Figures)
Figure 1 Global BYOD and Enterprise Mobility Market: Research Design
Figure 2 Breakdown of Primary Interview: By Company Type, Designation, and Region
Figure 3 Market Size Estimation Methodology: Bottom-Up Approach
Figure 4 Market Size Estimation Methodology: Top-Down Approach
Figure 5 Data Triangulation
Figure 6 BYOD and Enterprise Mobility Market Size, By Software Snapshot (2016 and 2021): Mobile Application Management Segment is Expected to Grow at the Highest CAGR During the Forecast Period
Figure 7 BYOD and Enterprise Mobility Market Size, By Security Snapshot (2016 and 2021): Identity Access Management Segment is Expected to Grow at the Highest CAGR During the Forecast Period
Figure 8 Market Size, By Service Snapshot (2016 and 2021)
Figure 9 Market Size, By Industry Snapshot (2016 and 2021)
Figure 10 North America is Estimated to Hold the Largest Market Share in 2016
Figure 11 Increase in Smartphone Penetration and Decrease in Hardware Cost for Enterprises are Driving the Market
Figure 12 BYOD and Enterprise Mobility Market, By Software, 2014�2021 (USD Million)
Figure 13 North America is Estimated to Hold the Largest Share in the BYOD and Enterprise Mobility Market (2016)
Figure 14 Asia-Pacific is Expected to Have the Highest Growth Potential During the Forecast Period
Figure 15 Asia-Pacific to Grow Faster Than the Other Regions
Figure 16 Regional Lifecycle: Asia-Pacific is Estimated to Grow at the Highest Growth Rate, 2016
Figure 17 Market, By Software
Figure 18 Market, By Security
Figure 19 Market, By Service
Figure 20 Market, By Deployment
Figure 21 Market, By Vertical
Figure 22 Market, By Region
Figure 23 Market: Drivers, Restraints, Opportunities, and Challenges
Figure 24 Value Chain Analysis (2016)
Figure 25 Tablets/Phablets Segment Exhibits the Highest Growth Rate Among All the Device Shipments
Figure 26 Software Segment Exhibits the Highest Growth Rate in the Market
Figure 27 Mobile Application Segment Exhibits the Highest Growth Rate in the BYOD and Enterprise Mobility Market
Figure 28 Identity and Access Management Exhibits the Highest Growth Rate in the Market
Figure 29 Professional Services Segment Exhibits A Higher Growth Rate in the Market
Figure 30 On-Premises Segment Exhibits A Higher Growth Rate in the Global Market
Figure 31 Manufacturing Exhibits the Fastest Growth Rate in the Market
Figure 32 Asia-Pacific Will Exhibit the Highest Growth Rate in the Market
Figure 33 North America: BYOD and Enterprise Mobility Market Snapshot
Figure 34 Asia-Pacific: BYOD and Enterprise Mobility Market Snapshot
Figure 35 Companies Adopted Partnership and Agreement as the Key Growth Strategy During the Period 2014�2016
Figure 36 BYOD and Enterprise Mobility: Portfolio Comparison
Figure 37 Market Evaluation Framework
Figure 38 Battle for Market Share: Partnership and Agreement has Been the Key Strategy for Company Growth
Figure 39 Geographic Revenue Mix of Top 5 Market Players
Figure 40 Microsoft Corporation: Company Snapshot
Figure 41 Microsoft Corporation: SWOT Analysis
Figure 42 Cisco Systems, Inc.: Company Snapshot
Figure 43 Cisco Systems, Inc.: SWOT Analysis
Figure 44 Blackberry Limited: Company Snapshot
Figure 45 Blackberry Limited: SWOT Analysis
Figure 46 Infosys Limited: Company Snapshot
Figure 47 Infosys Limited : SWOT Analysis
Figure 48 International Business Machines Corporation: Company Snapshot
Figure 49 International Business Machine Corporation : SWOT Analysis
Figure 50 Tata Consultancy Services Limited : Company Snapshot
Figure 51 Tata Consultancy Services Limited: SWOT Analysis
Figure 52 SAP SE: Company Snapshot
Figure 53 SAP SE: SWOT Analysis
Figure 54 Tech Mahindra Limited : Company Snapshot
Figure 55 Tech Mahindra Limited: SWOT Analysis
Figure 56 AT&T: Company Snapshot
Figure 57 AT&T: SWOT Analysis
Figure 58 Honeywell International, Inc.: Company Snapshot
Figure 59 Honeywell International, Inc.: SWOT Analysis
Figure 60 Capgemini: Company Snapshot
Figure 61 Oracle Corporation: Company Snapshot
Figure 62 Accenture: Company Snapshot
Figure 63 HCL Technologies Limited: Company Snapshot


Growth opportunities and latent adjacency in BYOD and Enterprise Mobility Market
Interested in understanding market size of the Software and Security segments
Interested in understanding BYOD and Enterprise Mobility Market
Interested in understanding market trends