Field Force Automation Market by Component (Solution and Services), Organization Size, Deployment Type, Industry (IT and Telecom, Energy and Utilities, Manufacturing, and Transportation and Logistics), and Region - Global Forecast to 2024


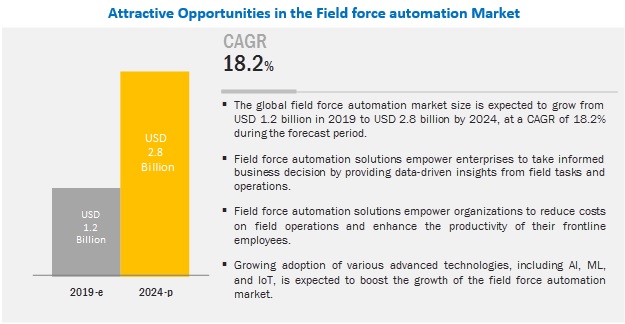
[153 Pages Report] MarketsandMarkets estimates the global field force automation market to grow from USD 1.2 billion in 2019 to USD 2.8 billion by 2024, at a Compound Annual Growth Rate (CAGR) of 18.2% during the forecast period. Factors that drive the growth of market are rising demand for robust solutions for maximizing the efficiency of field forces in real-time and growing adoption of cloud-based enterprise mobility solutions.
Solution segment to hold a larger market size during the forecast period
The field force automation market by component covers, solution, and services. The solution component is estimated to hold a larger market size during the forecast period. This is mainly due to the integration capabilities of solutions to integrate with existing systems, such as ERP, CRM, and FSM and availability of deployment options for different mobile devices. Furthermore, advanced features of field force automation solution, such as automated scheduling and worker dispatching, daily reporting, attendance management, mobile workforce monitoring, and tracking, and real-time communication and collaboration fuels the demand for field force automation solution.
Large enterprises to hold the largest market share during the forecast period in the field force automation market
The adoption of field force automation solution among large enterprises is high due to increasing deployment of newer technologies, such as IoT and AI, growing use of mobile devices and internet to streamline field crews and need to cater geographically dispersed customer base. Moreover, the increasing demand of organizations to provide their workforce with access to advanced computing resources and applications ubiquitously drives the demand for field force automation solutions among large enterprises. For instance, large manufacturing companies need to quickly cater to sudden alerts from sensors or actuators attached to their physical assets. With field force automation, these companies can quickly deploy the right technician or worker closer to the asset. Subsequently, this helps them to avoid downtime and loss in production and in turn, increase the efficiency of field workers at the manufacturing floors.
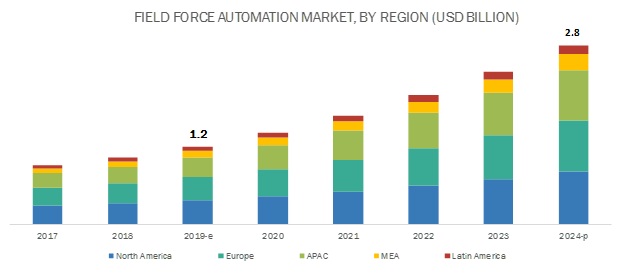
North America to account for the largest market size during the forecast period
The global market by region covers five major geographic regions, namely, North America, Asia Pacific (APAC), Europe, Middle East and Africa (MEA), and Latin America. North America is expected to account for the largest market size during the forecast period due to the presence of a large number of field force automation vendors and increasing technology adoption among North American enterprises for improving field crew efficiency.
Key Field Force Automation Market Players
The major players in the market are ServiceMax (US), IFS (Sweden), Microsoft (US), SAP (Germany), Oracle (US), Trimble (US), ClickSoftware (US), Salesforce (US), Astea (US), FieldEZ (India), BT, Accruent (US), Acumatica (US), Folio3 (US), LeadSquared (India), Kloudq (India), Appobile Labs (India), Mize (US), Nimap Infotech (India), and Channelplay (India).
The study includes an in-depth competitive analysis of these key players in the market with their company profiles, recent developments, and key market strategies.
Get online access to the report on the World's First Market Intelligence Cloud
- Easy to Download Historical Data & Forecast Numbers
- Company Analysis Dashboard for high growth potential opportunities
- Research Analyst Access for customization & queries
- Competitor Analysis with Interactive dashboard
- Latest News, Updates & Trend analysis
Request Sample Scope of the Report
Get online access to the report on the World's First Market Intelligence Cloud
- Easy to Download Historical Data & Forecast Numbers
- Company Analysis Dashboard for high growth potential opportunities
- Research Analyst Access for customization & queries
- Competitor Analysis with Interactive dashboard
- Latest News, Updates & Trend analysis

|
Report Metric |
Details |
|
Market size available for years |
2017�2024 |
|
Base year considered |
2018 |
|
Forecast period |
2019�2024 |
|
Forecast units |
Billion (USD) |
|
Segments covered |
Component, Deployment Type, Organization Size, Industry Vertical, and Region |
|
Geographies covered |
North America, APAC, Europe, Latin America, and MEA |
|
Companies covered |
ServiceMax (US), IFS (Sweden), Microsoft (US), SAP (Germany), Oracle (US), Trimble (US), ClickSoftware (US), Salesforce (US), Astea (US), FieldEZ (India), BT, Accruent (US), Acumatica (US), Folio3 (US), LeadSquared (India), Kloudq (India), Appobile Labs (India), Mize (US), Nimap Infotech (India), and Channelplay (India) |
This research report categorizes the market based on component, application, organization size, vertical, and region.
Based on Components, the field force automation market has been segmented as follows:
- Solution
- Services
Based on Deployment Type, the market has been segmented as follows:
- On-premises
- Cloud
Based on Organization Sizes, the market has been segmented as follows
- SMEs
- Large Enterprises
Based on Verticals, the field force automation market has been segmented as follows
- IT and Telecom
- Healthcare and Life Sciences
- Manufacturing
- Transportation and Logistics
- Construction and Real Estate
- Energy and Utilities
- Others (Banking, Financial Services, and Insurance and Retail)
Based on Regions, the market has been segmented as follows:
- North America
- US
- Canada
- Europe
- UK
- Germany
- Rest of Europe
- APAC
- China
- ANZ
- Rest of APAC
- MEA
- UAE
- South Africa
- Rest of MEA
- Latin America
- Brazil
- Mexico
- Rest of Latin America
Recent Developments
- In May 2019, Microsoft improved the capabilities of Dynamics 365 for Field Service by releasing a new update to its connected field service solution. This enhancement would enable its end customers to use IoT capabilities, improve deployment time, and field productivity.
- In April 2019, Trimble launched Trimble PULSE Remote Expert, an Augmented Reality (AR) tool, that improves the productivity of field service technicians by connecting them with support experts via video, audio, and spatial annotations in real-time.
Frequently Asked Questions (FAQ):
What is growth rate of Field Force Automation market in the next five years?
The global Field Force Automation market size is expected to grow from USD 1.2 billion in 2019 to USD 2.8 billion by 2024, at a Compound Annual Growth Rate (CAGR) of 18.2% during the forecast period.
What region holds the highest market share in the Field Force Automation market?
North America has the highest market share in the Field Force Automation market, due to large number of leading vendors present in the region and increasing technology adoption among enterprises.
What are the major verticals in the Field Force Automation market?
Healthcare and life sciences, Manufacturing, transportation and logistics, are the major verticals adopting Field Force Automation solutions.
What are the key vendors in the Field Force Automation market?
ServiceMax (US), IFS (Sweden), Microsoft (US), SAP (Germany), Oracle (US), Trimble (US), ClickSoftware (US), Salesforce (US), Astea (US), FieldEZ (India), BT, Accruent (US), Acumatica (US), Folio3 (US), LeadSquared (India), Kloudq (India), Appobile Labs (India), Mize (US), Nimap Infotech (India), and Channelplay (India). .
To speak to our analyst for a discussion on the above findings, click Speak to Analyst
Table of Contents
1 Introduction (Page No. - 18)
1.1 Objectives of the Study
1.2 Market Definition
1.2.1 Inclusions and Exclusions
1.3 Market Scope
1.3.1 Market Segmentation
1.4 Years Considered for the Study
1.5 Currency Considered
1.6 Stakeholders
2 Research Methodology (Page No. - 22)
2.1 Research Data
2.1.1 Secondary Data
2.1.2 Primary Data
2.1.2.1 Breakup of Primaries
2.1.2.2 Key Industry Insights
2.2 Market Breakdown and Data Triangulation
2.3 Market Size Estimation
2.3.1 Top-Down Approach
2.3.2 Bottom-Up Approach
2.4 Market Forecast
2.5 Assumptions for the Study
2.6 Limitations of the Study
3 Executive Summary (Page No. - 30)
4 Premium Insights (Page No. - 33)
4.1 Attractive Market Opportunities in the Market
4.2 North America Field Force Automation Market, By Industry Vertical and Country
4.3 Market Major Countries
5 Market Overview and Industry Trends (Page No. - 36)
5.1 Introduction
5.2 Market Dynamics
5.2.1 Drivers
5.2.1.1 Rising Demand for Robust Solutions to Maximize the Efficiency of Field Forces in Real-Time
5.2.1.2 Growing Adoption of Cloud-Based Enterprise Mobility Solutions
5.2.2 Restraints
5.2.2.1 Resistance From Field Forces to Adopt Automated Solutions
5.2.3 Opportunities
5.2.3.1 Infusing AI and ML Capabilities for Streamlining Field Operations
5.2.3.2 Integration of IoT for Improved Automation
5.2.4 Challenges
5.2.4.1 Upfront Investments for Ensuring the Security of Mobile Devices
5.2.4.2 Selecting a Robust Mobile Workforce Solution That Perfectly Aligns With the Business Objectives
5.3 Industry Trends
5.3.1 Improved Productivity and Cycle Time Through Automated Scheduling, Field Force Mobilization, and Real-Time Field Force Tracking
5.3.2 Workforce Optimization Through Consistent Planning, Real-Time Activity Reporting, and Automated Expense Management
5.3.3 Improving Collaboration Among Field Forces to Increase Service Revenues and Efficiency Gains
6 Field Force Automation Market By Component (Page No. - 42)
6.1 Introduction
6.2 Solution
6.2.1 Demand for Real-Time Enterprise Mobility Solutions to Connect Mobile Workforce and Enhance Agent Productivity Driving the Adoption of Field Force Automation Solution
6.3 Services
6.3.1 Consulting
6.3.1.1 Need of Organizations to Identify Best Practices and Choose the Right Set of Solution to Automate Field Workforce Driving the Demand for Consulting Services
6.3.2 Integration and Implementation
6.3.2.1 Hassle-Free Deployment With Existing It Infrastructure to Drive the Demand for Integration and Implementation Services
6.3.3 Training and Support
6.3.3.1 Need for Resolving Critical Business Issues and Reducing Resource Wastage to Create the Demand for Training and Support Services
7 Field Force Automation Market By Organization Size (Page No. - 51)
7.1 Introduction
7.2 Large Enterprises
7.2.1 Growing Assimilation of Newer Technologies to Boost the Adoption of Field Force Automation Solution Among Large Enterprises
7.3 Small and Medium-Sized Enterprises
7.3.1 Demand for Cloud-Based Automation Solutions to Fuel the Adoption of Field Force Automation Solution in Small and Medium-Sized Enterprises
8 Market By Deployment Type (Page No. - 57)
8.1 Introduction
8.2 On-Premises
8.2.1 Data Privacy and Data Security Benefits to Fuel the Demand for On-Premises Field Force Automation Solution
8.3 Cloud
8.3.1 Benefits of Quick Deployment and Low Energy Costs to Propel the Adoption of Cloud-Based Field Force Automation Solution
9 Field Force Automation Market By Industry Vertical (Page No. - 63)
9.1 Introduction
9.2 IT and Telecom
9.2.1 Optimizing Field Worker Dispatch for Managing Dispersed Assets to Boost the Demand for Field Force Automation Solutions in IT and Telecom
9.3 Healthcare and Life Sciences
9.3.1 Improving Medical Services and Clinical Trials Through Proper Worker Scheduling and Dispatch to Fuel the Adoption of Field Force Automation Solution in Healthcare and Life Sciences
9.4 Manufacturing
9.4.1 Preventing Future Downtimes and Gaining Real-Time Visibility Into Manufacturing Floors to Propel the Adoption of Field Force Automation Solution in Manufacturing
9.5 Transportation and Logistics
9.5.1 Planning Routes and Capacity for Ensuring On-Time Service Delivery to Boost the Adoption of Field Force Automation in Transportation and Logistics
9.6 Construction and Real Estate
9.6.1 Delivering Fast On-Site Repair and Maintenance to Ensure the Safety of On-Site Workers to Boost the Adoption of Field Force Automation Solution in Construction and Real Estate
9.7 Energy and Utilities
9.7.1 Eliminating Crew Dependency on Centralized Dispatchers to Ensure On-Time Arrivals Driving Adoption of Field Force Automation Solution in Energy and Utilities
9.8 Others
10 Field Force Automation Market By Region (Page No. - 72)
10.1 Introduction
10.2 North America
10.2.1 United States
10.2.1.1 High Technology Assimilation and the Presence of a Large Number of Players to Drive the Adoption of Field Force Automation Solution in the US
10.2.2 Canada
10.2.2.1 Deployment of Cloud-Based Field Force Automation Solution for Managing the Rising Workloads to Propel the Market Growth in Canada
10.3 Europe
10.3.1 United Kingdom
10.3.1.1 Strong Economic Growth and Rising Technology Adoption to Fuel the Growth of the Field Force Automation Market in the UK
10.3.2 Germany
10.3.2.1 Rising Demand for Automation Across Enterprises to Fuel the Adoption of Field Force Automation Solution in Germany
10.3.3 Rest of Europe
10.4 Asia Pacific
10.4.1 Australia and New Zealand
10.4.1.1 Rising Investment in Labor-Savvy Technologies and Increased R&D Activities to Bolster the Adoption of Field Force Automation Solution in ANZ
10.4.2 China
10.4.2.1 High Automation Readiness Index and Declining Labor Force to Propel the Demand for Field Force Automation Solution in China
10.4.3 Rest of Asia Pacific
10.5 Middle East and Africa
10.5.1 South Africa
10.5.1.1 Influx of Cloud Services to Fuel the Adoption of Cloud-Based Field Force Automation Solution in South Africa
10.5.2 United Arab Emirates
10.5.2.1 High Ict Access and Use, and Increase in Awareness of Benefits of Automation Technologies to Drive the Growth of Market in the UAE
10.5.3 Rest of Middle East and Africa
10.6 Latin America
10.6.1 Brazil
10.6.1.1 Need for Increasing Total Factor Productivity Through Data-Driven Automation to Propel the Growth of Market in Brazil
10.6.2 Mexico
10.6.2.1 Increasing Awareness of the Benefits of Field Force Automation to Boost the Adoption of Field Force Automation Solution in Mexico
10.6.3 Rest of Latin America
11 Competitive Landscape (Page No. - 104)
11.1 Introduction
11.2 Competitive Scenario
11.2.1 New Product/Solution Launches and Product Enhancements
11.2.2 Acquisitions
11.2.3 Partnerships and Agreements
11.3 Competitive Leadership Mapping
11.3.1 Visionary Leaders
11.3.2 Dynamic Differentiators
11.3.3 Innovators
11.3.4 Emerging Companies
12 Company Profiles (Page No. - 110)
12.1 Introduction
(Business Overview, Solutions, Products & Services, Key Insights, Recent Developments, SWOT Analysis, MnM View)*
12.2 ServiceMax
12.3 ClickSoftware
12.4 Oracle
12.5 Microsoft
12.6 IFS
12.7 Salesforce
12.8 Trimble
12.9 SAP
12.10 Astea
12.11 BT
12.12 Accruent
12.13 Acumatica
12.14 FieldEZ
12.15 Folio3
12.16 Leadsquared
12.17 Mize
12.18 Kloudq Technologies
12.19 Appobile Labs
12.20 Channelplay
12.21 Nimap Infotech
*Details on Business Overview, Solutions, Products & Services, Key Insights, Recent Developments, SWOT Analysis, MnM View Might Not be Captured in Case of Unlisted Companies.
13 Appendix (Page No. - 145)
13.1 Knowledge Store: Marketsandmarkets� Subscription Portal
13.2 Available Customizations
13.3 Related Reports
13.4 Author Details
List of Tables (108 Tables)
Table 1 United States Dollar Exchange Rate, 2016�2018
Table 2 Factor Analysis
Table 3 Field Force Automation Market Size, By Component, 2017�2024 (USD Million)
Table 4 Solution: Market Size By Region, 2017�2024 (USD Million)
Table 5 North America: Solution Market Size, By Country, 2017�2024 (USD Million)
Table 6 Europe: Solution Market Size, By Country, 2017�2024 (USD Million)
Table 7 Asia Pacific: Solution Automation Market Size, By Country, 2017�2024 (USD Million)
Table 8 Market Size, By Service, 2017�2024 (USD Million)
Table 9 Services: Market Size By Region, 2017�2024 (USD Million)
Table 10 North America: Services Market Size, By Country, 2017�2024 (USD Million)
Table 11 Europe: Services Market Size, By Country, 2017�2024 (USD Million)
Table 12 Asia Pacific: Services Market Size, By Country, 2017�2024 (USD Million)
Table 13 Consulting Market Size, By Region, 2017�2024 (USD Thousand)
Table 14 Integration and Implementation Market Size, By Region, 2017�2024 (USD Thousand)
Table 15 Training and Support Market Size, By Region, 2017�2024 (USD Thousand)
Table 16 Field Force Automation Market Size, By Organization Size, 2017�2024 (USD Million)
Table 17 Large Enterprises: Market Size By Region, 2017�2024 (USD Million)
Table 18 North America: Large Enterprises Market Size, By Country, 2017�2024 (USD Million)
Table 19 Europe: Large Enterprises Market Size, By Country, 2017�2024 (USD Million)
Table 20 Asia Pacific: Large Enterprises Market Size, By Country, 2017�2024 (USD Million)
Table 21 Small and Medium-Sized Enterprises: Market Size, By Region, 2017�2024 (USD Million)
Table 22 North America: Small and Medium-Sized Enterprises Market Size, By Country, 2017�2024 (USD Million)
Table 23 Europe: Small and Medium-Sized Enterprises Market Size, By Country, 2017�2024 (USD Million)
Table 24 Asia Pacific: Small and Medium-Sized Enterprises Market Size, By Country, 2017�2024 (USD Million)
Table 25 Field Force Automation Market Size, By Deployment Type, 2017�2024 (USD Million)
Table 26 On-Premises: Market Size By Region, 2017�2024 (USD Million)
Table 27 North America: On-Premises Market Size, By Country, 2017�2024 (USD Million)
Table 28 Europe: On-Premises Market Size, By Country, 2017�2024 (USD Million)
Table 29 Asia Pacific: On-Premises Market Size, By Country, 2017�2024 (USD Million)
Table 30 Cloud: Size, By Region, 2017�2024 (USD Million)
Table 31 North America: Cloud Market Size, By Country, 2017�2024 (USD Million)
Table 32 Europe: Cloud Market Size, By Country, 2017�2024 (USD Million)
Table 33 Asia Pacific: Cloud Market Size, By Country, 2017�2024 (USD Million)
Table 34 Field Force Automation Market, By Industry Vertical, 2017�2024 (USD Million)
Table 35 IT and Telecom: Market Size By Region, 2017�2024 (USD Million)
Table 36 Healthcare and Life Sciences: Market Size By Region, 2017�2024 (USD Million)
Table 37 Manufacturing: Market Size By Region, 2017�2024 (USD Million)
Table 38 Transportation and Logistics: Market Size By Region, 2017�2024 (USD Million)
Table 39 Construction and Real Estate: Market Size By Region, 2017�2024 (USD Million)
Table 40 Energy and Utilities: Market Size By Region, 2017�2024 (USD Million)
Table 41 Others: Market Size By Region, 2017�2024 (USD Thousand)
Table 42 Market Size, By Region, 2017�2024 (USD Million)
Table 43 North America: Field Force Automation Market Size, By Component, 2017�2024 (USD Million)
Table 44 North America: Market Size By Service, 2017�2024 (USD Million)
Table 45 North America: Market Size By Organization Size, 2017�2024 (USD Million)
Table 46 North America: Market Size By Deployment Type, 2017�2024 (USD Million)
Table 47 North America: Market Size By Industry Vertical, 2017�2024 (USD Million)
Table 48 North America: Market Size By Country, 2017�2024 (USD Million)
Table 49 United States: Field Force Automation Market Size, By Component, 2017�2024 (USD Million)
Table 50 United States: Market Size By Service, 2017�2024 (USD Million)
Table 51 United States: Market Size By Organization Size, 2017�2024 (USD Million)
Table 52 United States: Market Size By Deployment Type, 2017�2024 (USD Million)
Table 53 Canada: Field Force Automation Market Size, By Component, 2017�2024 (USD Million)
Table 54 Canada: Market Size By Service, 2017�2024 (USD Million)
Table 55 Canada: Market Size By Organization Size, 2017�2024 (USD Million)
Table 56 Canada: Market Size By Deployment Type, 2017�2024 (USD Million)
Table 57 Europe: Field Force Automation Market Size, By Component, 2017�2024 (USD Million)
Table 58 Europe: Market Size By Service, 2017�2024 (USD Million)
Table 59 Europe: Market Size By Organization Size, 2017�2024 (USD Million)
Table 60 Europe: Market Size By Deployment Type, 2017�2024 (USD Million)
Table 61 Europe: Market Size By Industry Vertical, 2017�2024 (USD Million)
Table 62 Europe: Market Size By Country, 2017�2024 (USD Million)
Table 63 United Kingdom: Field Force Automation Market Size, By Component, 2017�2024 (USD Million)
Table 64 United Kingdom: Market Size By Service, 2017�2024 (USD Million)
Table 65 United Kingdom: Market Size By Organization Size, 2017�2024 (USD Million)
Table 66 United Kingdom: Market Size By Deployment Type, 2017�2024 (USD Million)
Table 67 Germany: Field Force Automation Market Size, By Component, 2017�2024 (USD Million)
Table 68 Germany: Market Size By Service, 2017�2024 (USD Million)
Table 69 Germany: Market Size By Organization Size, 2017�2024 (USD Million)
Table 70 Germany: Market Size By Deployment Type, 2017�2024 (USD Million)
Table 71 Rest of Europe: Field Force Automation Market Size, By Component, 2017�2024 (USD Million)
Table 72 Rest of Europe: Market Size By Service, 2017�2024 (USD Million)
Table 73 Rest of Europe: Market Size By Organization Size, 2017�2024 (USD Million)
Table 74 Rest of Europe: Market Size By Deployment Type, 2017�2024 (USD Million)
Table 75 Asia Pacific: Field Force Automation Market Size, By Component, 2017�2024 (USD Million)
Table 76 Asia Pacific: Market Size By Service, 2017�2024 (USD Million)
Table 77 Asia Pacific: Market Size By Organization Size, 2017�2024 (USD Million)
Table 78 Asia Pacific: Market Size By Deployment Type, 2017�2024 (USD Million)
Table 79 Asia Pacific: Market Size By Industry Vertical, 2017�2024 (USD Million)
Table 80 Asia Pacific: Field Force Automation Size, By Country, 2017�2024 (USD Million)
Table 81 Australia and New Zealand: Field Force Automation Market Size, By Component, 2017�2024 (USD Million)
Table 82 Australia and New Zealand: Market Size By Service, 2017�2024 (USD Thousand)
Table 83 Australia and New Zealand: Market Size By Organization Size, 2017�2024 (USD Million)
Table 84 Australia and New Zealand: Market Size By Deployment Type, 2017�2024 (USD Million)
Table 85 China: Field Force Automation Market Size, By Component, 2017�2024 (USD Million)
Table 86 China: Market Size By Service, 2017�2024 (USD Thousand)
Table 87 China: Market Size By Organization Size, 2017�2024 (USD Million)
Table 88 China: Market Size By Deployment Type, 2017�2024 (USD Million)
Table 89 Rest of Asia Pacific: Field Force Automation Market Size, By Component, 2017�2024 (USD Million)
Table 90 Rest of Asia Pacific: Market Size By Service, 2017�2024 (USD Million)
Table 91 Rest of Asia Pacific: Market Size By Organization Size, 2017�2024 (USD Million)
Table 92 Rest of Asia Pacific: Market Size By Deployment Type, 2017�2024 (USD Million)
Table 93 Middle East and Africa: Field Force Automation Market Size, By Component, 2017�2024 (USD Million)
Table 94 Middle East and Africa: Market Size By Service, 2017�2024 (USD Thousand)
Table 95 Middle East and Africa: Market Size By Organization Size, 2017�2024 (USD Million)
Table 96 Middle East and Africa: Market Size By Deployment Type, 2017�2024 (USD Million)
Table 97 Middle East and Africa: Market Size By Industry Vertical, 2017�2024 (USD Thousand)
Table 98 Middle East and Africa: Market Size By Country, 2017�2024 (USD Million)
Table 99 Latin America: Field Force Automation Market Size, By Component, 2017�2024 (USD Million)
Table 100 Latin America: Market Size By Service, 2017�2024 (USD Thousand)
Table 101 Latin America: Market Size By Organization Size, 2017�2024 (USD Million)
Table 102 Latin America: Market Size By Deployment Type, 2017�2024 (USD Million)
Table 103 Latin America: Market Size By Industry Vertical, 2017�2024 (USD Thousand)
Table 104 Latin America: Market Size By Country, 2017�2024 (USD Million)
Table 105 New Product/Solution Launches and Product Enhancements, 2019
Table 106 Acquisitions, 2017�2019
Table 107 Partnerships and Agreements, 2017�2019
Table 108 Evaluation Criteria
List of Figures (32 Figures)
Figure 1 Field Force Automation Market: Research Design
Figure 2 Market Top-Down and Bottom-Up Approaches
Figure 3 Market Overview
Figure 4 Highest Growing Segments of the Market
Figure 5 Market: Regional Snapshot, 2019
Figure 6 Increased Need Among Enterprises to Improve the Productivity of Mobile Field Force and Save Costs on Field Processes Driving the Adoption of Field Force Automation Solution in the Global Market
Figure 7 Energy and Utilities Industry Vertical and the United States Expected to Account for the Highest Market Shares in the North American Market in 2019
Figure 8 Field Force Automation Market in Australia and New Zealand to Grow at the Highest Rate During the Forecast Period
Figure 9 Drivers, Restraints, Opportunities, and Challenges
Figure 10 Services Segment Projected to Grow at a Higher CAGR During the Forecast Period as Compared to the Solution Segment
Figure 11 Integration and Implementation Segment to Grow at the Highest CAGR During the Forecast Period
Figure 12 Small and Medium-Sized Enterprises Segment to Grow at a Higher CAGR During the Forecast Period as Compared to Large Enterprises Segment
Figure 13 Cloud Segment to Grow at a Higher CAGR During the Forecast Period as Compared to On-Premises Segment
Figure 14 Transportation and Logistics Industry Vertical Expected to Grow at the Highest CAGR During the Forecast Period
Figure 15 Asia Pacific Field Force Automation Market to Witness Significant Growth During the Forecast Period
Figure 16 North America: Market Snapshot
Figure 17 Asia Pacific: Market Snapshot
Figure 18 Key Developments By the Leading Players in the Market, 2017�2019
Figure 19 Field Force Automation Market (Global) Competitive Leadership Mapping, 2019
Figure 20 ServiceMax: SWOT Analysis
Figure 21 ClickSoftware: SWOT Analysis
Figure 22 Oracle: Company Snapshot
Figure 23 Oracle: SWOT Analysis
Figure 24 Microsoft: Company Snapshot
Figure 25 Microsoft: SWOT Analysis
Figure 26 IFS: Company Snapshot
Figure 27 IFS: SWOT Analysis
Figure 28 Salesforce: Company Snapshot
Figure 29 Trimble: Company Snapshot
Figure 30 SAP: Company Snapshot
Figure 31 Astea: Company Snapshot
Figure 32 BT: Company Snapshot
The study involved four major activities in estimating the current market size for field force automation solution and services. Exhaustive secondary research was done to collect information on the market, peer market, and parent market. The next step was to validate these findings, assumptions, and sizing with the industry experts across the value chain through primary research. Both top-down and bottom-up approaches were employed to estimate the total market size. After that, market breakup and data triangulation were used to estimate the market size of segments and subsegments.
Secondary Research
In the secondary research process, various secondary sources, such as Bloomberg and BusinessWeek, have been referred for, to identify and collect information for this study. The secondary sources included annual reports, press releases, and investor presentations of companies; white papers; journals; and certified publications and articles from recognized authors, directories, and databases.
Primary Research
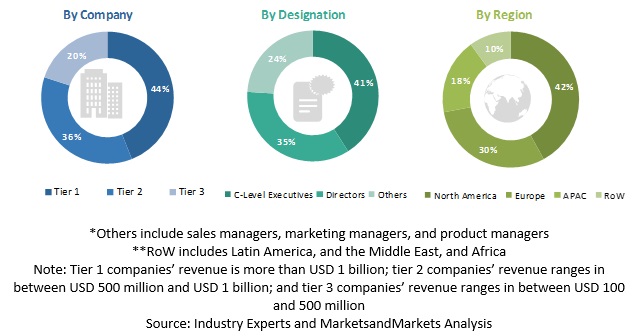
Various primary sources from both supply and demand sides were interviewed to obtain qualitative and quantitative information for this report. The primary sources from the supply side included industry experts, such as Chief Executive Officers (CEOs), Chief Marketing Officers (CMO), Chief Operating Officers (COOs), Vice Presidents (VPs), Managing Directors (MDs), technology and innovation directors, and related key executives from various key companies and organizations operating in the field force automation market along with the associated service providers, and system integrators working in the targeted regions. All possible parameters that affect the market covered in this res18earch study have been accounted for, viewed in extensive detail, verified through primary research, and analyzed to get the final quantitative and qualitative data. Following is the breakup of primary respondents,
To know about the assumptions considered for the study, download the pdf brochure
Market Size Estimation
For making market estimates and forecasting the field force automation market, and the other dependent submarkets, top-down, and bottom-up approaches were used. The bottom-up procedure was used to arrive at the overall market size of the global market using key companies� revenue and their offerings in the market. The research methodology used to estimate the market size includes the following:
- The key players in the market have been identified through extensive secondary research.
- The market size, in terms of value, has been determined through primary and secondary research processes.
- All percentage shares split, and breakdowns have been determined using secondary sources and verified through primary sources.
Data Triangulation
With data triangulation and validation through primary interviews, the exact value of the overall parent market size was determined and confirmed using this study. The global market size was then used in the top-down procedure to estimate the size of other individual markets via percentage splits of the market segmentation.
Report Objectives
- To define, describe, and forecast the field force automation market by component (solution and services), deployment type, organization size, industry, and region
- To provide detailed information about the major factors (drivers, restraints, opportunities, and industry-specific challenges) influencing the growth of the market
- To analyze the market concerning individual growth trends, prospects, and contributions to the field force automation market
- To forecast the market size of 5 main regions, namely, North America, Europe, Asia Pacific (APAC), Middle East and Africa (MEA), and Latin America
- To analyze the opportunities in the market for stakeholders by identifying the high-growth segments of the market
- To profile the key players in the market and comprehensively analyze their core competencies in each subsegment
- To analyze the competitive developments, such as new product launches and product enhancements, partnerships, collaborations, and agreements, mergers, and acquisitions
Available Customizations
With the given market data, MarketsandMarkets offers customizations as per the company�s specific needs. The following customization options are available for the report:
Company Information
- Detailed analysis and profiling of additional market players up to 5


Growth opportunities and latent adjacency in Field Force Automation Market