FinTech Blockchain Market by Provider, Application (Payments, Clearing, and Settlement, Exchanges and Remittance, Smart Contract, Identity Management, and Compliance Management/KYC), Organization Size, Vertical, and Region - Global Forecast to 2023


[144 Pages Report] The FinTech blockchain market size is expected to grow from USD 230.0 Million in 2017 to USD 6,228.2 Million by 2023, at a Compound Annual Growth Rate (CAGR) of 75.9% during the forecast period. The base year considered for this report is 2017, and the market forecast period is 2018�2023. The major growth drivers of the market include higher compatibility with the financial services industry ecosystem, the rising crypto-currencies market cap and Initial Currency Offering (ICO), reduced cost of transactions, and reduced total cost of ownership.
Objectives of the Study
The major objective of the report is to define, describe, and forecast the global FinTech blockchain market by provider, application, organization size, vertical, and region. The report provides detailed information related to the key factors (drivers, restraints, opportunities, and challenges) influencing the growth of the market. The report aims to strategically analyze micromarkets with respect to the individual growth trends, prospects, and contributions to the total market. The report attempts to forecast the market size with respect to 5 major regions, namely, North America, Europe, Asia Pacific (APAC), Middle East and Africa (MEA), and Latin America. The report strategically profiles the key players and comprehensively analyzes their core competencies. It also tracks and analyzes competitive developments, such as partnerships, collaborations, and agreements; mergers and acquisitions; new product launches and developments; and Research and Development (R&D) activities in the FinTech blockchain market.
Research Methodology
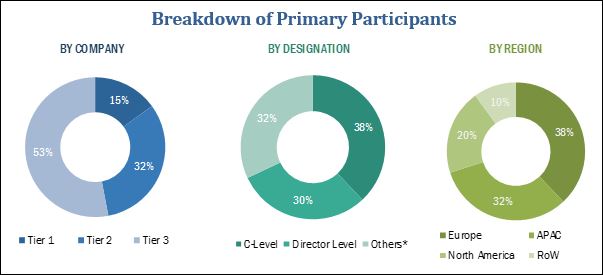
The research methodology used to estimate and forecast the FinTech blockchain market begins with capturing the data on the key vendor revenues through secondary research, which includes directories and databases, such as D&B Hoovers, Bloomberg Businessweek, and Factiva. Vendor offerings have also been taken into consideration to determine the market segmentation. The bottom-up procedure was employed to arrive at the overall size of the global market that was derived from the revenue of the key players in the market. After arriving at the overall market size, the total market was split into several segments and subsegments, which were then verified through primary research by conducting extensive interviews with key people, such as Chief Executive Officers (CEOs), Vice Presidents (VPs), directors, and executives. The data triangulation and market breakdown procedures were employed to complete the overall market engineering process and arrive at the exact statistics for all segments and subsegments. The breakdown of profiles of primary participants is depicted in the figure below:
To know about the assumptions considered for the study, download the pdf brochure
The FinTech blockchain market comprises vendors, such as AWS (US), IBM (US), Microsoft (US), Ripple (US), Chain (US), Earthport (UK), Bitfury (US), BTL Group (Canada), Oracle (US), Digital Asset Holdings (US), Circle (Ireland), Factom (US), AlphaPoint (US), Coinbase (US), Abra (US), Auxesis Group (India), BitPay (US), BlockCypher (US), Applied Blockchain (UK), RecordesKeeper (Spain), Symbiont (US), Guardtime (Estonia), Cambridge Blockchain (US), Tradle (US), and Blockchain Advisory Mauritius Foundation (Mauritius). The other stakeholders in the market include crypto-currency vendors, research organizations, network and system integrators, blockchain services providers, and distributed ledger technology solutions providers.
Key Target Audience for FinTech Blockchain Market
- Application developers
- Services providers and distributors
- Blockchain application builders
- Independent Software Vendors (ISVs)
- Enterprises
- End-users
�The study answers several questions for the stakeholders, primarily which market segments to focus on in the next 2�5 years for prioritizing efforts and investments.�
Scope of the FinTech Blockchain Market Report
|
Report Metrics |
Details |
|
Market size available for years |
2017�2023 |
|
Base year considered |
2017 |
|
Forecast period |
2018�2023 |
|
Forecast units |
Million (USD) |
|
Segments covered |
Provider, Application, Organization Size, Vertical and Region |
|
Geographies covered |
North America, Europe, MEA, APAC and Latin America |
|
Companies covered |
AWS (US), IBM (US), Microsoft (US), Ripple (US), Chain (US), Earthport (UK), Bitfury (US), BTL Group (Canada), Oracle (US), Digital Asset Holdings (US), Circle (Ireland), Factom (US), AlphaPoint (US), Coinbase (US), Abra (US), Auxesis Group (India), BitPay (US), BlockCypher (US), Applied Blockchain (UK), RecordesKeeper (Spain), Symbiont (US), Guardtime (Estonia), Cambridge Blockchain (US), Tradle (US), and Blockchain Advisory Mauritius Foundation (Mauritius). |
The research report categorizes the market to forecast revenues and analyze trends in each of the following subsegments:
FinTech Blockchain Market By Application
- Payments, clearing, and settlement
- Exchanges and remittance
- Smart contracts
- Identity management
- Compliance management/Know Your Customer (KYC)
- Others (cyber liability and content storage management)
By Provider
- Application and solution providers
- Middleware providers
- Infrastructure and protocols providers
By Organization Size
- Small and Medium-Sized Enterprises (SMEs)
- Large enterprises
FinTech Blockchain Market By Industry Vertical
- Banking
- Non-banking financial services
- Insurance
By Region
- North America
- Europe
- APAC
- MEA
- Latin America
Available Customizations
With the given market data, MarketsandMarkets offers customizations as per the company�s specific needs. The following customization options are available for the report:
Product Analysis
- Product matrix gives a detailed comparison of the product portfolio of each company
Company Information
- Detailed analysis and profiling of additional market players up to 5.
The FinTech blockchain market is expected to grow from USD 370.3 Million in 2018 to USD 6,228.2 Million by 2023, at a Compound Annual Growth Rate (CAGR) of 75.9% during the forecast period. The major drivers of the market include the higher compatibility with financial industry ecosystem, the rising crypto-currency market cap and Initial Coin Offering (ICO), faster transaction, and reduced total cost of ownership. The future growth opportunities for market include the rising adoption of blockchain applications, such as payments, clearing, and settlements, smart contracts, and identity management, and a new breed of programmable blockchain platform.
The FinTech blockchain market study aims at estimating the market size and future growth potential of the market across different segments, such as providers, applications, and regions. The application segment includes payments, clearing, and settlement, exchanges and remittances, smart contracts, identity management, compliance management/Know Your Customer (KYC), and others (cyber liability and content storage management). The payments, clearing, and settlement segment is expected to dominate the application segment in terms of contribution to the overall market, as financial companies are deploying blockchain-based smart contracts to bring reduction in costs of verification, execution, arbitration, and fraud prevention.
The FinTech blockchain market has been segmented on the basis of providers into 3 categories: application and solution providers, middleware providers, and infrastructure and protocols providers. These providers offer infrastructure to develop in the blockchain-based platforms. Among these types, the application and solution providers segment is the fastest-growing segment in the overall market. The introduction of technologically advanced blockchain solutions has witnessed a certain level of adoption in financial companies, thereby fueling the overall market growth.
FinTech blockchain applications are witnessing an increasing demand across the financial industry. Applications such as payments, smart contracts, and compliance management/KYC are assisting banks, investment banks, and insurance companies to enhance their efficiency and reduce infrastructure cost. The non-banking financial services, such as asset management and wealth management, are expected to dominate the market during the forecast period, due to the growing importance of FinTech blockchain applications. This, in turn, is expected to enhance the customer satisfaction, prevent fraudulent transactions, provide faster transactions, and reduce total cost of ownership.
The large enterprises segment is expected to dominate the market in terms of market size, as large enterprises are focusing on implementing blockchain applications to improve the customer loyalty and have an overall reduced infrastructure cost. However, the Small and Medium-sized Enterprises (SMEs) segment is expected to grow at a higher CAGR, owing to the easy availability and scalability of cloud-based deployments.
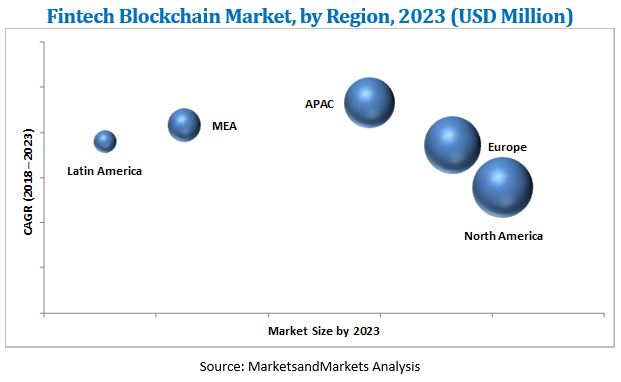
In terms of geographic coverage, the FinTech blockchain market has been segmented into 5 regions, namely, North America, Asia Pacific (APAC), Europe, the Middle East and Africa (MEA), and Latin America. North America is expected to account for the largest share of the overall market in 2018. North America is considered the most advanced region with regard to technology adoption and infrastructure. The wide presence of the key industry players of the blockchain technology solutions in this region is the major driving factor responsible for the growth of the FinTech blockchain market. Financial companies in this region are moving toward the adoption of the blockchain technology. Furthermore, APAC is expected to account for the highest growth rate during the forecast period, due to the increase in the overall investments in the blockchain technology solutions to change the business processes in the finance industry. The key financial hubs, including Hong Kong and Singapore, provide huge opportunities for the adoption of blockchain applications in the financial industry. However, lack of awareness and technical understanding about the blockchain technology can act as a restraining factor in the market across various regions.
The major FinTech blockchain technology market vendors include AWS (US), IBM (US), Microsoft (US), Ripple (US), Chain (US), Earthport (UK), Bitfury (US), BTL Group (Canada), Oracle (US), Digital Asset Holdings (US), Circle (Ireland), Factom (US), AlphaPoint (US), Coinbase (US), Abra (US), Auxesis Group (India), BitPay (US), BlockCypher (US), Applied Blockchain (UK), RecordesKeeper (Spain), Symbiont (US), Guardtime (Estonia), Cambridge Blockchain (US), Tradle (US), and Blockchain Advisory Mauritius Foundation (Mauritius).). These players have majorly adopted partnerships, agreements, and collaborations; and new product launches as their key growth strategies to offer feature-rich blockchain technology solutions to customers and further penetrate into untapped regions.
To speak to our analyst for a discussion on the above findings, click Speak to Analyst
TABLE OF CONTENTS
1 INTRODUCTION (Page No. - 19)
1.1 OBJECTIVES OF THE STUDY
1.2 MARKET DEFINITION
1.3 MARKET SCOPE
1.3.1 MARKETS COVERED
FIGURE 1 FINTECH BLOCKCHAIN MARKET: MARKET SEGMENTATION
FIGURE 2 REGIONAL SCOPE
1.4 YEARS CONSIDERED FOR THE STUDY
1.5 CURRENCY
1.6 STAKEHOLDERS
2 RESEARCH METHODOLOGY (Page No. - 22)
2.1 RESEARCH DATA
FIGURE 3 FINTECH BLOCKCHAIN MARKET: RESEARCH DESIGN
2.1.1 SECONDARY DATA
2.1.2 PRIMARY DATA
2.1.2.1 Breakdown of primary interviews
FIGURE 4 BREAKDOWN OF PRIMARY INTERVIEWS: BY COMPANY TYPE, DESIGNATION, AND REGION
2.1.2.2 Key industry insights
FIGURE 5 DATA TRIANGULATION
2.2 MARKET SIZE ESTIMATION
2.2.1 BOTTOM-UP APPROACH
FIGURE 6 MARKET SIZE ESTIMATION METHODOLOGY: BOTTOM-UP APPROACH
2.2.2 TOP-DOWN APPROACH
FIGURE 7 MARKET SIZE ESTIMATION METHODOLOGY: TOP-DOWN APPROACH
2.3 RESEARCH ASSUMPTIONS
FIGURE 8 FINTECH BLOCKCHAIN MARKET: ASSUMPTION
2.4 LIMITATIONS
3 EXECUTIVE SUMMARY (Page No. - 28)
TABLE 1 FINTECH BLOCKCHAIN MARKET SIZE AND GROWTH RATE, 2016�2023 (USD MILLION, Y-O-Y %)
FIGURE 9 PAYMENTS, CLEARING, AND SETTLEMENT APPLICATION, AND NORTH AMERICAN REGION ARE ESTIMATED TO HAVE THE LARGEST MARKET SHARES IN 2018
FIGURE 10 MARKET SHARE, BY PROVIDER, 2018
FIGURE 11 NORTH AMERICA IS ESTIMATED TO HOLD THE LARGEST MARKET SHARE IN 2018
4 PREMIUM INSIGHTS (Page No. - 33)
4.1 ATTRACTIVE MARKET OPPORTUNITIES IN THE FINTECH BLOCKCHAIN MARKET
FIGURE 12 HIGH ADOPTION OF THE BLOCKCHAIN TECHNOLOGY IN VARIOUS APPLICATION AREAS IS EXPECTED TO PROVIDE SIGNIFICANT GROWTH OPPORTUNITIES IN THE MARKET DURING THE FORECAST PERIOD
4.2 MARKET, BY PROVIDER
FIGURE 13 APPLICATION AND SOLUTION PROVIDERS SEGMENT IS EXPECTED TO GROW AT THE HIGHEST CAGR DURING THE FORECAST PERIOD
4.3 MARKET, BY APPLICATION
FIGURE 14 COMPLIANCE MANAGEMENT/KYC SEGMENT IS EXPECTED TO GROW AT THE HIGHEST CAGR DURING THE FORECAST PERIOD
4.4 FINTECH BLOCKCHAIN MARKET, BY ORGANIZATION SIZE
FIGURE 15 LARGE ENTERPRISES SEGMENT IS EXPECTED TO HAVE THE LARGER MARKET SHARE DURING THE FORECAST PERIOD
4.5 MARKET, BY REGION
FIGURE 16 ASIA PACIFIC IS EXPECTED TO GROW AT THE HIGHEST CAGR DURING THE FORECAST PERIOD
5 MARKET OVERVIEW AND INDUSTRY TRENDS (Page No. - 36)
5.1 INTRODUCTION
5.2 MARKET DYNAMICS
FIGURE 17 FINTECH BLOCKCHAIN MARKET: DRIVERS, RESTRAINTS, OPPORTUNITIES, AND CHALLENGES
5.2.1 DRIVERS
5.2.1.1 High compatibility with financial services industry ecosystem
5.2.1.2 Rising cryptocurrency market cap and ICO
5.2.1.3 Faster transactions
5.2.1.4 Reduced TCO
5.2.2 RESTRAINTS
5.2.2.1 Uncertain regulatory standards and frameworks
5.2.2.2 Lack of blockchain applications and use cases
5.2.3 OPPORTUNITIES
5.2.3.1 High adoption of blockchain technology for payments, smart contracts, and digital identities
5.2.3.2 New breed of programmable blockchain platforms
5.2.4 CHALLENGES
5.2.4.1 Security, privacy, and control issues
5.2.4.2 Scalability and latency challenges
5.3 INDUSTRY TRENDS
5.3.1 TYPES OF BLOCKCHAIN TECHNOLOGY
5.3.1.1 Public blockchain
5.3.1.2 Private blockchain
5.3.2 BLOCKCHAIN ASSOCIATIONS, REGULATORY AND POLICY MAKERS, AND CONSORTIUMS
5.3.2.1 CLS Group
5.3.2.2 R3CEV Blockchain Consortium
5.3.2.3 Hyperledger
5.3.2.4 Global Payments Steering Group (GPSG)
5.3.2.5 Financial Blockchain Shenzhen Consortium (FBSC)
5.3.2.6 CU Ledger
5.3.2.7 Blockchain Collaborative Consortium (BCCC)
5.3.2.8 Wall Street Blockchain Alliance (WSBA)
5.3.2.9 International Monetary Fund (IMF)
5.3.2.10 New York Department of Financial Services (NYDFS)
5.3.2.11 Financial Conduct Authority (FCA)
5.3.3 BLOCKCHAIN IN BANKING, FINANCIAL SERVICES, AND INSURANCE
5.3.3.1 Examples of FinTech blockchain across financial sectors
5.4 MARKET EVOLUTION
FIGURE 18 EVOLUTION OF THE FINTECH BLOCKCHAIN MARKET
6 FINTECH BLOCKCHAIN MARKET, BY PROVIDER (Page No. - 47)
6.1 INTRODUCTION
FIGURE 19 APPLICATION AND SOLUTION PROVIDERS SEGMENT IS EXPECTED TO GROW AT THE HIGHEST CAGR DURING THE FORECAST PERIOD
TABLE 2 MARKET SIZE, BY PROVIDER, 2016�2023 (USD MILLION)
6.2 APPLICATION AND SOLUTION PROVIDERS
TABLE 3 APPLICATION AND SOLUTION PROVIDERS: MARKET SIZE, BY REGION, 2016�2023 (USD MILLION)
6.3 MIDDLEWARE PROVIDERS
TABLE 4 MIDDLEWARE PROVIDERS: MARKET SIZE, BY REGION, 2016�2023 (USD MILLION)
6.4 INFRASTRUCTURE AND PROTOCOL PROVIDERS
TABLE 5 INFRASTRUCTURE AND PROTOCOL PROVIDERS: MARKET SIZE, BY REGION, 2016�2023 (USD MILLION)
7 FINTECH BLOCKCHAIN MARKET, BY APPLICATION (Page No. - 52)
7.1 INTRODUCTION
FIGURE 20 COMPLIANCE MANAGEMENT/KYC APPLICATION IS EXPECTED TO GROW AT THE HIGHEST CAGR DURING THE FORECAST PERIOD
TABLE 6 MARKET SIZE, BY APPLICATION, 2016�2023 (USD MILLION)
7.2 PAYMENTS, CLEARING, AND SETTLEMENT
TABLE 7 PAYMENTS, CLEARING, AND SETTLEMENT: MARKET SIZE, BY REGION, 2016�2023 (USD MILLION)
7.3 EXCHANGES AND REMITTANCE
TABLE 8 EXCHANGES AND REMITTANCE: MARKET SIZE, BY REGION, 2016�2023 (USD MILLION)
7.4 SMART CONTRACT
TABLE 9 SMART CONTRACT: MARKET SIZE, BY REGION, 2016�2023 (USD MILLION)
7.5 IDENTITY MANAGEMENT
TABLE 10 IDENTITY MANAGEMENT: MARKET SIZE, BY REGION, 2016�2023 (USD MILLION)
7.6 COMPLIANCE MANAGEMENT/ KYC
TABLE 11 COMPLIANCE MANAGEMENT/KYC: MARKET SIZE, BY REGION, 2016�2023 (USD MILLION)
7.7 OTHERS
TABLE 12 OTHERS: MARKET SIZE, BY REGION, 2016�2023 (USD MILLION)
8 FINTECH BLOCKCHAIN MARKET, BY ORGANIZATION SIZE (Page No. - 60)
8.1 INTRODUCTION
FIGURE 21 SMALL AND MEDIUM-SIZED ENTERPRISES SEGMENT IS EXPECTED TO GROW AT THE HIGHER CAGR DURING THE FORECAST PERIOD
TABLE 13 MARKET SIZE, BY ORGANIZATION SIZE, 2016�2023 (USD MILLION)
8.2 LARGE ENTERPRISES
TABLE 14 LARGE ENTERPRISES: MARKET SIZE, BY REGION, 2016�2023 (USD MILLION)
8.3 SMALL AND MEDIUM-SIZED ENTERPRISES
TABLE 15 SMALL MEDIUM-SIZED ENTERPRISES: MARKET SIZE, BY REGION, 2016�2023 (USD MILLION)
9 FINTECH BLOCKCHAIN MARKET, BY VERTICAL (Page No. - 64)
9.1 INTRODUCTION
FIGURE 22 INSURANCE VERTICAL IS EXPECTED TO GROW AT THE HIGHEST CAGR DURING THE FORECAST PERIOD
TABLE 16 MARKET SIZE, BY VERTICAL, 2016�2023 (USD MILLION)
9.2 BANKING
TABLE 17 BANKING: MARKET SIZE, BY REGION, 2016�2023 (USD MILLION)
9.3 NON-BANKING FINANCIAL SERVICES
TABLE 18 NON-BANKING FINANCIAL SERVICES: MARKET SIZE, BY REGION, 2016�2023 (USD MILLION)
9.4 INSURANCE
TABLE 19 INSURANCE: MARKET SIZE, BY REGION, 2016�2023 (USD MILLION)
10 FINTECH BLOCKCHAIN MARKET, BY REGION (Page No. - 69)
10.1 INTRODUCTION
FIGURE 23 NORTH AMERICA IS EXPECTED TO CONTRIBUTE THE LARGEST REVENUE DURING THE FORECAST PERIOD
TABLE 20 MARKET SIZE, BY REGION, 2016�2023 (USD MILLION)
FIGURE 24 ASIA PACIFIC IS EXPECTED TO GROW AT THE HIGHEST CAGR DURING THE FORECAST PERIOD
10.2 NORTH AMERICA
FIGURE 25 NORTH AMERICA: MARKET SNAPSHOT
10.2.1 BY PROVIDER
TABLE 21 NORTH AMERICA: FINTECH BLOCKCHAIN MARKET SIZE, BY PROVIDER, 2016�2023 (USD MILLION)
10.2.2 BY APPLICATION
TABLE 22 NORTH AMERICA: MARKET SIZE, BY APPLICATION, 2016�2023 (USD MILLION)
10.2.3 BY ORGANIZATION SIZE
TABLE 23 NORTH AMERICA: MARKET SIZE, BY ORGANIZATION SIZE, 2016�2023 (USD MILLION)
10.2.4 BY VERTICAL
TABLE 24 NORTH AMERICA: MARKET SIZE, BY VERTICAL, 2016�2023 (USD MILLION)
10.2.5 BY COUNTRY
TABLE 25 NORTH AMERICA: MARKET SIZE, BY COUNTRY, 2016�2023 (USD MILLION)
10.2.5.1 United States
10.2.5.2 Canada
10.3 EUROPE
10.3.1 BY PROVIDER
TABLE 26 EUROPE: FINTECH BLOCKCHAIN MARKET SIZE, BY PROVIDER, 2016�2023 (USD MILLION)
10.3.2 BY APPLICATION
TABLE 27 EUROPE: MARKET SIZE, BY APPLICATION, 2016�2023 (USD MILLION)
10.3.3 BY ORGANIZATION SIZE
TABLE 28 EUROPE: MARKET SIZE, BY ORGANIZATION SIZE, 2016�2023 (USD MILLION)
10.3.4 BY VERTICAL
TABLE 29 EUROPE: MARKET SIZE, BY VERTICAL, 2016�2023 (USD MILLION)
10.3.5 BY COUNTRY
TABLE 30 EUROPE: MARKET SIZE, BY COUNTRY, 2016�2023 (USD MILLION)
10.3.5.1 United Kingdom
10.3.5.2 Germany
10.3.5.3 Rest of Europe
10.4 APAC
FIGURE 26 APAC: MARKET SNAPSHOT
10.4.1 BY PROVIDER
TABLE 31 ASIA PACIFIC: FINTECH BLOCKCHAIN MARKET SIZE, BY PROVIDER, 2016�2023 (USD MILLION)
10.4.2 BY APPLICATION
TABLE 32 APAC: MARKET SIZE, BY APPLICATION, 2016�2023 (USD MILLION)
10.4.3 BY ORGANIZATION SIZE
TABLE 33 APAC: MARKET SIZE, BY ORGANIZATION SIZE, 2016�2023 (USD MILLION)
10.4.4 BY VERTICAL
TABLE 34 APAC: MARKET SIZE, BY VERTICAL, 2016�2023 (USD MILLION)
10.4.5 BY COUNTRY
TABLE 35 APAC: MARKET SIZE, BY COUNTRY, 2016�2023 (USD MILLION)
10.4.5.1 China
10.4.5.2 India
10.4.5.3 Australia and New Zealand
10.4.5.4 Rest of APAC
10.5 LATIN AMERICA
10.5.1 BY PROVIDER
TABLE 36 LATIN AMERICA: FINTECH BLOCKCHAIN MARKET SIZE, BY PROVIDER, 2016�2023 (USD MILLION)
10.5.2 BY APPLICATION
TABLE 37 LATIN AMERICA: MARKET SIZE, BY APPLICATION, 2016�2023 (USD MILLION)
10.5.3 BY ORGANIZATION SIZE
TABLE 38 LATIN AMERICA: MARKET SIZE, BY ORGANIZATION SIZE, 2016�2023 (USD MILLION)
10.5.4 BY VERTICAL
TABLE 39 LATIN AMERICA: MARKET SIZE, BY VERTICAL, 2016�2023 (USD MILLION)
10.5.5 BY COUNTRY
TABLE 40 LATIN AMERICA: MARKET SIZE, BY COUNTRY, 2016�2023 (USD MILLION)
10.5.5.1 Mexico
10.5.5.2 Brazil
10.5.5.3 Rest of Latin America
10.6 MIDDLE EAST AND AFRICA
10.6.1 BY PROVIDER
TABLE 41 MIDDLE EAST AND AFRICA: FINTECH BLOCKCHAIN MARKET SIZE, BY PROVIDER, 2016�2023 (USD MILLION)
10.6.2 BY APPLICATION
TABLE 42 MIDDLE EAST AND AFRICA: MARKET SIZE, BY APPLICATION, 2016�2023 (USD MILLION)
10.6.3 BY ORGANIZATION SIZE
TABLE 43 MIDDLE EAST AND AFRICA: MARKET SIZE, BY ORGANIZATION SIZE, 2016�2023 (USD MILLION)
10.6.4 BY VERTICAL
TABLE 44 MIDDLE EAST AND AFRICA: MARKET SIZE, BY VERTICAL, 2016�2023 (USD MILLION)
10.6.5 BY COUNTRY
TABLE 45 MIDDLE EAST AND AFRICA: MARKET SIZE, BY COUNTRY, 2016�2023 (USD MILLION)
10.6.5.1 Middle East
10.6.5.2 Africa
11 COMPETITIVE LANDSCAPE (Page No. - 87)
11.1 OVERVIEW
FIGURE 27 KEY DEVELOPMENTS BY THE LEADING PLAYERS IN THE FINTECH BLOCKCHAIN MARKET
11.2 PROMINENT PLAYERS IN THE GLOBAL MARKET
11.3 COMPETITIVE SITUATIONS AND TRENDS
FIGURE 28 MARKET EVALUATION FRAMEWORK
11.3.1 PARTNERSHIPS, AGREEMENTS, AND COLLABORATIONS
TABLE 46 PARTNERSHIPS, AGREEMENTS, AND COLLABORATIONS, 2017�2018
11.3.2 NEW PRODUCT LAUNCHES/PRODUCT UPGRADATIONS
TABLE 47 NEW PRODUCT LAUNCHES AND PRODUCT UPGRADATIONS, 2016�2018
11.3.3 EXPANSIONS
TABLE 48 BUSINESS EXPANSIONS, 2015�2016
11.3.4 VENTURE FUNDING
TABLE 49 VENTURE FUNDING, 2015�2018
12 COMPANY PROFILES (Page No. - 92)
(Business Overview, Solutions Offered, Recent Developments, SWOT Analysis, and MNM View)*
12.1 AWS
FIGURE 29 AWS: COMPANY SNAPSHOT
12.2 IBM
FIGURE 30 IBM: COMPANY SNAPSHOT
12.3 MICROSOFT
FIGURE 31 MICROSOFT: COMPANY SNAPSHOT
12.4 RIPPLE
12.5 CHAIN
12.6 EARTHPORT
FIGURE 32 EARTHPORT: COMPANY SNAPSHOT
12.7 BITFURY
12.8 BTL GROUP
FIGURE 33 BTL GROUP: COMPANY SNAPSHOT
12.9 ORACLE
FIGURE 34 ORACLE: COMPANY SNAPSHOT
12.10 DIGITAL ASSET HOLDINGS
12.11 CIRCLE
12.12 FACTOM
12.13 ALPHAPOINT
12.14 COINBASE
12.15 ABRA
12.16 AUXESIS GROUP
12.17 BITPAY
12.18 BLOCKCYPHER
12.19 APPLIED BLOCKCHAIN
12.20 RECORDSKEEPER
12.21 SYMBOINT
12.22 GUARDTIME
12.23 CAMBRIDGE BLOCKCHAIN
12.24 TRADLE
12.25 BLOCKCHAIN ADVISORY MAURITIUS FOUNDATION
*Details on Business Overview, Solutions Offered, Recent Developments, SWOT Analysis, and MNM View might not be captured in case of unlisted companies.
13 APPENDIX (Page No. - 136)
13.1 INSIGHTS OF INDUSTRY EXPERTS
13.2 DISCUSSION GUIDE
13.3 KNOWLEDGE STORE: MARKETSANDMARKETS� SUBSCRIPTION PORTAL
13.4 INTRODUCING RT: REAL-TIME MARKET INTELLIGENCE
13.5 AVAILABLE CUSTOMIZATION
13.6 RELATED REPORTS
13.7 AUTHOR DETAILS


Growth opportunities and latent adjacency in FinTech Blockchain Market