Flow Computer Market

Flow Computer Market in Oil & Gas by Offering (Hardware, Software, Support Services), by Operation (Upstream, Midstream and Downstream), Application (Custody Transfer, Pipeline Flow Monitoring, Wellhead Monitoring) and Region - Global Forecast to 2028

Report Code: SE 3748 Mar, 2023, by marketsandmarkets.com

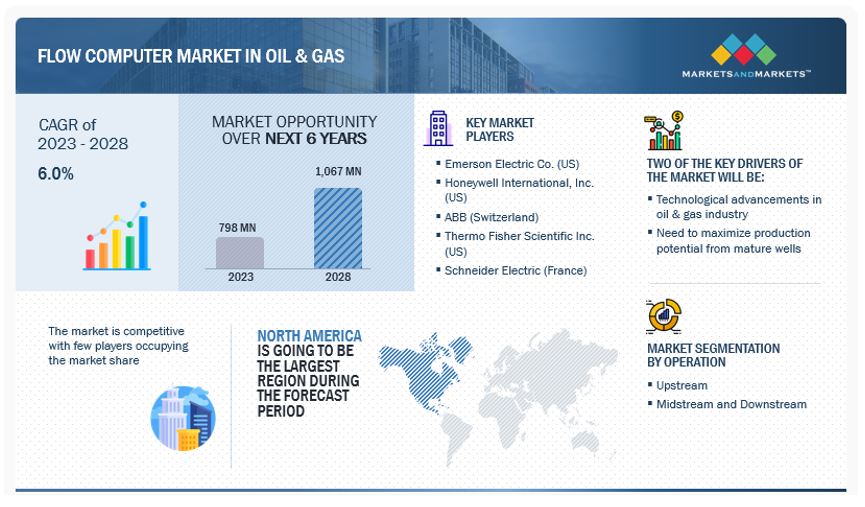
[183 Pages Report] The Flow Computer Market in oil & gas is projected to grow from USD 798 Million in 2023 to USD 1,067 Million in 2028; it is expected to grow at a CAGR of 6.0% from 2023 to 2028.

The market growth is driven by factors including the technological advancements in oil & gas industry and suitability in many functions of the oil & gas industry and increasing adoption of process automation providing opportunities for flow computer industry in oil & gas. However, interoperability of multiple components from different solution providers are challenging the market growth
Flow Computer Market

Flow Computer Market Forecast to 2028

To know about the assumptions considered for the study, Request for Free Sample Report

Flow Computer Market Dynamics

DRIVERS: Technological advancements in oil & gas industry

Digital transformation and automation are emerging trends in the oil & gas industry, which is experiencing rapid digitalization with smarter operations, thus giving rise to the digital economy. Digital transformation or automation enables deployment of a minimum workforce in remote onshore & offshore exploration sites. The demand for operational digital oilfield solutions is increasing due to limited oil or fuel supply to the growing number of vehicles in the market, which compels the oil industry to adopt new and improved technologies. The implementation of systems such as DCS, PLC, smart well, and SCADA in the upstream segment helps automate the control process and offers real-time data.

RESTRAINT: High cost of flow computer and regular maintenance

Flow computers are known for providing accurate and reliable flow measurements in the oil & gas industry. They require specialized components and manufacturing processes to achieve a high level of accuracy and reliable flow measurement. New-age components provide add-on features and functionality, such as the measurement of multiple fluid parameters simultaneously and diagnostic and calibration features, which give advantages over other flow measurement devices. These add-on features and functionality increase the cost of the device and maintenance costs. If the add-on features may not be justifiable for pipeline operators and cannot return on investments in terms of improved efficiency, accuracy, and reduced operating cost, then flow computer becomes a non-viable option for the operators. Hence, high product and maintenance costs become restraints for operators looking to minimize their cost of ownership.

OPPORTUNITIES: Growing demand for offshore/ultra-deep discoveries.

The oil & gas industry is going through a phase of technological advancements in exploration technology for deepwater exploration and production activities and the commercial viability of the projects. Current advances allow oil companies to improve recovery and accelerate production.

Offshore wells may have a different level of automation, ranging from simple one-way monitoring to complex subsurface controls with intelligent completions. Petrobras (Brazil) has created a corporate program dedicated to studying, developing, and implementing digital integrated field management (GeDIg) among its production assets. Petrobras selected the Carapeba field as a pilot project. It is a mature field composed of three wells located in the northeastern part of the Campos Basin, which has installed automated subsurface sensors in the wells.

CHALLENGES: Interoperability of multiple components from different solution providers.

Companies in the upstream segment often buy and assemble components from different vendors depending on customer requirements. This makes the market highly consumer-dominated, so no standard or generalized product can be developed by a single player. In that case, interoperability with other systems and components is a challenge for upstream operators. Adding any alternative system, hardware, or software that is not compatible with some of the digital oilfield systems, such as the flow computer, becomes a constraint as it has to integrate with the existing system for optimum results seamlessly. Developments for integrating various services with each other are expected to overcome this challenge faced by oilfield operators.

Flow Computer Market in Oil & Gas Ecosystem

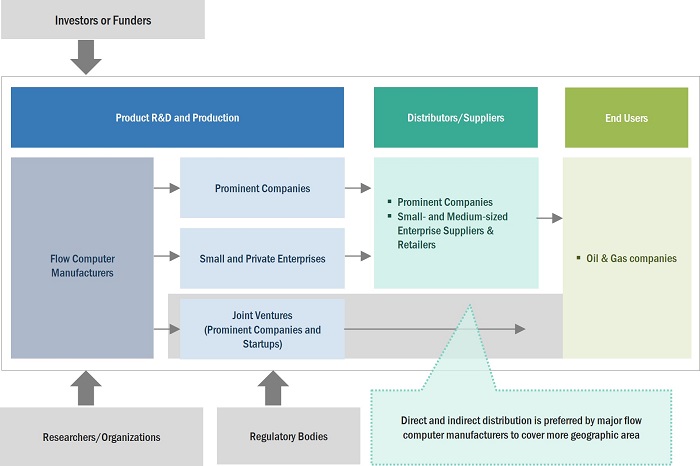
Prominent companies in this market include well-established, financially stable manufacturers and providers of flow computers. These companies have been operating in the market for several years and possess a diversified product portfolio, state-of-the-art technologies, and strong global sales and marketing networks. Prominent companies in this market include Emerson Electric Co. (US), Honeywell International, Inc. (US), ABB (Switzerland), Thermo Fisher Scientific Inc. (US), and Schneider Electric (France).
Flow Computer Market by Ecosystem

Midstream & Downstream segment is expected to register higher market share during the forecast period

The crude oil and natural gas are distributed through midstream pipelines and tankers. Since these pipelines carry important and pricey materials, they require continuous monitoring. The flow computers perform metering, meter proving, ticketing, valve control, batching, and product interfacing. In the midstream application, positive displacement, ultrasonic, Coriolis, and turbine flow meters are majorly used and connected to flow computers. These flow computers can also be utilized in leak detection and pipeline control. Similarly, in downstream, flow computers are used for the distribution of oil & gas from one source to multiple sources. They are also used for flow indication and control. Apart from billing, the flow computers are also used for flow measurement at ship, rail, and road loading. As a result, the market size of flow computers in midstream and downstream operations is larger than upstream operations.

Hardware segment is expected to register higher market share during the forecast period

In the hardware component, the market for flow computer devices is considered. The flow computers are used in upstream, midstream, and downstream oil and gas operations. These flow computer devices perform significant tasks of accurate flow calculations and therefore are employed at multiple operation points. Flow computer devices are of two major types: field-mounted devices and panel-mounted devices. Field-mounted devices are mounted or installed onsite, whereas the panel-mounted flow computers are installed at a workstation or centralized station from where the flow monitoring and controlling are done. The field-mounted flow computers are installed on the site, such as wellheads, production sites, pipeline mounted, and sometimes at remote places. Therefore, field-mounted flow computers are required to be sturdy and resistant to hazardous climate conditions.

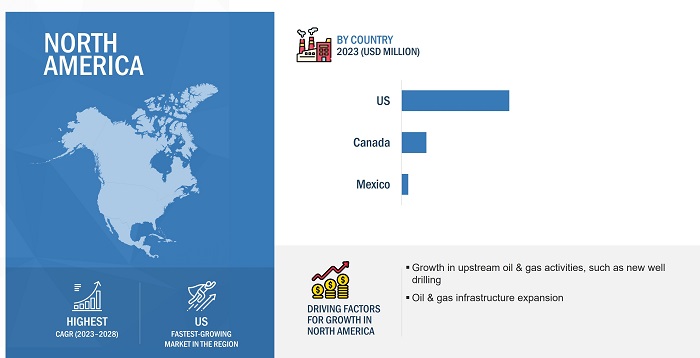
North America to grow at the highest CAGR during the forecast period

North America has the largest number of oil & gas rigs with top flow computer manufacturers and providers such as Emerson Electric Co. (US), Honeywell (US), Thermo Fisher Scientific (US), and OMNI Flow Computers (US). Furthermore, Oil & gas companies in US are investing a fair amount in automating their processes and converting components to digital. The integration of IIoT and SCADA systems is increasing the scope of flow computers for oil & gas. Similarly, Canada is the fifth-largest producer of natural gas and the sixth-largest producer of crude oil worldwide. Its expanding production enables the adoption of flow computers in oil and natural gas plants. The oil & gas reserves in the Mexican Gulf are expected to be high in resources; therefore, many companies worldwide are investing heavily in this region
Flow Computer Market by Region

Flow Computer Market by Region

To know about the assumptions considered for the study, download the pdf brochure

Key Market Players

The Flow Computer Companies is dominated by players such as Emerson Electric Co. (US), Honeywell International, Inc. (US), ABB (Switzerland), Thermo Fisher Scientific Inc. (US), Schneider Electric (France), Krohne Messtechnik GmbH (Germany), Yokogawa Electric Corporation (Japan), TechnipFMC plc (US), OMNI Flow Computers, Inc. (US), Dynamic Flow Computers, Inc. (US), Contrec Limited (UK), Kessler-Ellis Products (KEP) Co, Inc. (US), Sensia (US), Prosoft Technology, Inc.(US), Flowmetric, Inc.(US), Spirax Sarco Limited (UK), SICK AG (Germany), Badger Meter, Inc.(US), Quorum Business Solution, Inc.(US), Endress+Hauser AG (Switzerland), PLUM Sp. Zo. O (Poland), Fluidwell BV (Netherlands), Oval Corporation (Japan), Seneca srl (Italy), and Hoffer Flow Controls, Inc. (US).

Flow Computer Market Report Scope:

Report Metric

Details

Estimated Market Size in 2023

USD 798 Million

Projected Market Size in 2028

USD 1,067 Million

Growth Rate

CAGR of 6.0%

Market Size Available for Years

2019–2028

Base Year

2022

Forecast Period

2023–2028

Units

Value (USD Billion/Million)

Segments Covered

Component, Operation

Geographic Regions Covered

North America, Europe, Asia Pacific and RoW

Companies Covered

Major Players: Emerson Electric Co. (US), Honeywell International, Inc. (US), ABB (Switzerland), Thermo Fisher Scientific Inc. (US), Schneider Electric (France), Krohne Messtechnik GmbH (Germany), Yokogawa Electric Corporation (Japan), TechnipFMC plc (US), OMNI Flow Computers, Inc. (US), Dynamic Flow Computers, Inc. (US), Contrec Limited (UK), Kessler-Ellis Products (KEP) Co, Inc. (US), Sensia (US) and Others- total 25 players have been covered

Flow Computer Market Highlights

This research report categorizes the flow computer market in oil & gas by component, operation, and region.

Segment

Subsegment

By Component:

  • Hardware
  • Software
  • Support Services

By Operation:

  • Upstream
  • Midstream and Downstream

By Region:

  • North America
  • Europe
  • Asia Pacific (APAC)
  • Rest of the World (RoW)

Recent Developments

  • In January 2023, Emerson Electric Co. launched a new generation of single and dual meter run gas flow computers. They are field-mounted and explosion-proof flow computers, which offer a more practical option for remote oil & gas production sites.
  • In June 2022, ABB and Wison Offshore & Marine Limited (WOM), a technology and solution provider focusing on clean energy, collaborated to develop and implement floating liquefied natural gas (FLNG) facilities worldwide. This would enable the delivery of standardized electrification and safety system to improve production efficiency.
  • In September 2021, Thermo Fisher Scientific Inc. introduced the Thermo Scientific AutoFLEX EFM, the newest addition to the Auto SERIES flow computer portfolio, utilized to measure flow and process control in the oil and gas industry.

Frequently Asked Questions (FAQ):

To speak to our analyst for a discussion on the above findings, click Speak to Analyst

TABLE OF CONTENTS
 
1 INTRODUCTION (Page No. - 26)
    1.1 STUDY OBJECTIVES 
    1.2 MARKET DEFINITION 
           1.2.1 INCLUSIONS AND EXCLUSIONS
    1.3 STUDY SCOPE 
           1.3.1 MARKETS COVERED
                    FIGURE 1 SEGMENTATION OF FLOW COMPUTER MARKET IN OIL & GAS
           1.3.2 REGIONAL SCOPE
           1.3.3 YEARS CONSIDERED
    1.4 CURRENCY CONSIDERED 
    1.5 LIMITATIONS 
    1.6 STAKEHOLDERS 
    1.7 SUMMARY OF CHANGES 
 
2 RESEARCH METHODOLOGY (Page No. - 31)
    2.1 RESEARCH DATA 
           FIGURE 2 FLOW COMPUTER MARKET IN OIL & GAS: RESEARCH DESIGN
           2.1.1 SECONDARY AND PRIMARY RESEARCH
                    2.1.1.1 Key industry insights
           2.1.2 SECONDARY DATA
                    2.1.2.1 List of major secondary sources
                    2.1.2.2 Secondary sources
           2.1.3 PRIMARY DATA
                    2.1.3.1 Primary interviews with experts
                    2.1.3.2 Breakdown of primaries
                    2.1.3.3 Key data from primary sources
    2.2 MARKET SIZE ESTIMATION 
           FIGURE 3 MARKET SIZE ESTIMATION METHODOLOGY: SUPPLY-SIDE APPROACH
           2.2.1 BOTTOM-UP APPROACH
                    2.2.1.1 Approach to estimate market size using bottom-up analysis (demand side)
                               FIGURE 4 MARKET SIZE ESTIMATION METHODOLOGY: BOTTOM-UP APPROACH
           2.2.2 TOP-DOWN APPROACH
                    2.2.2.1 Approach to estimate market size using top-down analysis (supply side)
                               FIGURE 5 MARKET SIZE ESTIMATION METHODOLOGY: TOP-DOWN APPROACH
    2.3 MARKET BREAKDOWN AND DATA TRIANGULATION 
           FIGURE 6 DATA TRIANGULATION
    2.4 RESEARCH ASSUMPTIONS 
           FIGURE 7 RESEARCH STUDY ASSUMPTIONS
    2.5 PARAMETERS CONSIDERED TO ANALYZE IMPACT OF RECESSION ON FLOW COMPUTER MARKET IN OIL & GAS 
 
3 EXECUTIVE SUMMARY (Page No. - 40)
           FIGURE 8 HARDWARE SEGMENT TO ACCOUNT FOR LARGEST SHARE OF FLOW COMPUTER MARKET IN OIL & GAS IN 2028
           FIGURE 9 UPSTREAM OPERATIONS TO CREATE HIGH-GROWTH OPPORTUNITIES FOR FLOW COMPUTER MARKET DURING FORECAST PERIOD
           FIGURE 10 NORTH AMERICA ACCOUNTED FOR LARGEST MARKET SHARE IN 2022
    3.1 ANALYSIS OF RECESSION IMPACT ON FLOW COMPUTER MARKET IN OIL & GAS 
           FIGURE 11 GDP GROWTH PROJECTION TILL 2023 FOR MAJOR ECONOMIES (PERCENTAGE CHANGE)
 
4 PREMIUM INSIGHTS (Page No. - 44)
    4.1 ATTRACTIVE OPPORTUNITIES FOR PLAYERS IN FLOW COMPUTER MARKET IN OIL & GAS 
           FIGURE 12 ADOPTION OF PROCESS AUTOMATION IN OIL & GAS INDUSTRY TO PROVIDE OPPORTUNITIES FOR MARKET PLAYERS
    4.2 FLOW COMPUTER MARKET IN OIL & GAS, BY OFFERING 
           FIGURE 13 SOFTWARE SEGMENT TO REGISTER HIGHEST CAGR IN FLOW COMPUTER MARKET IN OIL & GAS BETWEEN 2023 AND 2028
    4.3 FLOW COMPUTER MARKET IN OIL & GAS IN NORTH AMERICA, BY COUNTRY AND OPERATION 
           FIGURE 14 US AND MIDSTREAM AND DOWNSTREAM TO ACCOUNT FOR LARGEST SHARE OF FLOW COMPUTER MARKET IN OIL & GAS IN NORTH AMERICA IN 2028
    4.4 REGION-WISE GROWTH RATE OF FLOW COMPUTER MARKET IN OIL & GAS 
           FIGURE 15 NORTH AMERICA TO RECORD HIGHEST CAGR DURING FORECAST PERIOD
 
5 MARKET OVERVIEW (Page No. - 47)
    5.1 INTRODUCTION 
    5.2 MARKET DYNAMICS 
           5.2.1 DRIVERS
                    5.2.1.1 Technological advancements in oil & gas industry
                    5.2.1.2 Need to maximize production potential from mature wells
                    5.2.1.3 Suitability in oil & gas industry
                               FIGURE 16 FLOW COMPUTER MARKET IN OIL & GAS: IMPACT ANALYSIS OF DRIVERS
           5.2.2 RESTRAINTS
                    5.2.2.1 Cybersecurity threats
                    5.2.2.2 High cost of flow computer and regular maintenance
                               FIGURE 17 FLOW COMPUTER MARKET IN OIL & GAS: IMPACT ANALYSIS OF RESTRAINTS
           5.2.3 OPPORTUNITIES
                    5.2.3.1 Growing demand for offshore/ultra-deep discoveries
                    5.2.3.2 Increasing adoption of process automation
                               FIGURE 18 FLOW COMPUTER MARKET IN OIL & GAS: IMPACT ANALYSIS OF OPPORTUNITIES
           5.2.4 CHALLENGES
                    5.2.4.1 Interoperability of multiple components from different solution providers
                               FIGURE 19 FLOW COMPUTER MARKET IN OIL & GAS: IMPACT ANALYSIS OF CHALLENGES
    5.3 VALUE CHAIN ANALYSIS 
           FIGURE 20 VALUE CHAIN ANALYSIS: MAJOR VALUE ADDITION DURING MANUFACTURING AND SYSTEM INTEGRATION PHASE
    5.4 ECOSYSTEM ANALYSIS 
           FIGURE 21 FLOW COMPUTER MARKET IN OIL & GAS: ECOSYSTEM ANALYSIS
           TABLE 1 FLOW COMPUTER MARKET IN OIL & GAS: ECOSYSTEM
    5.5 PRICING ANALYSIS 
           FIGURE 22 AVERAGE SELLING PRICE TREND OF FLOW COMPUTER
           TABLE 2 INDICATIVE PRICES OF FLOW COMPUTER
           5.5.1 AVERAGE SELLING PRICE OF FLOW COMPUTERS OFFERED BY KEY PLAYERS
                    FIGURE 23 AVERAGE SELLING PRICES OF FLOW COMPUTERS OFFERED BY KEY PLAYERS
                    TABLE 3 AVERAGE SELLING PRICES OF FLOW COMPUTERS OFFERED BY KEY PLAYERS (USD)
                    TABLE 4 AVERAGE SELLING PRICES OF FLOW COMPUTER BY REGION (USD)
    5.6 TRENDS/DISRUPTIONS IMPACTING CUSTOMERS’ BUSINESSES 
           FIGURE 24 REVENUE SHIFT AND NEW REVENUE POCKETS FOR PLAYERS IN FLOW COMPUTER MARKET IN OIL & GAS
    5.7 TECHNOLOGY ANALYSIS 
           5.7.1 IMPACT OF IIOT ON FLOW COMPUTER MARKET IN OIL & GAS
           5.7.2 INTEGRATION OF ARTIFICIAL INTELLIGENCE INTO FLOW COMPUTERS
    5.8 PORTER’S FIVE FORCES ANALYSIS 
           FIGURE 25 FLOW COMPUTER MARKET IN OIL & GAS: PORTER’S FIVE FORCES ANALYSIS
    5.9 KEY STAKEHOLDERS AND BUYING CRITERIA 
           5.9.1 KEY STAKEHOLDERS IN BUYING PROCESS
                    FIGURE 26 INFLUENCE OF STAKEHOLDERS ON BUYING PROCESS FOR TOP 3 COMPONENTS
                    TABLE 5 INFLUENCE OF STAKEHOLDERS ON BUYING PROCESS FOR TOP 3 COMPONENTS (%)
           5.9.2 BUYING CRITERIA
                    FIGURE 27 KEY BUYING CRITERIA FOR TOP 3 COMPONENTS
                    TABLE 6 KEY BUYING CRITERIA FOR TOP 3 COMPONENTS
    5.10 CASE STUDIES 
           TABLE 7 TURKSTREAM GAS PIPELINE USED CONTREC’S 515 GAS FLOW COMPUTERS FOR FLOW MEASUREMENT SOLUTION
           TABLE 8 INSTALLATION OF E-CHART FLOW COMPUTERS FOR ACCURATE MONITOR MEASUREMENTS FOR GAS LIFT OPERATION
           TABLE 9 HUSKY ENERGY UPGRADED ITS LIMA REFINERY WITH MICRO MVL FLOW COMPUTER FOR RELIABLE MEASUREMENT
           TABLE 10 INSTALLATION OF EMERSON’S FB1200 FLOW COMPUTER BY WATERBRIDGE TO ACHIEVE ACCURATE AND LOW MAINTENANCE METER PERFORMANCE
    5.11 TRADE ANALYSIS 
           FIGURE 28 IMPORT DATA, BY COUNTRY, 2017–2021 (USD MILLION)
           FIGURE 29 EXPORT DATA, BY COUNTRY, 2017–2021 (USD MILLION)
    5.12 PATENT ANALYSIS 
           FIGURE 30 TOP 10 COMPANIES WITH HIGHEST NUMBER OF PATENT APPLICATIONS IN LAST 10 YEARS
           TABLE 11 TOP 20 PATENT OWNERS IN US IN LAST 10 YEARS
           FIGURE 31 NUMBER OF PATENTS GRANTED FROM 2013 TO 2022
           TABLE 12 LIST OF FEW PATENTS IN FLOW COMPUTER MARKET IN OIL & GAS, 2020–2023
    5.13 KEY CONFERENCES AND EVENTS, 2023–2024 
           TABLE 13 FLOW COMPUTER MARKET IN OIL & GAS: DETAILED LIST OF CONFERENCES AND EVENTS
    5.14 REGULATORY BODIES, GOVERNMENT AGENCIES, AND OTHER ORGANIZATIONS 
           TABLE 14 NORTH AMERICA: LIST OF REGULATORY BODIES, GOVERNMENT AGENCIES, AND OTHER ORGANIZATIONS
           TABLE 15 EUROPE: LIST OF REGULATORY BODIES, GOVERNMENT AGENCIES, AND OTHER ORGANIZATIONS
           TABLE 16 ASIA PACIFIC: LIST OF REGULATORY BODIES, GOVERNMENT AGENCIES, AND OTHER ORGANIZATIONS
           TABLE 17 REST OF THE WORLD: LIST OF REGULATORY BODIES, GOVERNMENT AGENCIES, AND OTHER ORGANIZATIONS
           5.14.1 STANDARDS
                    TABLE 18 STANDARDS FOR FLOW COMPUTER MARKET IN OIL & GAS
 
6 APPLICATIONS OF FLOW COMPUTERS IN OIL & GAS INDUSTRY (Page No. - 73)
    6.1 INTRODUCTION 
    6.2 CUSTODY TRANSFER 
    6.3 PIPELINE FLOW MONITORING 
    6.4 WELLHEAD MONITORING 
 
7 FLOW COMPUTER MARKET IN OIL & GAS, BY OFFERING (Page No. - 74)
    7.1 INTRODUCTION 
           FIGURE 32 HARDWARE SEGMENT TO LEAD MARKET DURING FORECAST PERIOD
           TABLE 19 FLOW COMPUTER MARKET IN OIL & GAS, BY OFFERING, 2019–2022 (USD MILLION)
           TABLE 20 FLOW COMPUTER MARKET IN OIL & GAS, BY OFFERING, 2023–2028 (USD MILLION)
    7.2 HARDWARE 
           7.2.1 USED IN WELLHEAD MEASUREMENT, CUSTODY TRANSFER, AND FUEL MONITORING
           7.2.2 PROCESSOR
           7.2.3 MEMORY
           7.2.4 INPUT/OUTPUT (I/O) MODULE
           7.2.5 POWER SUPPLY
           7.2.6 COMMUNICATION INTERFACE
           7.2.7 ENCLOSURE
           7.2.8 DISPLAY
    7.3 SOFTWARE 
           7.3.1 ENABLES ACCURATE MEASUREMENT, MONITORING, AND FLOW OF MEDIUM
    7.4 SUPPORT SERVICES 
           7.4.1 MINIMIZES ECONOMIC LOSSES AND TECHNICAL ISSUES POST INSTALLATION
           7.4.2 SYSTEM INTEGRATION
           7.4.3 CUSTOMIZATION
           7.4.4 FIELD SERVICES
           7.4.5 CONSULTING SERVICES
 
8 FLOW COMPUTER MARKET IN OIL & GAS, BY OPERATION (Page No. - 80)
    8.1 INTRODUCTION 
           FIGURE 33 MIDSTREAM AND UPSTREAM OPERATION TO ACCOUNT FOR LARGEST MARKET SHARE DURING FORECAST PERIOD
           TABLE 21 FLOW COMPUTER MARKET IN OIL & GAS, BY OPERATION, 2019–2022 (USD MILLION)
           TABLE 22 FLOW COMPUTER MARKET IN OIL & GAS, BY OPERATION, 2023–2028 (USD MILLION)
    8.2 UPSTREAM 
           8.2.1 ENGAGES IN EXPLORATION, DRILLING, AND PRODUCTION
                    TABLE 23 UPSTREAM FLOW COMPUTER MARKET, BY REGION, 2019–2022 (USD MILLION)
                    TABLE 24 UPSTREAM FLOW COMPUTER MARKET, BY REGION, 2023–2028 (USD MILLION)
                    TABLE 25 NORTH AMERICA: UPSTREAM FLOW COMPUTER MARKET, BY COUNTRY, 2019–2022 (USD MILLION)
                    TABLE 26 NORTH AMERICA: UPSTREAM FLOW COMPUTER MARKET, BY COUNTRY, 2023–2028 (USD MILLION)
                    TABLE 27 EUROPE: UPSTREAM FLOW COMPUTER MARKET, BY COUNTRY, 2019–2022 (USD MILLION)
                    TABLE 28 EUROPE: UPSTREAM FLOW COMPUTER MARKET, BY COUNTRY, 2023–2028 (USD MILLION)
                    TABLE 29 MIDDLE EAST: UPSTREAM FLOW COMPUTER MARKET, BY COUNTRY, 2019–2022 (USD MILLION)
                    TABLE 30 MIDDLE EAST: UPSTREAM FLOW COMPUTER MARKET, BY COUNTRY, 2023–2028 (USD MILLION)
                    TABLE 31 ASIA PACIFIC: UPSTREAM FLOW COMPUTER MARKET, BY COUNTRY, 2019–2022 (USD MILLION)
                    TABLE 32 ASIA PACIFIC: UPSTREAM FLOW COMPUTER MARKET, BY COUNTRY, 2023–2028 (USD MILLION)
                    TABLE 33 REST OF THE WORLD: UPSTREAM FLOW COMPUTER MARKET, BY COUNTRY, 2019–2022 (USD MILLION)
                    TABLE 34 REST OF THE WORLD: UPSTREAM FLOW COMPUTER MARKET, BY COUNTRY, 2023–2028 (USD MILLION)
    8.3 MIDSTREAM AND DOWNSTREAM 
           8.3.1 APPLICATIONS IN CUSTODY TRANSFER, PIPELINE FLOW MONITORING, ALLOCATION, BLENDING, AND BATCHING
                    TABLE 35 MIDSTREAM AND DOWNSTREAM FLOW COMPUTER MARKET, BY REGION, 2019–2022 (USD MILLION)
                    TABLE 36 MIDSTREAM AND DOWNSTREAM FLOW COMPUTER MARKET, BY REGION , BY REGION, 2023–2028 (USD MILLION)
                    TABLE 37 NORTH AMERICA: MIDSTREAM AND UPSTREAM FLOW COMPUTER MARKET, BY COUNTRY, 2019–2022 (USD MILLION)
                    TABLE 38 NORTH AMERICA: MIDSTREAM AND UPSTREAM FLOW COMPUTER MARKET, BY COUNTRY, 2023–2028 (USD MILLION)
                    TABLE 39 EUROPE: MIDSTREAM AND UPSTREAM FLOW COMPUTER MARKET, BY COUNTRY, 2019–2022 (USD MILLION)
                    TABLE 40 EUROPE: MIDSTREAM AND UPSTREAM FLOW COMPUTER MARKET, BY COUNTRY, 2023–2028 (USD MILLION)
                    TABLE 41 MIDDLE EAST: MIDSTREAM AND UPSTREAM FLOW COMPUTER MARKET, BY COUNTRY, 2019–2022 (USD MILLION)
                    TABLE 42 MIDDLE EAST: MIDSTREAM AND UPSTREAM FLOW COMPUTER MARKET, BY COUNTRY, 2023–2028 (USD MILLION)
                    TABLE 43 ASIA PACIFIC: MIDSTREAM AND UPSTREAM FLOW COMPUTER MARKET, BY COUNTRY, 2019–2022 (USD MILLION)
                    TABLE 44 ASIA PACIFIC: MIDSTREAM AND UPSTREAM FLOW COMPUTER MARKET, BY COUNTRY, 2023–2028 (USD MILLION)
                    TABLE 45 REST OF THE WORLD: MIDSTREAM AND UPSTREAM FLOW COMPUTER MARKET, BY COUNTRY, 2019–2022 (USD MILLION)
                    TABLE 46 REST OF THE WORLD: MIDSTREAM AND UPSTREAM FLOW COMPUTER MARKET, BY COUNTRY, 2023–2028 (USD MILLION)
 
9 FLOW COMPUTER MARKET IN OIL & GAS, BY REGION (Page No. - 91)
    9.1 INTRODUCTION 
           FIGURE 34 US TO EXHIBIT HIGHEST CAGR IN FLOW COMPUTER MARKET IN OIL & GAS DURING FORECAST PERIOD
           TABLE 47 FLOW COMPUTER MARKET IN OIL & GAS, BY REGION, 2019–2022 (USD MILLION)
           TABLE 48 FLOW COMPUTER MARKET IN OIL & GAS, BY REGION, 2023–2028 (USD MILLION)
    9.2 NORTH AMERICA 
           FIGURE 35 NORTH AMERICA: SNAPSHOT OF FLOW COMPUTER MARKET IN OIL & GAS
           TABLE 49 NORTH AMERICA: FLOW COMPUTER MARKET IN OIL & GAS, BY COUNTRY, 2019–2022(USD MILLION)
           TABLE 50 NORTH AMERICA: FLOW COMPUTER MARKET IN OIL & GAS, BY COUNTRY, 2023–2028 (USD MILLION)
           TABLE 51 NORTH AMERICA: FLOW COMPUTER MARKET IN OIL & GAS, BY OPERATION, 2019–2022 (USD MILLION)
           TABLE 52 NORTH AMERICA: FLOW COMPUTER MARKET IN OIL & GAS, BY OPERATION, 2023–2028 (USD MILLION)
           9.2.1 US
                    9.2.1.1 Contributes highest market share in region
                               TABLE 53 US: FLOW COMPUTER MARKET IN OIL & GAS, BY OPERATION, 2019–2022 (USD MILLION)
                               TABLE 54 US: FLOW COMPUTER MARKET IN OIL & GAS, BY OPERATION, 2023–2028 (USD MILLION)
           9.2.2 CANADA
                    9.2.2.1 Significant oil reserves and expanding production
                               TABLE 55 CANADA: FLOW COMPUTER MARKET IN OIL & GAS, BY OPERATION, 2019–2022 (USD MILLION)
                               TABLE 56 CANADA: FLOW COMPUTER MARKET IN OIL & GAS, BY OPERATION, 2023–2028 (USD MILLION)
           9.2.3 MEXICO
                    9.2.3.1 Moderate market growth
                               TABLE 57 MEXICO: FLOW COMPUTER MARKET IN OIL & GAS, BY OPERATION, 2019–2022 (USD MILLION)
                               TABLE 58 MEXICO: FLOW COMPUTER MARKET IN OIL & GAS, BY OPERATION, 2023–2028 (USD MILLION)
    9.3 EUROPE 
           FIGURE 36 EUROPE: SNAPSHOT OF FLOW COMPUTER MARKET IN OIL & GAS
           TABLE 59 EUROPE: FLOW COMPUTER MARKET IN OIL & GAS, BY COUNTRY, 2019–2022(USD MILLION)
           TABLE 60 EUROPE: FLOW COMPUTER MARKET IN OIL & GAS, BY COUNTRY, 2023–2028 (USD MILLION)
           TABLE 61 EUROPE: FLOW COMPUTER MARKET IN OIL & GAS, BY OPERATION, 2019–2022 (USD MILLION)
           TABLE 62 EUROPE: FLOW COMPUTER MARKET IN OIL & GAS, BY OPERATION, 2023–2028 (USD MILLION)
           9.3.1 NORWAY
                    9.3.1.1 Growing investments in oil & gas projects
                               TABLE 63 NORWAY: FLOW COMPUTER MARKET IN OIL & GAS, BY OPERATION, 2019–2022 (USD MILLION)
                               TABLE 64 NORWAY: FLOW COMPUTER MARKET IN OIL & GAS, BY OPERATION, 2023–2028 (USD MILLION)
           9.3.2 KAZAKHSTAN
                    9.3.2.1 Exports 80% of oil produced
                               TABLE 65 KAZAKHSTAN: FLOW COMPUTER MARKET IN OIL & GAS, BY OPERATION, 2019–2022 (USD MILLION)
                               TABLE 66 KAZAKHSTAN: FLOW COMPUTER MARKET IN OIL & GAS, BY OPERATION, 2023–2028 (USD MILLION)
           9.3.3 UK
                    9.3.3.1 Presence of several technology providers
                               TABLE 67 UK: FLOW COMPUTER MARKET IN OIL & GAS, BY OPERATION, 2019–2022 (USD MILLION)
                               TABLE 68 UK: FLOW COMPUTER MARKET IN OIL & GAS, BY OPERATION, 2023–2028 (USD MILLION)
           9.3.4 REST OF EUROPE
                    TABLE 69 REST OF EUROPE: FLOW COMPUTER MARKET IN OIL & GAS, BY OPERATION, 2019–2022 (USD MILLION)
                    TABLE 70 REST OF EUROPE: FLOW COMPUTER MARKET IN OIL & GAS, BY OPERATION, 2023–2028 (USD MILLION)
    9.4 MIDDLE EAST 
           TABLE 71 MIDDLE EAST: FLOW COMPUTER MARKET IN OIL & GAS, BY COUNTRY, 2019–2022(USD MILLION)
           TABLE 72 MIDDLE EAST: FLOW COMPUTER MARKET IN OIL & GAS, BY COUNTRY, 2023–2028 (USD MILLION)
           TABLE 73 MIDDLE EAST: FLOW COMPUTER MARKET IN OIL & GAS, BY OPERATION, 2019–2022 (USD MILLION)
           TABLE 74 MIDDLE EAST: FLOW COMPUTER MARKET IN OIL & GAS, BY OPERATION, 2023–2028 (USD MILLION)
           9.4.1 SAUDI ARABIA
                    9.4.1.1 Continuous oil exploration and development by Saudi Aramco
                               TABLE 75 SAUDI ARABIA: FLOW COMPUTER MARKET IN OIL & GAS, BY OPERATION, 2019–2022 (USD MILLION)
                               TABLE 76 SAUDI ARABIA: FLOW COMPUTER MARKET IN OIL & GAS, BY OPERATION, 2023–2028 (USD MILLION)
           9.4.2 IRAN
                    9.4.2.1 Increased production activities
                               TABLE 77 IRAN: FLOW COMPUTER MARKET IN OIL & GAS, BY OPERATION, 2019–2022 (USD MILLION)
                               TABLE 78 IRAN: FLOW COMPUTER MARKET IN OIL & GAS, BY OPERATION, 2023–2028 (USD MILLION)
           9.4.3 QATAR
                    9.4.3.1 Depleting oil production
                               TABLE 79 QATAR: FLOW COMPUTER MARKET IN OIL & GAS, BY OPERATION, 2019–2022 (USD MILLION)
                               TABLE 80 QATAR: FLOW COMPUTER MARKET IN OIL & GAS, BY OPERATION, 2023–2028 (USD MILLION)
           9.4.4 REST OF MIDDLE EAST
                    TABLE 81 REST OF MIDDLE EAST: FLOW COMPUTER MARKET IN OIL & GAS, BY OPERATION, 2019–2022 (USD MILLION)
                    TABLE 82 REST OF MIDDLE EAST: FLOW COMPUTER MARKET IN OIL & GAS, BY OPERATION, 2023–2028 (USD MILLION)
    9.5 ASIA PACIFIC 
           FIGURE 37 ASIA PACIFIC: SNAPSHOT OF FLOW COMPUTER MARKET IN OIL & GAS
           TABLE 83 ASIA PACIFIC: FLOW COMPUTER MARKET IN OIL & GAS, BY COUNTRY, 2019–2022(USD MILLION)
           TABLE 84 ASIA PACIFIC: FLOW COMPUTER MARKET IN OIL & GAS, BY COUNTRY, 2023–2028 (USD MILLION)
           TABLE 85 ASIA PACIFIC: FLOW COMPUTER MARKET IN OIL & GAS, BY OPERATION, 2019–2022 (USD MILLION)
           TABLE 86 ASIA PACIFIC: FLOW COMPUTER MARKET IN OIL & GAS, BY OPERATION, 2023–2028 (USD MILLION)
           9.5.1 CHINA
                    9.5.1.1 Expected to dominate market in Asia Pacific
                               TABLE 87 CHINA: FLOW COMPUTER MARKET IN OIL & GAS, BY OPERATION, 2019–2022 (USD MILLION)
                               TABLE 88 CHINA: FLOW COMPUTER MARKET IN OIL & GAS, BY OPERATION, 2023–2028 (USD MILLION)
           9.5.2 INDIA
                    9.5.2.1 Redevelopment of legacy oilfields and government initiatives
                               TABLE 89 INDIA: FLOW COMPUTER MARKET IN OIL & GAS, BY OPERATION, 2019–2022 (USD MILLION)
                               TABLE 90 INDIA: FLOW COMPUTER MARKET IN OIL & GAS, BY OPERATION, 2023–2028 (USD MILLION)
           9.5.3 INDONESIA
                    9.5.3.1 Government plans to boost oil & gas production
                               TABLE 91 INDONESIA: FLOW COMPUTER MARKET IN OIL & GAS, BY OPERATION, 2019–2022 (USD MILLION)
                               TABLE 92 INDONESIA: FLOW COMPUTER MARKET IN OIL & GAS, BY OPERATION, 2023–2028 (USD MILLION)
           9.5.4 REST OF ASIA PACIFIC
                    TABLE 93 REST OF ASIA PACIFIC: FLOW COMPUTER MARKET IN OIL & GAS, BY OPERATION, 2019–2022 (USD MILLION)
                    TABLE 94 REST OF ASIA PACIFIC: FLOW COMPUTER MARKET IN OIL & GAS, BY OPERATION, 2023–2028 (USD MILLION)
    9.6 REST OF THE WORLD 
           TABLE 95 REST OF THE WORLD: FLOW COMPUTER MARKET IN OIL & GAS, BY REGION, 2019–2022(USD MILLION)
           TABLE 96 REST OF THE WORLD: FLOW COMPUTER MARKET IN OIL & GAS, BY REGION, 2023–2028 (USD MILLION)
           TABLE 97 REST OF THE WORLD: FLOW COMPUTER MARKET IN OIL & GAS, BY OPERATION, 2019–2022 (USD MILLION)
           TABLE 98 REST OF THE WORLD: FLOW COMPUTER MARKET IN OIL & GAS, BY OPERATION, 2023–2028 (USD MILLION)
           9.6.1 SOUTH AMERICA
                    9.6.1.1 Digitalization in oilfields
                               TABLE 99 SOUTH AMERICA: FLOW COMPUTER MARKET IN OIL & GAS, BY OPERATION, 2019–2022 (USD MILLION)
                               TABLE 100 SOUTH AMERICA: FLOW COMPUTER MARKET IN OIL & GAS, BY OPERATION, 2023–2028 (USD MILLION)
           9.6.2 AFRICA
                    9.6.2.1 Governments plans to expand energy segment
                               TABLE 101 AFRICA: FLOW COMPUTER MARKET IN OIL & GAS, BY OPERATION, 2019–2022 (USD MILLION)
                               TABLE 102 AFRICA: FLOW COMPUTER MARKET IN OIL & GAS, BY OPERATION, 2023–2028 (USD MILLION)
 
10 COMPETITIVE LANDSCAPE (Page No. - 120)
     10.1 INTRODUCTION 
     10.2 TOP 5 COMPANY REVENUE ANALYSIS 
             FIGURE 38 FLOW COMPUTER MARKET IN OIL & GAS: REVENUE ANALYSIS OF FIVE KEY PLAYERS, 2018–2022
     10.3 MARKET SHARE ANALYSIS OF TOP FIVE PLAYERS, 2022 
             FIGURE 39 SHARE OF MAJOR PLAYERS IN FLOW COMPUTER MARKET IN OIL & GAS, 2022
             TABLE 103 MARKET SHARE OF TOP FIVE PLAYERS IN FLOW COMPUTER MARKET IN OIL & GAS, 2022
     10.4 COMPANY EVALUATION QUADRANT, 2022 
             10.4.1 STARS
             10.4.2 EMERGING LEADERS
             10.4.3 PERVASIVE PLAYERS
             10.4.4 PARTICIPANTS
                        FIGURE 40 FLOW COMPUTER MARKET IN OIL & GAS: COMPANY EVALUATION QUADRANT, 2022
     10.5 FLOW COMPUTER MARKET IN OIL & GAS: PRODUCT FOOTPRINT 
             TABLE 104 COMPANY FOOTPRINT
             TABLE 105 PRODUCT TYPE FOOTPRINT OF COMPANIES
             TABLE 106 OPERATION FOOTPRINT OF COMPANIES
             TABLE 107 REGIONAL FOOTPRINT OF COMPANIES
     10.6 SMALL AND MEDIUM-SIZED ENTERPRISES (SME) EVALUATION MATRIX, 2022 
             10.6.1 PROGRESSIVE COMPANIES
             10.6.2 RESPONSIVE COMPANIES
             10.6.3 DYNAMIC COMPANIES
             10.6.4 STARTING BLOCKS
                        FIGURE 41 FLOW COMPUTER MARKET IN OIL & GAS, SME EVALUATION QUADRANT, 2022
             10.6.5 STARTUPS/SMES EVALUATION MATRIX
                        TABLE 108 FLOW COMPUTER MARKET IN OIL & GAS: DETAILED LIST OF KEY STARTUPS/SMES
                        TABLE 109 FLOW COMPUTER MARKET IN OIL & GAS: COMPETITIVE BENCHMARKING OF KEY STARTUPS/SMES
     10.7 COMPETITIVE SITUATIONS AND TRENDS 
             10.7.1 FLOW COMPUTER MARKET IN OIL & GAS: PRODUCT LAUNCHES, SEPTEMBER 2021–JANUARY 2023
                        TABLE 110 FLOW COMPUTER MARKET IN OIL & GAS: PRODUCT LAUNCHES, SEPTEMBER 2021–JANUARY 2023
             10.7.2 FLOW COMPUTER MARKET IN OIL & GAS: DEALS, JUNE 2022
                        TABLE 111 FLOW COMPUTER MARKET IN OIL & GAS: DEALS, JUNE 2022
             10.7.3 FLOW COMPUTER MARKET IN OIL & GAS: OTHERS, FEBRUARY 2021
                        TABLE 112 FLOW COMPUTER MARKET IN OIL & GAS: OTHERS, FEBRUARY 2021
 
11 COMPANY PROFILES (Page No. - 133)
     11.1 KEY PLAYERS 
(Business Overview, Products Offered, Recent Developments, and MnM View (Key strengths/Right to Win, Strategic Choices Made, and Weaknesses and Competitive Threats))*  
             11.1.1 EMERSON ELECTRIC CO.
                        TABLE 113 EMERSON ELECTRIC CO.: COMPANY OVERVIEW
                        FIGURE 42 EMERSON ELECTRIC CO.: COMPANY SNAPSHOT
                        TABLE 114 EMERSON ELECTRIC CO.: PRODUCTS OFFERED
                        TABLE 115 EMERSON ELECTRIC CO.: PRODUCT LAUNCHES
             11.1.2 HONEYWELL INTERNATIONAL, INC.
                        TABLE 116 HONEYWELL INTERNATIONAL, INC.: COMPANY OVERVIEW
                        FIGURE 43 HONEYWELL INTERNATIONAL, INC.: COMPANY SNAPSHOT
                        TABLE 117 HONEYWELL INTERNATIONAL, INC.: PRODUCTS OFFERED
             11.1.3 ABB
                        TABLE 118 ABB: COMPANY OVERVIEW
                        FIGURE 44 ABB: COMPANY SNAPSHOT
                        TABLE 119 ABB: PRODUCTS OFFERED
                        TABLE 120 ABB: DEALS
                        TABLE 121 ABB: OTHERS
             11.1.4 THERMO FISHER SCIENTIFIC INC.
                        TABLE 122 THERMO FISHER SCIENTIFIC INC.: COMPANY OVERVIEW
                        FIGURE 45 THERMO FISHER SCIENTIFIC INC.: COMPANY SNAPSHOT
                        TABLE 123 THERMO FISHER SCIENTIFIC INC.: PRODUCTS OFFERED
                        TABLE 124 THERMO FISHER SCIENTIFIC INC.: PRODUCT LAUNCHES
             11.1.5 SCHNEIDER ELECTRIC
                        TABLE 125 SCHNEIDER ELECTRIC: COMPANY OVERVIEW
                        FIGURE 46 SCHNEIDER ELECTRIC: COMPANY SNAPSHOT
                        TABLE 126 SCHNEIDER ELECTRIC: PRODUCTS OFFERED
             11.1.6 KROHNE MESSTECHNIK GMBH
                        TABLE 127 KROHNE MESSTECHNIK GMBH: COMPANY OVERVIEW
                        TABLE 128 KROHNE MESSTECHNIK GMBH: PRODUCTS OFFERED
                        TABLE 129 YOKOGAWA ELECTRIC CORPORATION: COMPANY OVERVIEW
                        FIGURE 47 YOKOGAWA ELECTRIC CORPORATION: COMPANY SNAPSHOT
                        TABLE 130 YOKOGAWA ELECTRIC CORPORATION: PRODUCTS OFFERED
             11.1.8 TECHNIPFMC PLC
                        TABLE 131 TECHNIPFMC PLC: COMPANY OVERVIEW
                        FIGURE 48 TECHNIPFMC PLC: COMPANY SNAPSHOT
                        TABLE 132 TECHNIPFMC PLC: PRODUCTS OFFERED
             11.1.9 OMNI FLOW COMPUTERS, INC.
                        TABLE 133 OMNI FLOW COMPUTERS, INC.: COMPANY OVERVIEW
                        TABLE 134 OMNI FLOW COMPUTERS, INC.: PRODUCTS OFFERED
             11.1.10 DYNAMIC FLOW COMPUTERS, INC.
                        TABLE 135 DYNAMIC FLOW COMPUTERS, INC.: COMPANY OVERVIEW
                        TABLE 136 DYNAMIC FLOW COMPUTERS, INC.: PRODUCTS OFFERED
             11.1.11 CONTREC LIMITED
                        TABLE 137 CONTREC LIMITED: COMPANY OVERVIEW
                        TABLE 138 CONTREC LIMITED: PRODUCTS OFFERED
             11.1.12 KESSLER-ELLIS PRODUCTS (KEP) CO, INC.
                        TABLE 139 KESSLER-ELLIS PRODUCTS CO, INC.: COMPANY OVERVIEW
                        TABLE 140 KESSLER-ELLIS PRODUCTS CO, INC.: PRODUCTS OFFERED
             11.1.13 SENSIA
                        TABLE 141 SENSIA: COMPANY OVERVIEW
                        TABLE 142 SENSIA: PRODUCTS OFFERED
     11.2 OTHER KEY PLAYERS 
             11.2.1 PROSOFT TECHNOLOGY, INC.
             11.2.2 FLOWMETRICS, INC.
             11.2.3 SPIRAX SARCO LIMITED
             11.2.4 SICK AG
             11.2.5 BADGER METER, INC.
             11.2.6 QUORUM BUSINESS SOLUTIONS, INC.
             11.2.7 ENDRESS+HAUSER AG
             11.2.8 PLUM SP. Z O.O
             11.2.9 FLUIDWELL BV
             11.2.10 OVAL CORPORATION
             11.2.11 SENECA SRL
             11.2.12 HOFFER FLOW CONTROLS, INC.
*Details on Business Overview, Products Offered, Recent Developments, and MnM View (Key strengths/Right to Win, Strategic Choices Made, and Weaknesses and Competitive Threats) might not be captured in case of unlisted companies.  
 
12 ADJACENT AND RELATED MARKETS (Page No. - 172)
     12.1 INTRODUCTION 
     12.2 STUDY LIMITATIONS 
     12.3 PROCESS AUTOMATION AND INSTRUMENTATION MARKET, BY INSTRUMENT 
             TABLE 143 PROCESS AUTOMATION AND INSTRUMENTATION MARKET, BY TYPE, 2018–2021 (USD MILLION)
             TABLE 144 PROCESS AUTOMATION AND INSTRUMENTATION MARKET, BY TYPE, 2022–2027 (USD MILLION)
             TABLE 145 PROCESS AUTOMATION AND INSTRUMENTATION MARKET, BY INSTRUMENT, 2018–2021 (USD MILLION)
             TABLE 146 PROCESS AUTOMATION AND INSTRUMENTATION MARKET, BY INSTRUMENT, 2022–2027 (USD MILLION)
             12.3.1 FIELD INSTRUMENTS
                        12.3.1.1 Level transmitters
                                     12.3.1.1.1 Accurate measurements in water & wastewater treatment industry
                        12.3.1.2 Pressure transmitters
                                     12.3.1.2.1 Widespread use in oil & gas industry
                        12.3.1.3 Temperature transmitters
                                     12.3.1.3.1 Simplify operations
                        12.3.1.4 Others
                                     12.3.1.4.1 Humidity transmitters
                        12.3.1.5 Vibration level switches
             12.3.2 PROCESS ANALYZERS
                        12.3.2.1 High demand from pharmaceutical industry
 
13 APPENDIX (Page No. - 178)
     13.1 DISCUSSION GUIDE 
     13.2 KNOWLEDGESTORE: MARKETSANDMARKETS’ SUBSCRIPTION PORTAL 
     13.3 CUSTOMIZATION OPTIONS 
     13.4 RELATED REPORTS 
     13.5 AUTHOR DETAILS 
 

The study involved four major activities in estimating the size of the flow computer market in oil & gas. Exhaustive secondary research was done to collect information on the market, peer market, and parent market. The next step was to validate these findings, assumptions, and sizing with industry experts across value chains through primary research. The bottom-up and top-down approaches were employed to estimate the overall market size. After that, market breakdown and data triangulation were used to estimate the market size of segments and subsegments.

Secondary Research

In the secondary research process, various sources were referred to for identifying and collecting information important for this study. Secondary sources include corporate filings (such as annual reports, investor presentations, and financial statements, press releases); trade, business, and professional associations; white papers, flow computer-related journals, and certified publications; articles by recognized authors; gold and silver standard websites; and directories.

Secondary research was mainly conducted to obtain key information about the market value chain, the industry supply chain, the total pool of key players, market classification and segmentation according to industry trends to the bottom-most level, and key developments from both markets- and technology-oriented perspectives. Data from secondary research was collected and analyzed to arrive at the overall market size, which was further validated by primary research.

Primary Research

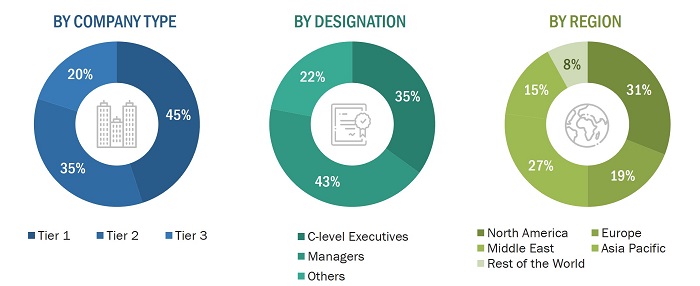
Extensive primary research has been conducted after understanding and analyzing the flow computer market through secondary research. Several primary telephonic interviews have been conducted with key opinion leaders from the demand- and supply-side vendors across four major regions—North America, Europe, Asia Pacific, and the Rest of the World (RoW). Moreover, questionnaires and emails were also used to collect the data.
Flow Computer Market Size, and Share

To know about the assumptions considered for the study, download the pdf brochure

Market Size Estimation

In this report, for the complete market engineering process, both top-down and bottom-up approaches were used, along with several data triangulation methods, to estimate, forecast, and validate the size of the market and its segments and subsegments listed in the report. Extensive qualitative and quantitative analyses were carried out to list the key information/insights pertaining to the flow computer market in oil & gas.

Major players in the flow computer market in oil & gas have been identified through secondary research, and their market shares in the respective regions have been determined through primary and secondary research. The entire research methodology included the study of annual and financial reports of top players and interviews with experts (such as CEOs, VPs, directors, and marketing executives) for key insights (quantitative and qualitative). All percentage shares, splits, and breakdowns have been determined using secondary sources and verified through primary sources. This data was consolidated and enhanced with detailed inputs and analysis from MarketsandMarkets and presented in this report.

Flow Computer Market in Oil & Gas: Bottom-Up Approach

  • Identifying various applications in upstream, midstream, and downstream operations using or expected to adopt flow computers in the oil & gas industry
  • Analyzing each operation, along with major related companies and their system integrators, and identifying service providers for implementing flow computers in operations
  • Understanding the demand generated by these operations for flow computers in the oil & gas industry
  • Estimating the size of the flow computer market for each country and each region
  • Tracking the ongoing and upcoming implementation of technology projects by various companies for each operation and region and forecasting the market size based on these developments and other critical parameters, such as investments in R&D

Flow Computer Market Size, and Bottom-Up Approach

Flow Computer Market in Oil & Gas: Top-Down Approach

  • Focusing on top-line investments and spending in the ecosystem of the oil & gas industry; Tracking further split by new installations, modification of solutions, and developments in key market areas
  • Building and developing the information related to market revenues offered by key hardware, software, and service providers
  • Carrying out multiple on-field discussions with key opinion leaders across each major company involved in the development of hardware and software and offering services pertaining to flow computers in oil & gas
  • Estimating the geographic split using secondary sources based on factors such as oil & gas production, refining capacity, consumption, and adoption of technologies in the oil & gas operations

Flow Computer Market Size, and Top-Down Approach

Data Triangulation

After arriving at the overall size of the flow computer market in oil & gas through the process explained above, the total market has been split into several segments. The market breakdown and data triangulation procedures have been employed, wherever applicable, to complete the overall market engineering process and arrive at the exact statistics for all segments. The data has been triangulated by studying various factors and trends from the demand and supply sides. The market has also been validated using top-down and bottom-up approaches.

Market Definition

A flow computer is a microprocessor-based device that measures, monitors, and controls the flow of liquid, gas, and in some cases, steam. The flow computer receives signal inputs from flow meters: temperature, pressure, and other flow measurement transmitters. It calculates and records the data from the interfaced devices, important events, and alarms and then transfers it to external computers or workstations for inspecting, management, and accounting. It operates as the central point of the control system, collating and interpreting the raw data collected from monitoring equipment, which is then used to provide appropriate control over the system that it supervises.

Key Stakeholders

  • Original Technology Designers and Suppliers
  • Technical Universities
  • Electronic Hardware Equipment Manufacturers
  • Intellectual Property Vendors
  • Market Research and Consulting Firms
  • Intellectual Property Vendors
  • Network Service Providers
  • Software Service Providers
  • Component Providers for Flow Computer Solutions and Software Integrators
  • Subcomponent Manufacturers
  • Government Organizations
  • Technology Providers
  • Software Solution Providers
  • Venture Capitalists, Private Equity Firms, and Startups

Report Objectives

  • To define, analyze, and forecast the flow computer market in oil & gas, in terms of value, by offering, operation, and region
  • To forecast the market size for various segments with respect to five main regions: North America, Europe, Middle East, Asia Pacific, and Rest of the World (RoW)
  • To provide detailed information regarding drivers, restraints, opportunities, and challenges influencing market growth
  • To strategically analyze the micromarkets1 with respect to individual growth trends, prospects, and contributions to the total market
  • To provide a detailed overview of the value chain in the flow computer market in oil & gas and analyze the market trends
  • To analyze opportunities in the market for various stakeholders by identifying the high growth segments of the flow computer market in oil & gas
  • To strategically profile the key players and comprehensively analyze their market position in terms of ranking and core competencies2, along with detailing the competitive landscape for the market leaders
  • To benchmark players within the market using competitive leadership mapping, which analyzes market players on various parameters within the broad categories of business and product strategies
  • To map the competitive intelligence based on company profiles, key player strategies, and game-changing developments, such as product launches and partnerships
  • To analyze the probable impact of the recession on the market in the near future

Available Customizations

Based on the given market data, MarketsandMarkets offers customizations in the reports according to the client’s specific requirements. The available customization options are as follows:

Company Information

  • Detailed analysis and profiling of additional market players (up to 5)
Custom Market Research Services

We will customize the research for you, in case the report listed above does not meet with your exact requirements. Our custom research will comprehensively cover the business information you require to help you arrive at strategic and profitable business decisions.

Request Customization

Instant Answers with GPT - Ask Now!

Ask real questions. Get complete answers !
Report Code
SE 3748
Published ON
Mar, 2023
Choose License Type
BUY NOW
  • SHARE
X
Request Customization
Speak to Analyst
Speak to Analyst
OR FACE-TO-FACE MEETING
PERSONALIZE THIS RESEARCH
  • Triangulate with your Own Data
  • Get Data as per your Format and Definition
  • Gain a Deeper Dive on a Specific Application, Geography, Customer or Competitor
  • Any level of Personalization
REQUEST A FREE CUSTOMIZATION
LET US HELP YOU!
  • What are the Known and Unknown Adjacencies Impacting the Flow Computer Market
  • What will your New Revenue Sources be?
  • Who will be your Top Customer; what will make them switch?
  • Defend your Market Share or Win Competitors
  • Get a Scorecard for Target Partners
CUSTOMIZED WORKSHOP REQUEST
+1-888-600-6441
  • Call Us
  • +1-888-600-6441 (Corporate office hours)
  • +1-888-600-6441 (US/Can toll free)
  • +44-800-368-9399 (UK office hours)
CONNECT WITH US
ABOUT TRUST ONLINE
©2024 MarketsandMarkets Research Private Ltd. All rights reserved
DMCA.com Protection Status Website Feedback