
Food & Agriculture Technology and Products Market by Industry (Animal, Agriculture, Cold Chain, Food & Beverage, and Cannabis), and Region (North America, Europe, Asia Pacific, Rest of the World) - Global Forecast to 2023
Market Segmentation
| Report Metrics | Details |
|
Market size available for years |
2018 - 2023 |
|
CAGR % |
8.1 |
Top 10 companies in Food & Agriculture Technology and Products Market
Food & Agriculture Technology and Products Market News
| Publish Date | Food & Agriculture Technology and Products Market Updates |
|---|---|
| 13-Apr-2024 | Food businesses turn to artificial intelligence |
| 13-Apr-2024 | Opinion: State ingredient bans undermining decades of food safety experience |
| 13-Apr-2024 | bp Boasts Food and Beverage Innovation |
| 13-Apr-2024 | Southwest Virginia Community College holds Spring Day of Service food packaging event |
| 12-Apr-2024 | Food and beverage sales to fall in 2023; processor margins to improve |
| 12-Apr-2024 | I Heart Mac & Cheese in Pueblo West serving up comfort food |
| 12-Apr-2024 | Tyson Foods (TSN) Rises More Than 20% in 6 Months: Here's How |
| 12-Apr-2024 | Retail inflation drops to 4.85% in March, down from 5.09% in February; Food and beverage prices decline |
| 12-Apr-2024 | Senoptica's food-waste-busting sensor technology gets FDA approval |
| 12-Apr-2024 | Globalization to Set the Table for U.S. Ethnic Food and Beverage M&A |


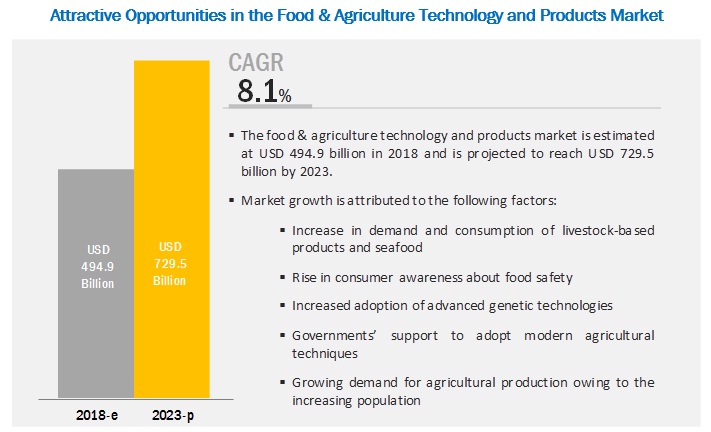
[298 Pages Report] The food & agriculture technology and products market is projected to grow from USD 494.9 billion in 2018 to USD 729.5 billion by 2023, at a CAGR of 8.1% during the forecast period. This is attributed to the increase in demand and consumption of livestock-based products and seafood, rise in consumer awareness about food safety, governments’ support to adopt modern agricultural techniques, and demand for agricultural production due to the increasing population are some of the major drivers for the growth of the market.
By subindustry, the cold chain segment is projected to account for the largest market share during the forecast period
The cold chain segment accounted for significant market size in the food & agriculture technology and products market in 2018. Cold chain technology restricts the growth of microbes and reduces the deterioration of perishable foods via refrigeration or freezing, thereby increasing the shelf life. Increased business networking relations between countries, higher consumer demand for perishable foods through online shopping, and greater flexibility for transporting perishable foods at the right time in developed economies are driving the growth of the cold chain market.
The agriculture segment is projected to witness the second-fastest growth in the food & agriculture technology and products market during the forecast period
On the basis of industry in the market, the agriculture industry is projected to be the second-fastest growing segment during the forecast period. This is due to the wide availability and usage of this equipment in almost every type of crop farming. Factors such as rising demand for food due to the increasing population and limited natural resources (water & land) have resulted in the advancement of agriculture products and technology. Additionally, the increasing consumer demand for pesticide- and herbicide-free food and the growing requirement to reduce the carbon footprint of traditional agricultural practices are projected to drive the agriculture segment.
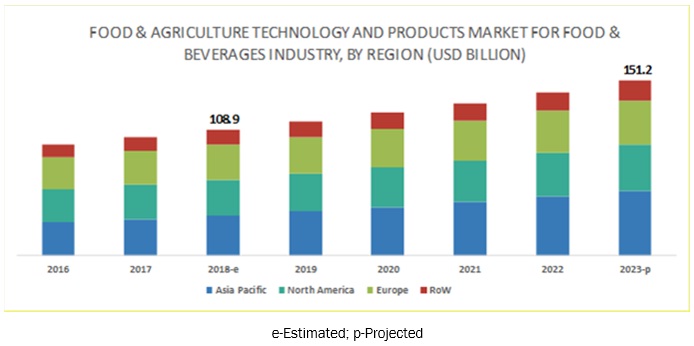
The Asia Pacific is projected to account for the largest market share in the food industry for the food & agriculture technology and products market during the forecast period.
The Asia Pacific market accounted for the largest share in the food & agriculture technology and products market. The large market share in this region is attributed to the increasing demand for processed food products as well as the rapid growth of the middle-class population. Moreover, a higher consumption rate of seafood and processed meat in the region, and higher consumption of proteins such as soy protein and its isolates in food such as functional dairy beverages, baked goods, snacks, and meat alternatives.
Key Market Players
The major vendors in the global food & agriculture technology and products market are ADM (US), Evonik (Germany), DSM (Netherlands), United Technologies (US), Deere & Company (US), Daikin (Japan), Signify Holdings (Netherlands), SGS SA (Switzerland), Zoetis (UK), GEA (Germany), Pentair (UK), Intertek (UK), Genus (UK), Neogen (US), AKVA Group (Norway), Eurofins (Luxembourg), Canopy Growth Corporation (Canada), Americold Logistics (US), Groupe Grimaud (France), and MosaMeat (Netherlands). These players have broad industry coverage and strong operational and financial strength; they have grown organically and inorganically in the recent past.
Get online access to the report on the World's First Market Intelligence Cloud
- Easy to Download Historical Data & Forecast Numbers
- Company Analysis Dashboard for high growth potential opportunities
- Research Analyst Access for customization & queries
- Competitor Analysis with Interactive dashboard
- Latest News, Updates & Trend analysis
Request Sample Scope of the Report
Get online access to the report on the World's First Market Intelligence Cloud
- Easy to Download Historical Data & Forecast Numbers
- Company Analysis Dashboard for high growth potential opportunities
- Research Analyst Access for customization & queries
- Competitor Analysis with Interactive dashboard
- Latest News, Updates & Trend analysis

|
Report Metric |
Details |
|
Market size available for years |
2016-2023 |
|
Market size for exceptional subindustries |
2019-2025 & 2021-2027 |
|
Base year considered |
2017 |
|
Forecast period |
2018-2023 |
|
Forecast period exceptional subindustries |
2021-2025 & 2022-2027 |
|
Forecast units |
Value (USD Billion & Million) & Volume (units & |
|
Segments covered |
Industry, and Region |
|
Geographies covered |
North America, Europe, Asia Pacific, and RoW |
|
Companies covered |
ADM (US), Evonik (Germany), DSM (Netherlands), United Technologies (US), Deere & Company (US), Daikin (Japan), Signify Holdings (Netherlands), SGS SA (Switzerland), Zoetis (UK), GEA (Germany), Pentair (UK), Intertek (UK), Genus (UK), Neogen (US), AKVA Group (Norway), Eurofins (Luxembourg), Canopy Growth Corporation (Canada), Americold Logistics (US), Groupe Grimaud (France), and MosaMeat (Netherlands). |
This research report categorizes the food & agriculture technology and products market based on industry, and region.
On the basis of industry, the food & agriculture technology and products market has been segmented as follows:
-
Animal industry
- Animal health
- Animal genetics
- Aquaculture products
-
Agriculture industry
- Indoor farming technology
- Smart agriculture technology
- Pre-harvest equipment
- Grow lights
- Autonomous tractors
-
Cold chain
- Refrigerated storage
- Refrigerated transport
-
Food & beverages
- Algae products
- Food safety technology
- Traceability technology
- Food & beverage processing equipment
- Cultured meat products
- Plant-based protein products
- Others
On the basis of region, the food & agriculture technology and products market has been segmented as follows:
- North America
- Europe
- Asia Pacific
- RoW (Africa, and the Middle East)
Key Questions addressed by the report:
- Who are the major market players in the food & agriculture technology and products market?
- What are the regional growth trends and the largest revenue-generating regions for the market?
- Which are the major regions for different industries that are projected to witness a significant growth for the food & agriculture technology and products market?
- What are the major industries of food & agriculture technology and products that are projected to gain maximum market revenue and share during the forecast period?
- What are the major subindustries of food & agriculture technology and products that are projected to gain maximum market revenue and share during the forecast period?
Frequently Asked Questions (FAQ):
Is farm management software included in the report?
Yes, following farm management software for following activities are included in the report:
- Precision farming
- Livestock monitoring
- Smart greenhouse
- Fish monitoring
- Others
What are the challenges included in the scope of food & agriculture technology & products market?
The major challenges included in this study are:
- High initial investment and recurring cost
- Stringent approval process for antimicrobial and antibodies
Are there any other related reports to cold chain?
Yes, we have following reports:
- Cold chain market
- Refrigerated Transport Systems market
For more, you can connect with us so that we
I want to understand the regulations in detail. I just want this part of the report.
Definitely, we can provide you the same, which may include regulations in below format:
-
North America
- US
- Canada
- Mexico
- Europe
- EU commission
-
APAC
- India
- Japan
*The details are provided on the basis of availability of data
To speak to our analyst for a discussion on the above findings, click Speak to Analyst
Table of Contents
1 Introduction (Page No. - 28)
1.1 Objectives of the Study
1.2 Market Definition
1.2.1 Animal Health
1.2.2 Agriculture
1.2.3 Food & Beverage
1.2.4 Cold Chain
1.2.5 Others (Cannabis Products)
1.3 Market Segmentation
1.4 Regions Covered for Animal
1.5 Regions Covered for Agriculture
1.6 Regions Covered for Food & Beverage for Cold Chain
1.7 Regions Covered for Others (Cannabis)
1.8 Periodization Considered
1.9 Currency Considered
1.10 Unit Considered
1.11 Stakeholders
2 Research Methodology (Page No. - 38)
2.1 Research Data
2.1.1 Secondary Data
2.1.1.1 Key Data From Secondary Sources
2.1.2 Primary Data
2.1.2.1 Key Data From Primary Sources
2.1.2.2 Key Data From Primary Sources
2.2 Market Size Estimation
2.2.1 Bottom-Up Approach
2.2.2 Top-Down Approach
2.3 Data Triangulation
2.4 Assumptions for the Study
2.5 Limitations of the Study
3 Executive Summary (Page No. - 48)
4 Premium Insights (Page No. - 52)
4.1 Attractive Opportunities in the Food & Agriculture Technology and Products Market
4.2 Animal Industry, By Region
4.3 Agriculture Industry, By Region
4.4 Cold Chain Industry, By Region
4.5 Food & Beverage Industry, By Region
4.6 Others, By Region
5 Market Overview (Page No. - 56)
5.1 Introduction
5.2 Market Dynamics
5.3 Drivers
5.3.1 Increase in Demand and Consumption of Livestock-Based Products and Seafood
5.3.2 Increased Adoption of Advanced Genetic Technologies
5.3.3 Rise in Consumer Awareness About Food Safety
5.3.4 Increase in Demand for Convenience, Packaged, and Processed Food Products
5.3.5 Governments’ Support to Adopt Modern Agricultural Techniques
5.3.6 Growing Demand for Agricultural Production Owing to the Increasing Population
5.3.7 Increasing Need for Temperature Control to Prevent Potential Health Hazards
5.3.8 Increase in the Legalization of Cannabis
5.4 Restraints
5.4.1 Overall Fragmented Agriculture Industry
5.4.2 Restrictions on the Use of Parasiticides in Food-Producing Animals and Ban on Antibiotics in Different Nations
5.4.3 Lack of Coordination Between Market Stakeholders and Improper Enforcement of Regulatory Laws & Supporting Infrastructure in Developing Countries
5.4.4 High Energy and Infrastructure Cost
5.4.5 Complex Regulatory Structure for the Use of Cannabis
5.5 Opportunities
5.5.1 Untapped Market Potential and Emerging Regional Markets
5.5.2 Advent of Big Data in Agricultural Farms
5.5.3 Increasing Foreign Direct Investments in Emerging Markets
5.5.4 Product Development Via Research and Novel Product Delivery Solutions
5.6 Challenges
5.6.1 High Initial Investment and Recurring Cost
5.6.2 Lack of Infrastructural Support in Emerging Markets and of Skilled Resources in Developed Markets
5.6.3 Declining Prices as the Product Gets Commoditized
5.6.4 Stringent Approval Process for Antimicrobials and Antibiotics
6 Food & Agriculture Technology and Products Market, By Industry (Page No. - 71)
6.1 Introduction
6.2 Animal
6.2.1 Animal Genetics
6.2.1.1 High Demand for Superior Breeds is Driving the Market for Animal Genetics
6.2.2 Animal Health
6.2.2.1 Rising Demand for Animal-Derived Food Products
6.2.3 Aquaculture Products
6.2.3.1 Increasing Seafood Trade Propelling the Demand for Aquaculture Products
6.3 Agriculture
6.3.1 Indoor Farming Technology
6.3.1.1 Need for Higher Yields, Using Limited Space and Water
6.3.2 Smart Agriculture Technology
6.3.2.1 Increasing Adoption of the Internet of Things (IoT) and Artificial Intelligence
6.3.2.2 Farm Management Software
6.3.2.2.1 Focus on Livestock Monitoring & Disease Detection to Improve the Efficiency of Farming
6.3.2.2.2 Precision Farming
6.3.2.2.2.1 Increasing Focus on Farm Productivity
6.3.2.2.3 Livestock Monitoring
6.3.2.2.3.1 Awareness About the Importance of Animal Health and Hygiene
6.3.2.2.4 Smart Greenhouse
6.3.2.2.4.1 Government Support to Adopt Modern Agriculture Technology
6.3.2.2.5 Fish Monitoring
6.3.2.2.5.1 Increasing Implementation of Technologies in Fish Farming
6.3.2.2.6 Others
6.3.2.2.6.1 Growth of Horticulture and Forestry
6.3.3 Pre-Harvest Equipment
6.3.3.1 Primary Tillage Equipment
6.3.3.1.1 Awareness About Soil Health for Long-Term Sustainability
6.3.3.2 Secondary Tillage Equipment
6.3.3.2.1 Conservation of Soil Moisture to Enhance Yield
6.3.3.3 Planting Equipment
6.3.3.3.1 Higher Yield With the Use of Seed Drill
6.3.3.4 Irrigation Equipment
6.3.3.4.1 Rapid Demand for Cereals Crop
6.3.3.5 Plant Protection Equipment
6.3.3.5.1 Increasing Focus on Reducing Crop Losses Due to Pests & Insects
6.3.3.6 Other Equipment
6.3.3.6.1 Rising Concerns About Weed and Evaporation Reduction From the Soil
6.3.4 Grow Lights
6.3.4.1 Growth in Indoor Farming Practices
6.3.5 Autonomous Tractors
6.3.5.1 Growth in the Trend of Mechanization in the Agricultural Industry
6.4 Cold Chain
6.4.1 Refrigerated Storage
6.4.1.1 Increasing Need for Temperature-Controlled Storage to Prevent Potential Health Hazards
6.4.2 Refrigerated Transport
6.4.2.1 Growing Consumer Demand for Perishable Foods
6.5 Food & Beverages
6.5.1 Algae Products
6.5.1.1 Growth in Consumer Awareness About the Health Benefits of Algae-Based Products
6.5.2 Food Safety Technology
6.5.2.1 Incidences of Foodborne Illnesses are Driving the Market for Food Safety Technology
6.5.3 Traceability Technology
6.5.3.1 Ease of Product Recall and Growing Consumer Concerns About Food Safety are Driving the Market for Traceability Technology
6.5.4 Food & Beverage Processing Equipment
6.5.4.1 Growing Demand for Processed and Convenience Food
6.5.5 Plant-Based Protein Products
6.5.5.1 Increasing Consumer Awareness About Healthy Diets
6.5.6 Cultured Meat Products
6.5.6.1 Technological Advancements in Cellular Agriculture
6.6 Others (Cannabis)
7 Food & Agriculture Technology and Products Market in the Animal Industry, By Region (Page No. - 95)
7.1 Introduction
7.2 North America
7.2.1 US
7.2.1.1 Strong Investments are Made to Increase the Production Capacity of Livestock
7.2.2 Canada
7.2.2.1 Involvement of Veterinarians in Companion Animal Practices
7.3 Europe
7.3.1 Germany
7.3.1.1 Implementation of Advanced Technologies for Livestock Production
7.3.2 Spain
7.3.2.1 Domestic Consumption of Pork and Poultry Products is Significantly High in Spain
7.3.3 France
7.3.3.1 Domestic Demand for Meat Products Plays an Important Role in the Rise in Demand for Essential Animal Health Products
7.3.4 UK
7.3.4.1 Rise in Awareness About Companion Animal Healthcare Services
7.3.5 Italy
7.3.5.1 Demand for Poultry and Pork Meat has Increased Steadily in the Country
7.3.6 Rest of Europe
7.4 Asia Pacific
7.4.1 China
7.4.1.1 Advancements in the Feed Industry of the Country are Also Expected to Create A Demand for Superior-Quality Animal Health Products
7.4.2 Japan
7.4.2.1 Growth in Animal Healthcare Expenditure in the Country
7.4.3 India
7.4.3.1 Rise in Trend of Industrialization in the Animal Husbandry Sector
7.4.4 Rest of Asia Pacific
7.5 Rest of the World (RoW)
7.5.1 Latin America
7.5.2 Middle East & Africa
8 Food & Agriculture Technology and Products Market for the Agriculture Industry, By Region (Page No. - 115)
8.1 Introduction
8.2 North America
8.2.1 US
8.2.1.1 US is A Potential Market for Farming, Owing to the Continuous Demand for Agricultural Products
8.2.2 Canada
8.2.2.1 Increase in Farm Size Drives the Growth in Usage of Pre-Harvest Equipment
8.2.3 Mexico
8.2.3.1 The Government of Mexico is Taking Efforts to Promote Protected Horticulture in the Nation
8.3 Asia Pacific
8.3.1 China
8.3.1.1 The Chinese Government is Supporting the Farmers for Sustainable Use of Mechanization, and This Trend is Expected to Continue
8.3.2 Japan
8.3.2.1 Huge Opportunity for Autonomous Tractors in Japan
8.3.3 India
8.3.3.1 Agriculture Farm Mechanization is an Important Segment and Plays A Crucial Role in Agricultural Development
8.3.4 Australia
8.3.4.1 Increasing Benefits of Artificial Lighting are Encouraging Manufacturers in This Country to Design and Develop Efficient Grow Lights.
8.4 Europe
8.4.1 Germany
8.4.1.1 The Adoption Rate of Animal Tracking, Dairy Cattle Management, and Other Livestock Monitoring Technologies is High in Germany
8.4.2 France
8.4.2.1 France Witnessed Remarkable Developments in the Adoption of New Agricultural Technologies
8.4.3 Spain
8.4.3.1 Adoption of Agriculture Equipment By the Farmers is High
8.4.4 Italy
8.4.4.1 Smart Agriculture Technology Projected to Be the Fastest-Growing Segment
8.4.5 UK
8.4.5.1 Increase in Awareness About the Advantages of Farm Mechanization Among Farmers
8.4.6 Netherlands
8.4.6.1 Key Exporter of Horticultural Produce in Europe
8.5 RoW
8.5.1 South America
8.5.1.1 Brazil, Argentina, and Chile in South America Hold High Potential for the Adoption of Smart Agricultural Technologies
8.5.2 Middle East & Africa
8.5.2.1 Rapid Technological Developments in Big Data Analytics and Cloud-Computing Platforms to Drive the Smart Agriculture Market
9 Food & Agriculture Technology and Products Market in Cold Chain Industry, By Region (Page No. - 142)
9.1 Introduction
9.2 North America
9.2.1 US
9.2.1.1 Shift in the Trend Toward Smaller and More Frequent Meals
9.2.2 Canada
9.2.2.1 Increase in Demand for Packaged Food Products
9.2.3 Mexico
9.2.3.1 Increase in the Trade of Perishable Food Products
9.3 Europe
9.3.1 Germany
9.3.1.1 Demand for Quality, Taste, and Freshness of Food are Affecting the Market for Frozen Foods
9.3.2 France
9.3.2.1 One of the Largest Markets in Europe for Frozen Fruits and Vegetables
9.3.3 UK
9.3.3.1 Consumers Spending on Premium and Healthy Food Items
9.3.4 Spain
9.3.4.1 Innovations and Technologies in the Cold Chain Industry
9.3.5 Italy
9.3.5.1 Growth in the Trend in Consumption of Natural Ingredients and Ingredients Perceived to Offer Health Benefits
9.3.6 Rest of Europe
9.4 Asia Pacific
9.4.1 China
9.4.1.1 Growth in Food Safety Concerns Among Consumers in the Country
9.4.2 Japan
9.4.2.1 The Rapid Expansion of Convenience Store Chains
9.4.3 India
9.4.3.1 The Rapid Expansion of QSRS has Increased the Demand for Refrigerated Storage of Food Products
9.4.4 Rest of Asia Pacific
9.5 RoW
9.5.1 South America
9.5.2 Middle East & Africa
10 Food & Agriculture Technology and Products Market for Food & Beverages Industry, By Region (Page No. - 155)
10.1 Ntroduction
10.2 North America
10.2.1 US
10.2.1.1 The Increasing Focus of Manufacturers to Achieve Processing Efficiency and Quick Turnaround Time to Drive the Food & Beverage Processing Equipment Market
10.2.2 Canada
10.2.2.1 Increasing Demand for Processed Food Products in the Country
10.2.3 Mexico
10.2.3.1 The Health Benefits Associated With Soybean is Projected to Drive the Growth of the Plant-Based Protein Products Market
10.3 Europe
10.3.1 Germany
10.3.1.1 Increase in Several Medium- and Large-Scale Companies Involved in the Production and Distribution of Food & Beverages
10.3.2 UK
10.3.2.1 The Growth of the Bakery Industry is Driving the Growth of the Food & Beverage Processing Equipment Market in the UK
10.3.3 France
10.3.3.1 Increase in Demand for Packaged Food, Especially Frozen Food Products
10.3.4 Italy
10.3.4.1 The Growing Focus of the Italian Government on the Food & Beverage Industry
10.3.5 Spain
10.3.5.1 Increase in Awareness Among Consumer About Food Safety
10.3.6 Rest of Europe
10.3.6.1 Increase in Demand for Advanced Machinery for Efficient Production
10.4 Asia Pacific
10.4.1 China
10.4.1.1 The Rise in Demand for Processed Food & Beverages in China
10.4.2 Japan
10.4.2.1 Increasing Demand and Consumption of Seafood and Processed Meat is Projected to Drive the Growth of Food & Beverage Processing Equipment Market in Japan
10.4.3 India
10.4.3.1 Increase Investments By Dairy Product Manufacturers
10.4.4 Rest of Asia Pacific
10.4.4.1 Increase in Demand for Advanced Machinery for Efficient Production
10.5 RoW
10.5.1 South America
10.5.1.1 Companies Engaged in the Manufacturing of Food & Beverage Processing Equipment are Expanding Their Presence in This Region
10.5.2 Middle East and Africa
10.5.2.1 Increase in Consumer Preferences for Processed Meat, Bakery, Confectionery, and Beverage Products
11 Food & Agriculture Technology and Products Market for the Cannabis Industry, By Region (Page No. - 192)
11.1 Introduction
11.2 North America
11.2.1 US
11.2.1.1 Increasing Legalization of Both Medical and Recreational Cannabis in Several States to Drive the Market in the Us
11.2.2 Canada
11.2.2.1 Legalization of Recreational Cannabis to Drive the Market in Canada
11.2.3 Mexico
11.2.3.1 Legalization of Medical Cannabis to Drive the Mexican Market
11.3 South America
11.3.1 Chile
11.3.1.1 Increasing Awareness Among Consumers About the Benefits of Medical Cannabis in the Treatment of Chronic Pain, Seizures, and Nausea is Driving the Market in Chile
11.3.2 Colombia
11.3.2.1 A High Percentage of Population Suffering From Chronic Diseases is Driving the Colombian Cannabis Market
11.3.3 Uruguay
11.3.3.1 The Fully Legalized Cannabis Industry With Eased Regulations is Driving the Market in Uruguay
11.3.4 Rest of South America
11.3.4.1 Legalization of Medical Cannabis is A Major Driver for the Market in Rest of South America
11.4 Europe
11.4.1 Germany
11.4.1.1 The Complete Health Insurance Coverage for the Use of Medical Cannabis is Driving the German Market
11.4.2 Italy
11.4.2.1 Increase in Demand for Cannabis Coupled With the Issuance of Import Licenses to Drive the Growth of the Italian Cannabis Market
11.4.3 France
11.4.3.1 The Increasing Use of Cannabis in the Healthcare Sector in France is Driving the Market Growth
11.4.4 The Netherlands
11.4.4.1 Strong Supporting Infrastructure of Pharmacies is Driving the Market in the Netherlands
11.4.5 Rest of Europe
11.4.5.1 Legalization of Medical Cannabis is A Major Driver for the Market in Rest of Europe
11.5 Rest of the World (RoW)
11.5.1 Israel
11.5.1.1 Agricultural & Technical Innovations Coupled With Liberal Government Policies to Drive the Market in Israel
11.5.2 Australia
11.5.2.1 Improved Access to Medical Cannabis is Projected to Drive the Market in Australia
12 Competitive Landscape (Page No. - 202)
12.1 Overview
12.2 Competitive Scenario
12.3 Expansions & Investments
12.4 Acquisitions
12.5 Agreements, Collaborations, Joint Ventures, and Partnerships
12.6 New Product Launches
13 Company Profiles (Page No. - 209)
(Business Overview, Products Offered, Recent Developments, SWOT Analysis, MnM View)*
13.1 ADM
13.2 United Technologies (Carrier Corporation)
13.3 John Deere
13.4 Daikin Industries
13.5 Evonik
13.6 DSM
13.7 Signify Holding
13.8 SGS SA
13.9 Zoetis
13.10 Eurofins
13.11 GEA
13.12 Pentair
13.13 Intertek
13.14 Genus
13.15 Neogen Corporation
13.16 Akva Group
13.17 Canopy Growth Corporation
13.18 Americold Logistics
13.19 Groupe Grimaud
13.20 Mosameat
*Details on Business Overview, Products Offered, Recent Developments, SWOT Analysis, MnM View Might Not Be Captured in Case of Unlisted Companies
14 Appendix (Page No. - 290)
14.1 Discussion Guide
14.2 Knowledge Store: Marketsandmarkets’ Subscription Portal
14.3 Related Reports
14.4 Author Details
List of Tables (153 Tables)
Table 1 US Dollar Exchange Rates Considered, 2015–2018
Table 2 Food & Agriculture Technology and Products Market Snapshot, 2018 vs 2023
Table 3 Animal Industry Market Size, By Subindustry, 2016–2023 (USD Million)
Table 4 Animal Genetics Market Size, By Region, 2016–2023 (USD Million)
Table 5 Animal Health Market Size, By Region, 2016–2023 (USD Million)
Table 6 Aquaculture Products Market Size, By Region, 2016–2023 (USD Million)
Table 7 Agriculture Industry Market Size, By Subindustry, 2016–2023 (USD Million)
Table 8 Indoor Farming Technology Market Size, By Region, 2016–2023 (USD Million)
Table 9 Smart Agriculture Technology Market Size, By Region, 2016–2023 (USD Million)
Table 10 Farm Management Software Market, By Agriculture Type, 2016–2023 (USD Million)
Table 11 Precision Farming Market, By Offering, 2016–2023 (USD Million)
Table 12 Pre-Harvest Equipment Market Size, By Region, 2016–2023 (USD Million)
Table 13 Pre-Harvest Equipment Market Size, By Type, 2016–2023 (USD Million)
Table 14 Grow Lights Market Size, By Region, 2016–2023 (USD Million)
Table 15 Autonomous Tractors Market Size, By Region, 2019–2025 (Units)
Table 16 Autonomous Tractors Market Size, By Region, 2019–2025 (USD Million)
Table 17 Cold Chain Market Size, By Region, 2016–2023 (USD Million)
Table 18 Refrigerated Storage Room Classification and Temperature Ranges
Table 19 Refrigerated Storage Market Size, By Region, 2016–2023 (Million Cubic Meters)
Table 20 Refrigerated Transport Market Size, By Region, 2016–2023 (Units)
Table 21 Food & Beverage Industry Market Size, By Subindustry, 2016–2023 (USD Million)
Table 22 Food & Beverage Industry Market Size, By Subindustry, 2021–2027 (USD’000)
Table 23 Algae Products Market Size, By Region, 2016–2023 (USD Million)
Table 24 Food Safety Technology Market Size, By Region, 2016–2023 (USD Million)
Table 25 Traceability Technology Market Size, By Region, 2016–2023 (USD Million)
Table 26 Food & Beverage Processing Equipment Market Size, By Region, 2016–2023 (USD Million)
Table 27 Plant-Based Protein Products Market Size, By Region, 2016–2023 (USD Million)
Table 28 Cultured Meat Market Size, By Region, 2021-2027 (USD’000)
Table 29 Cannabis Market Size, By Region, 2016–2023 (USD Million)
Table 30 Food & Agriculture Technology and Products Market Size in Animal Industry, By Region, 2016–2023 (USD Million)
Table 31 North America: Food & Agriculture Technology and Products Market Size in Animal Industry, By Country, 2016–2023 (USD Million)
Table 32 North America: By Market Size in Animal Industry, By Subindustry, 2016–2023 (USD Million)
Table 33 US: By Market Size in Animal Industry, By Subindustry, 2016–2023 (USD Million)
Table 34 Canada: By Market Size in Animal Industry, By Subindustry, 2016–2023 (USD Million)
Table 35 Europe: Food & Agriculture Technology and Products Market Size in Animal Industry, By Country, 2016–2023 (USD Million)
Table 36 Europe: By Market Size in Animal Industry, By Subindustry, 2016–2023 (USD Million)
Table 37 Germany: By Market Size in Animal Industry, By Subindustry, 2016–2023 (USD Million)
Table 38 Spain: By Market Size in Animal Industry, By Subindustry, 2016–2023 (USD Million)
Table 39 France: By Market Size in Animal Industry, By Subindustry, 2016–2023 (USD Million)
Table 40 UK: By Market Size in Animal Industry, By Subindustry , 2016–2023 (USD Million)
Table 41 Italy: By Market Size in Animal Industry, By Subindustry, 2016–2023 (USD Million)
Table 42 Rest of Europe: Food & Agriculture Technology and Products Market Size in Animal Industry, By Subindustry, 2016–2023 (USD Million)
Table 43 Asia Pacific: Food & Agriculture Technology and Products Market Size in Animal Industry, By Country, 2016–2023 (USD Million)
Table 44 Asia Pacific: By Market Size in Animal Industry, By Subindustry, 2016–2023 (USD Million)
Table 45 China: By Market Size in Animal Industry, By Subindustry, 2016–2023 (USD Million)
Table 46 Japan: By Market Size in Animal Industry, By Subindustry, 2016–2023 (USD Million)
Table 47 India: By Market Size in Animal Industry, By Subindustry, 2016–2023 (USD Million)
Table 48 Rest of Asia Pacific: By Market Size in Animal Industry, By Subindustry, 2016–2023 (USD Million)
Table 49 RoW: Food & Agriculture Technology and Products Market Size in Animal Industry, By Region, 2016–2023 (USD Million)
Table 50 RoW: Food & Agriculture Technology and Products Market Size in Animal Industry, By Subindustry, 2016–2023 (USD Million)
Table 51 Latin America: By Market Size in Animal Industry, By Subindustry, 2016–2023 (USD Million)
Table 52 Middle East & Africa: By Market Size in Animal Industry, By Subindustry, 2016–2023 (USD Million)
Table 53 Food & Agriculture Technology and Products Market Size in the Agriculture Industry, By Region, 2016–2023 (USD Billion)
Table 54 Autonomous Tractors Market Size, By Region, 2019–2025 (USD Million)
Table 55 North America: Food & Agriculture Technology and Products Market Size in the Agriculture Industry, By Country, 2016–2023 (USD Million)
Table 56 North America: Autonomous Tractors Market Size, By Country, 2019–2025 (Units)
Table 57 North America: By Market Size in the Agriculture Industry, By Subindustry, 2016–2023 (USD Million)
Table 58 North America: By Market Size in the Agriculture Industry, By Subindustry, 2019–2025 (USD Million)
Table 59 US: By Size in the Agriculture Industry, By Subindustry, 2016–2023 (USD Million)
Table 60 US: By Market Size in the Agriculture Industry, By Subindustry, 2019–2025 (Units)
Table 61 Canada: Food & Agriculture Technology and Products Market Size in the Agriculture Industry, By Subindustry, 2016–2023 (USD Million)
Table 62 Canada: By Market Size in the Agriculture Industry, By Subindustry, 2019–2025 (Units)
Table 63 Mexico: Food & Agriculture Technology and Products Market Size in the Agriculture Industry, By Subindustry, 2016–2023 (USD Million)
Table 64 Mexico: By Market Size in the Agriculture Industry, By Subindustry, 2019–2025 (Units)
Table 65 Asia Pacific: By Market Size in the Agriculture Industry, By Subindustry, 2016–2023 (USD Million)
Table 66 Asia Pacific: Food & Agriculture Technology and Products Market Size in the Agriculture Industry, By Subindustry, 2019–2025 (USD Million)
Table 67 China: By Market Size in the Agriculture Industry, By Subindustry, 2016–2023 (USD Million)
Table 68 China: By Market Size in the Agriculture Industry, By Subindustry, 2019–2025 (Units)
Table 69 Japan: By Market Size in the Agriculture Industry, By Subindustry, 2016–2023 (USD Million)
Table 70 Japan: By Market Size in the Agriculture Industry, By Subindustry, 2019–2025 (Units)
Table 71 India: Food & Agriculture Technology and Products Market Size in the Agriculture Industry, By Subindustry, 2016–2023 (USD Million)
Table 72 India: By Market Size in the Agriculture Industry, By Subindustry, 2019–2025 (Units)
Table 73 Australia: By Market Size in the Agriculture Industry, By Subindustry, 2016–2023 (USD Million)
Table 74 Europe: By Market Size in the Agriculture Industry, By Subindustry, 2016–2023 (USD Million)
Table 75 Europe: Food & Agriculture Technology and Products Market Size in the Agriculture Industry, By Subindustry, 2019–2025 (USD Million)
Table 76 Germany: Food & Agriculture Technology and Products Market Size in the Agriculture Industry, By Subindustry, 2016–2023 (USD Million)
Table 77 Germany: By Market Size in the Agriculture Industry, By Subindustry, 2019–2025 (Units)
Table 78 France: Food & Agriculture Technology and Products Market Size in the Agriculture Industry, By Subindustry, 2016–2023 (USD Million)
Table 79 France: By Market Size in the Agriculture Industry, By Subindustry, 2019–2025 (Units)
Table 80 Spain: Food & Agriculture Technology and Products Market Size in the Agriculture Industry, By Subindustry, 2016–2023 (USD Million)
Table 81 Italy: Food & Agriculture Technology and Products Market Size in the Agriculture Industry, By Subindustry, 2016–2023 (USD Million)
Table 82 Italy: By Market Size in the Agriculture Industry, By Subindustry, 2019–2025 (Units)
Table 83 UK: Food & Agriculture Technology and Products Market Size in the Agriculture Industry, By Subindustry, 2016–2023 (USD Million)
Table 84 UK: By Market Size in the Agriculture Industry, By Subindustry, 2019–2025 (Units)
Table 85 Netherlands: Food & Agriculture Technology and Products Market Size in the Agriculture Industry, By Subindustry, 2016–2023 (USD Million)
Table 86 RoW: Food & Agriculture Technology and Products Market Size in the Agriculture Industry, By Subindustry, 2016–2023 (USD Million)
Table 87 RoW: By Market Size in the Agriculture Industry, By Subindustry, 2019–2025 (USD Million)
Table 88 South America: Food & Agriculture Technology and Products Market Size in the Agriculture Industry, By Subindustry, 2016–2023 (USD Million)
Table 89 South America: Food & Agriculture Technology and Products Market Size in the Agriculture Industry, By Subindustry, 2019–2025 (Units)
Table 90 Middle East & Africa: Food & Agriculture Technology and Products Market Size in the Agriculture Industry, By Subindustry, 2016–2023 (USD Million)
Table 91 Food & Agriculture Technology and Products Market Size Market Size in Cold Chain Industry, By Region, 2016–2023 (USD Billion)
Table 92 Food & Agriculture Technology and Products Market Size Market Size in Refrigerated Storage, By Region, 2016–2023 (Million Cubic Meter)
Table 93 Food & Agriculture Technology and Products Market Size Market Size in Refrigerated Transport, By Region, 2016–2023 (Unit)
Table 94 North America: Food & Agriculture Technology and Products Market Size Market Size in Refrigerated Storage, By Country, 2016–2023 (Million Cubic Meter)
Table 95 North America: By Market Size Market Size in Refrigerated Transport, By Country, 2016–2023 (Unit)
Table 96 Europe: By Market Size Market Size in Refrigerated Storage, By Country, 2016–2023 (Million Cubic Meter)
Table 97 Europe: By Market Size Market Size in Refrigerated Transport, By Country, 2016–2023 (Unit)
Table 98 Asia Pacific: By Market Size Market Size in Refrigerated Storage, By Country, 2016–2023 (Million Cubic Meter)
Table 99 Asia Pacific: Food & Agriculture Technology and Products Market Size Market Size in Refrigerated Transport, By Country, 2016–2023 (Unit)
Table 100 RoW: Food & Agriculture Technology and Products Market Size Market Size in Refrigerated Storage, By Region, 2016–2023 (Million Cubic Meter)
Table 101 RoW: By Market Size Market Size in Refrigerated Transport, By Region, 2016–2023 (Unit)
Table 102 Food & Agriculture Technology and Products Market Size in the Food & Beverage Industry, By Region, 2016–2023 (USD Billion)
Table 103 Normal Scenario: Cultured Meat Products Market Size, By Region, 2021–2027 (USD Thousand)
Table 104 North America: Food & Agriculture Technology and Products Market Size in the Food & Beverages Industry, By Country, 2016–2023 (USD Million)
Table 105 North America: Cultured Meat Products Market Size, By Country, 2021–2027 (USD Thousand)
Table 106 North America: By Market Size in the Food & Beverages Industry, By Subindustry, 2016–2023 (USD Million)
Table 107 North America: By Market Size in the Food & Beverages Industry, By Subindustry, 2021–2027 (USD Thousand)
Table 108 US: By Market Size in the Food & Beverages Industry, By Subindustry, 2016–2023 (USD Million)
Table 109 US: By Market Size in the Food & Beverages Industry, By Subindustry, 2021–2027 (USD Thousand)
Table 110 Canada: By Market Size in the Food & Beverages Industry, By Subindustry, 2016–2023 (USD Million)
Table 111 Canada: Food & Agriculture Technology and Products Market Size in the Food & Beverages Industry, By Subindustry, 2021–2027 (USD Thousand)
Table 112 Mexico: By Market Size in the Food & Beverages Industry, By Type, 2016–2023 (USD Million)
Table 113 Europe: By Size in the Food & Beverages Industry, By Country, 2016–2023 (USD Million)
Table 114 Europe: Cultured Meat Products Market Size, By Country, 2021–2027 (USD Thousand)
Table 115 Europe: By Market Size in the Food & Beverages Industry, By Subindustry, 2016–2023 (USD Million)
Table 116 Europe: By Market Size in the Food & Beverages Industry, By Subindustry, 2021–2027 (USD Thousand)
Table 117 Germany: Food & Agriculture Technology and Products Market Size in the Food & Beverages Industry, By Subindustry, 2016–2023 (USD Million)
Table 118 Germany: By Market Size in the Food & Beverages Industry, By Subindustry, 2021–2027 (USD Thousand)
Table 119 UK: Food & Agriculture Technology and Products Market Size in the Food & Beverages Industry, By Subindustry, 2016–2023 (USD Million)
Table 120 UK: By Market Size in the Food & Beverages Industry, By Subindustry, 2021–2027 (USD Thousand)
Table 121 France: Food & Agriculture Technology and Products Market Size in the Food & Beverages Industry, By Subindustry, 2016–2023 (USD Million)
Table 122 Italy: By Market Size in the Food & Beverages Industry, By Subindustry, 2016–2023 (USD Million)
Table 123 Spain: By Market Size in the Food & Beverages Industry, By Subindustry, 2016–2023 (USD Million)
Table 124 Rest of Europe: Food & Agriculture Technology and Products Market Size in the Food & Beverages Industry, By Subindustry, 2016–2023 (USD Million)
Table 125 Rest of Europe: Food & Agriculture Technology and Products Market Size in the Food & Beverages Industry, By Subindustry, 2021–2027 (USD Thousand)
Table 126 Asia Pacific: Food & Agriculture Technology and Products Market Size in the Food & Beverages Industry, By Country, 2016–2023 (USD Million)
Table 127 Asia Pacific: Cultured Meat Products Market Size, By Country, 2021–2027 (USD Thousand)
Table 128 Asia Pacific: Food & Agriculture Technology and Products Market Size in the Food & Beverages Industry, By Subindustry, 2016–2023 (USD Million)
Table 129 Asia Pacific: Food & Agriculture Technology and Products Market Size in the Food & Beverages Industry, By Subindustry, 2021–2027 (USD Thousand)
Table 130 China: By Market Size in the Food & Beverages Industry, By Subindustry, 2016–2023 (USD Million)
Table 131 China: Food & Agriculture Technology and Products Market Size in the Food & Beverages Industry, By Subindustry, 2021–2027 (USD Thousand)
Table 132 Japan: By Market Size in the Food & Beverages Industry, By Subindustry, 2016–2023 (USD Million)
Table 133 Japan: By Market Size in the Food & Beverages Industry, By Subindustry, 2021–2027 (USD Thousand)
Table 134 India: By Market Size in the Food & Beverages Industry, By Type, 2016–2023 (USD Million)
Table 135 Rest of Asia Pacific: Food & Agriculture Technology and Products Market Size in the Food & Beverages Industry, By Type, 2016–2023 (USD Million)
Table 136 Rest of APAC: By Market Size in the Food & Beverages Industry, By Subindustry, 2021–2027 (USD Thousand)
Table 137 RoW: Food & Agriculture Technology and Products Market Size in the Food & Beverages Industry, By Region, 2016–2023 (USD Million)
Table 138 RoW: Cultured Meat Products Market Size, By Region, 2021–2027 (USD Thousand)
Table 139 RoW: Food & Agriculture Technology and Products Market Size in the Food & Beverages Industry, By Subindustry, 2016–2023 (USD Million)
Table 140 RoW: By Market Size in the Food & Beverages Industry, By Subindustry, 2021–2027 (USD Thousand)
Table 141 South America: Food & Agriculture Technology and Products Market Size in the Food & Beverages Industry, By Subindustry, 2016–2023 (USD Million)
Table 142 South America: By Market Size in the Food & Beverages Industry, By Subindustry, 2021–2027 (USD Thousand)
Table 143 Middle East & Africa: By Market Size in the Food & Beverages Industry, By Subindustry, 2016–2023 (USD Million)
Table 144 Middle East & Africa: By Market Size in the Food & Beverages Industry, By Subindustry, 2021–2027 (USD Thousand)
Table 145 Cannabis Market Size, By Region, 2016–2023 (USD Million)
Table 146 North America: Cannabis Market Size, By Country, 2016–2023 (USD Million)
Table 147 South America: Cannabis Market Size, By Country, 2016–2023 (USD Million)
Table 148 Europe: Cannabis Market Size, By Country, 2016–2023 (USD Million)
Table 149 RoW: Cannabis Market Size, By Country, 2016-2023 (USD Million)
Table 150 Expansions & Investments, 2014–2019
Table 151 Aquisitions, 2014–2019
Table 152 Agreements, Collaboration, Joint Ventures, and Partnerships, 2014–2019
Table 153 New Product Launches, 2014–2019
List of Figures (44 Figures)
Figure 1 Food & Agriculture Technology and Products Market: Research Design
Figure 2 Food & Agriculture Technology and Products Market: Bottom-Up Approach
Figure 3 Food & Agriculture Technology and Products Market: Top-Down Approach
Figure 4 Data Triangulation Methodology
Figure 5 Food & Agriculture Technology and Products Market Size, By Key Market, 2018 vs 2023 (USD Billion)
Figure 6 Asia Pacific & Europe: Food & Agriculture Technology & Products Market, 2017
Figure 7 Focus on Animal Health, Innovation in Food & Agricultural Technology, and Consumer Demand for Health-Benefiting Products and Ingredients
Figure 8 Asia Pacific Accounted for the Largest Share in the Animal Industry (USD Billion)
Figure 9 Europe to Dominate the Agriculture Industry (USD Billion)
Figure 10 Asia Pacific to Dominate the Cold Chain Industry By 2023 (USD Billion)
Figure 11 Asia Pacific Region is Projected to Grow at the Highest CAGR in the Food & Beverage Industry (USD Billion)
Figure 12 North America to Be the Largest Market for Others (Cannabis Products) (USD Million)
Figure 13 Food & Agriculture Technology and Products Market Dynamics
Figure 14 Major Meat Producing Regions/Countries (Thousand Tonnes)
Figure 15 Major Bovine Meat Producing Regions/Countries (Thousand Tonnes)
Figure 16 Major Swine Meat Producing Regions/Countries (Thousand Tonnes)
Figure 17 Major Poultry Meat Producing Regions/Countries (Thousand Tonnes)
Figure 18 Animal-Based Product Consumption, By Commodity, 1967–2030 (Million Tons)
Figure 19 Fisheries and Aquaculture Production (Million Tonnes)
Figure 20 Europe: Market for Food & Agricultural Technology and Products in the Animal Industry Snapshot
Figure 21 Asia Pacific: Market for Food & Agricultural Technology and Products in the Animal Industry Snapshot
Figure 22 North America: Food & Agriculture Technology and Products Market Snapshot for the Food & Beverages Industry
Figure 23 Asia Pacific: Food & Agriculture Technology and Products Market Snapshot for the Food & Beverages Industry
Figure 24 Key Developments By Leading Players in Food & Agricultura Technology & Products Market, 2014-2019
Figure 25 Number of Developments Between 2018 and 2016
Figure 26 ADM: Company Snapshot
Figure 27 ADM: SWOT Analysis
Figure 28 United Technologies: Company Snapshot
Figure 29 Deere & Company: Company Snapshot
Figure 30 Daikin Industries: Company Snapshot
Figure 31 Evonik: Company Snapshot
Figure 32 Evonik: SWOT Analysis
Figure 33 DSM: Company Snapshot
Figure 34 Signify Holding: Company Snapshot
Figure 35 SGS SA: Company Snapshot
Figure 36 Zoetis: Company Snapshot
Figure 37 Eurofins: Company Snapshot
Figure 38 GEA: Company Snapshot
Figure 39 Pentair: Company Snapshot
Figure 40 Intertek: Company Snapshot
Figure 41 Genus: Company Snapshot
Figure 42 Neogen Corporation: Company Snapshot
Figure 43 Akva Group: Company Snapshot
Figure 44 Canopy Growth Corporation: Company Snapshot
The study involved four major activities in estimating the current market size for the food & agriculture technology and products market. Exhaustive secondary research was done to collect information on the market as well as the parent market. The next step was to validate these findings, assumptions, and sizing with industry experts across the value chain through primary research. Both the top-down and bottom-up approaches were employed to estimate the complete market size. Thereafter, market breakdown and data triangulation were used to estimate the market size of segments and subsegments.
Secondary Research
In the secondary research process, various sources were referred to, so as to identify and collect information for this study. These secondary sources included reports from the Food and Agriculture Organization (FAO), United States Department of Agriculture (USDA), European Food Safety Authority (EFSA), European Association of Specialty Feed Ingredients and their Mixtures (FEFANA), Animal Nutrition Association of Canada (ANAC), the International Association for Food Protection (IAFP), European Algae Biomass Association (EABA), and National Centre for Cold Chain Development (NCCD), which were referred to, to identify and collect information for this study. The secondary sources also included annual reports, press releases, investor presentations of companies, white papers, certified publications, articles by recognized authors and regulatory bodies, trade directories, and databases.
Secondary research was mainly used to obtain key information about the industry’s supply chain, the total pool of key players, market classification & segmentation according to industry trends to the bottom-most level and geographical markets. It was also used to obtain information about the key developments from a market-oriented perspective.
Primary Research
The overall food & agriculture technology and products market comprise several stakeholders in the supply chain, which include raw material suppliers and manufacturers. Various primary sources from both the supply and demand sides of the market were interviewed to obtain qualitative and quantitative information. The primary interviewees from the demand side include food & beverage companies, agricultural products & equipment companies, chief information officers, end users such as agricultural crop producers, veterinarians, livestock producers, and personnel from animal-derived food product industry, key food processors, seafood companies, animal husbandry companies, large-scale ranches, poultry farms, and researchers. The primary sources from the supply side include food & feed producers, R&D and technology experts in the agricultural machinery industry, key companies and organizations operating in the smart agriculture segment, animal parasiticide manufacturers, personnel from veterinary pharmaceutical companies, laboratory consumable manufacturers, food diagnostic kit & reagent manufacturers, researchers, equipment and instrument manufacturers, testing laboratory service providers, warehouse/cold storage owners, refrigeration & cold chain equipment, and refrigeration solution providers.
To know about the assumptions considered for the study, download the pdf brochure
Market Size Estimation
Both the top-down and bottom-up approaches were used to estimate and validate the total size of the food & agriculture technology and products market. These approaches were also used extensively to estimate the size of various subsegments in the market. The research methodology used to estimate the market size includes the following details:
- The key players were identified through extensive secondary research.
- The animal, agriculture, cold chain, food & beverages, and cannabis industry’s value chain and market size, in terms of value, were determined through primary and secondary research.
- All percentage share splits and breakdowns were determined using secondary sources and verified through primary sources.
- All the possible parameters that affect the market covered in this research study were accounted for, viewed in extensive detail, verified through primary research, and analyzed to obtain the final quantitative and qualitative data.
Data Triangulation
After arriving at the overall market size from the estimation process explained above, the total market was split into several segments and subsegments. In order to estimate the overall food & agriculture technology and products market and arrive at the exact statistics for all segments and subsegments, the data triangulation and market breakdown procedures were employed wherever applicable. The data was triangulated by studying various factors and trends from the demand and supply sides. Along with this, the market size was validated using both the top-down and bottom-up approaches.
Report Objectives
- Determining and projecting the size of the food & agriculture technology and products market, with respect to the industry and regions, over a five-year period ranging from 2018 to 2023
- Identifying attractive opportunities in the market by determining the largest and fastest-growing segments across regions
- Providing detailed information about the key factors influencing the growth of the market (drivers, restraints, opportunities, and industry-specific challenges)
- Analyzing the micromarkets, with respect to individual growth trends, future prospects, and their contribution to the total market
- Identifying and profiling key market players in the food & agriculture technology and products market
-
Providing a comparative analysis of the market leaders on the basis of the following:
- Product & service offerings
- Business strategies
- Strengths and weaknesses
- Key financials
- Understanding the competitive landscape and identifying the major growth strategies adopted by players across the key regions
- Providing insights into key product innovations and investments in the food & agriculture technology and products market
Company Information
- Analyses and profiling of additional market players (up to five)


Growth opportunities and latent adjacency in Food & Agriculture Technology and Products Market