
Food Processing Ingredients Market by Type (Modified Starch & Starch Derivatives, Proteins, Food Stabilizers, Emulsifiers, Yeast, Enzymes, Acidity Regulators, Antioxidants, and Release Agents), Form, Source, Application, and Region - Global Forecast to 2023
Market Segmentation
| Report Metrics | Details |
|
Market size available for years |
2018 - 2023 |
|
CAGR % |
6.2 |
Top 10 companies in Food Processing Ingredients Market
Food Processing Ingredients Market News


[195 Pages Report] The food processing ingredients market was valued at USD 39.16 Billion in 2017; this is projected to reach USD 55.99 Billion by 2023, at a CAGR of 6.2% during the forecast period. The rapid growth in demand for processed food, additional health benefits of food processing ingredients, and positive growth trend in alcoholic beverage consumption are the factors driving this market.
For More details on this research, Request Free Sample Report
The periodization considered for the study is as follows:
- Base year: 2017
- Forecast period: 2018 to 2023
The objectives of the report
- Determining and projecting the size of the market with respect to type, form, source, application, and regional markets, over a five-year period ranging from 2018 to 2023
- Identifying attractive opportunities in the market by determining the largest and fastest-growing segments across regions
- Analyzing the further segments and subsegments of the global food processing ingredients market included in the report with respect to individual growth trends, future prospects, and their contribution to the global market
- Identifying and profiling the key players in the market
- Determining the ranking of key players operating in the market
-
Providing a comparative analysis of the market leaders on the basis of the following:
- Product offerings
- Business strategies
- Strengths and weaknesses
- Key financials
- Understanding the competitive landscape and identifying the major growth strategies adopted by players across the key regions
- Analyzing the market dynamics and competitive situations & trends across regions and their impact on prominent market players
Research Methodology:
- The key regions were identified, along with countries contributing the maximum share
- Secondary research was conducted to find the value of food processing ingredients for regions such as North America, Europe, Asia Pacific, and RoW
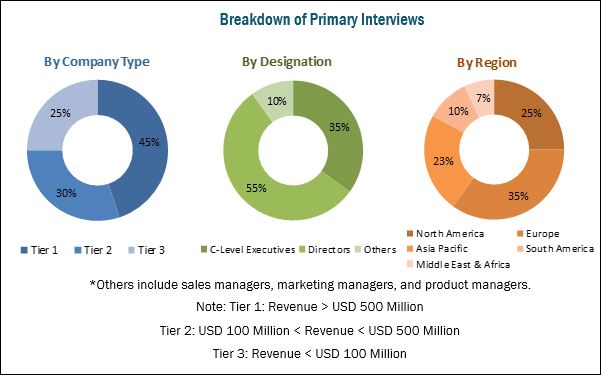
The key players were identified through secondary sources such as the US Department of Agriculture (USDA), Associations and industry bodies [World Health Organization (WHO), Institute of Food and Agricultural Sciences (IFAS)], while their market share in respective regions was determined through both, primary and secondary research processes. The research methodology included the study of annual and financial reports of top market players, as well as interviews with industry experts (such as CEOs, VPs, directors, and marketing executives) for key insights (both quantitative and qualitative) for the food processing ingredients market.
To know about the assumptions considered for the study, download the pdf brochure
The various contributors involved in the value chain of the food processing ingredients market include government organizations, R&D institutes, food processing ingredients manufacturing companies, [such as DSM (Netherlands), CHR. Hansen (Denmark), Ashland (US), Arla Foods (Denmark), Glanbia (Ireland), KB Ingredients (US), and Kemin (US))], & R&D institutes, research institutes & organizations, government and research organizations, commercial research & development (R&D) institutions and financial institutions, and importers and exporters of food processing ingredients.
Target Audience
The stakeholders for the report are as follows:
- Agriculture institutes
-
R&D institutes
- Research institutes & organizations
- Government and research organizations
- Commercial research & development (R&D) institutions and financial institutions, importers and exporters of food processing ingredients
- Farmers
- Food ingredient manufacturers and suppliers
- Raw material suppliers
-
Regulatory bodies
- Organizations such as the FDA, EFSA, USDA, and FSANZ
- Associations and industry bodies [World Health Organization (WHO) and Institute of Food and Agricultural Sciences (IFAS)]
- Government agencies and NGOs
- Food safety agencies
- Food & beverage traders, distributors, and suppliers
- Raw material suppliers
- Government organizations, research organizations, and consulting firms
- Trade associations and industry bodies
-
Importers and exporters
- Bakery products
- Confectionery products
- Convenience food products
- Beverage products
- Dairy & frozen dessert products
Scope of the Report:
This research report categorizes the food processing ingredients market based on type, form, source, application, and region.
Based on Type, the market has been segmented as follows:
- Modified starch & starch derivatives
- Protein
- Food stabilizers
- Emulsifiers
- Yeast
- Enzymes
- Acidity regulators
- Antioxidants
- Release agents
Based on Form, the market has been segmented as follows:
- Dry
- Liquid
Based on Source, the market has been segmented as follows:
- Natural
- Synthetic
Based on Application, the market has been segmented as follows:
- Bakery & confectionery products
- Beverages
- Convenience foods
- Dairy & frozen desserts
- Others*
Based on Region, the market has been segmented as follows:
- North America
- Europe
- Asia Pacific
- RoW (South America, the Middle East, and Africa)
Available Customizations
With the given market data, MarketsandMarkets offers customizations according to the client-specific needs.
The following customization options are available for the report:
Product Analysis
- Product Matrix, which gives a detailed comparison of the product portfolio of each company
Geographic Analysis
- Further breakdown of the Rest of Asia Pacific food processing ingredients market
- Further breakdown of the Rest of European food processing ingredients market
Company Information
- Detailed analysis and profiling of additional market players (up to five)
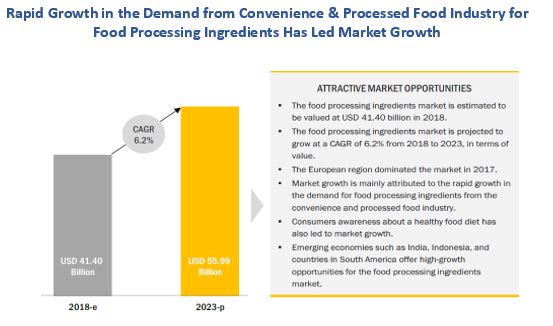
The food processing ingredients market is estimated to be valued at USD 41.40 Billion in 2018, and is projected to reach USD 55.99 Billion by 2023, at a CAGR of 6.2% during the forecast period. The market is experiencing growth due to a rising global awareness toward the consumption of healthy products, and a booming trend of adopting clean labels, that has led to the increase in the demand for natural food processing ingredients.
For More details on this research, Request Free Sample Report
The food processing ingredients market, based on type, has been segmented into modified starch & starch derivatives, proteins, food stabilizers, emulsifiers, yeast, enzymes, acidity regulators, antioxidants, and release agents. The market for yeast is projected to grow at the highest CAGR between 2018 and 2023. Growth in the bakery and brewery industries from countries such as the US, China, India, Australia, Italy, Spain, and Germany, are driving the yeast segment in the market.
The market, by form, has been segmented into dry and liquid. The dry segment is estimated to dominate the market in 2018 and is projected to grow at a comparatively lower CAGR by 2023. This can be attributed to the better stability provided by dry food processing ingredients and ease of their handling. There is also minimal thermal damage of ingredients in their dry forms, making it the more preferred form of food processing ingredient.
The market, by source, has been segmented into natural and synthetic. The market was dominated by the natural food processing ingredients segment in 2018. Increase in consumer preferences for healthy and natural food processing ingredients is expected to be favoring the growth for the market. Consumption patterns in urban areas, influenced by busy lifestyles, represent the enhanced need for food products with health benefits, which are propelling the growth of the natural food processing ingredients market.
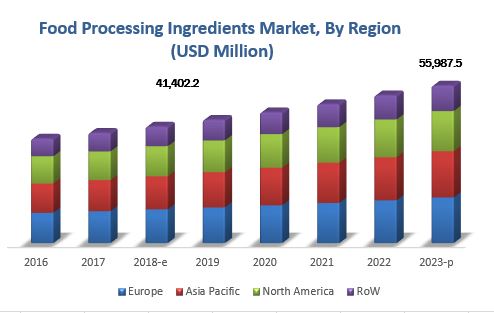
Europe accounted for the largest share in the food processing ingredients market in 2018; however, Asia Pacific is projected to be the fastest-growing market through 2023. Improved lifestyles and changing consumer perceptions have resulted in a rise in the demand for prepared, convenience, and processed foods in the region. A significant demand for better food quality has also led to improvements in processing and handling units, which has ensured market growth in the region.
Increased instances of food-related frauds and fluctuating prices of raw materials are major restraints for the growth of this market.
The global market for food processing ingredients is dominated by large-scale players such as Cargill (US), ADM (US), DuPont (US), Ingredion (US), Tate & Lyle (UK), and Kerry Group (Ireland).
To speak to our analyst for a discussion on the above findings, click Speak to Analyst
Table of Contents
1 Introduction (Page No. - 17)
1.1 Objectives of the Study
1.2 Market Definition
1.3 Study Scope
1.3.1 Markets Covered
1.4 Periodization Considered
1.5 Currency Considered
1.6 Stakeholders
2 Research Methodology (Page No. - 23)
2.1 Research Data
2.1.1 Secondary Data
2.1.1.1 Key Data From Secondary Sources
2.1.2 Primary Data
2.1.2.1 Key Data From Primary Sources
2.1.2.2 Breakdown of Primaries, By Company Type, Designation, and Region
2.1.2.3 Key Industry Insights
2.2 Market Size Estimation
2.3 Market Breakdown & Data Triangulation
2.4 Research Assumptions & Limitations
2.4.1 Assumptions
2.4.2 Research Limitations
3 Executive Summary (Page No. - 32)
4 Premium Insights (Page No. - 37)
4.1 Attractive Opportunities in the Market
4.2 Europe Dominated the Market
4.3 Food Processing Ingredients Market, By Application & Region
4.4 Food Processing Ingredients Market Share: Key Countries
4.5 Food Processing Ingredients Market, By Form & Region
4.6 Food Processing Ingredients Market, By Source, 2018 vs 2023
4.7 Food Processing Ingredients Market, By Type & Region
5 Market Overview (Page No. - 42)
5.1 Introduction
5.2 Market Dynamics
5.2.1 Drivers
5.2.1.1 Rapid Growth in Demand for Processed Food
5.2.1.2 Additional Health Benefits of Food Processing Ingredients
5.2.1.3 Positive Growth Trend in Alcoholic Beverages Consumption
5.2.2 Restraints
5.2.2.1 Increase in Instances of Food-Related Frauds
5.2.3 Opportunities
5.2.3.1 Growing Demand for Food Processing Ingredients in Emerging Economies
5.2.4 Challenges
5.2.4.1 Fluctuating Prices of Raw Materials
5.3 Supply Chain
6 Food Processing Ingredients Market, By Type (Page No. - 51)
6.1 Introduction
6.1.1 Modified Starch & Starch Derivatives
6.1.2 Proteins
6.1.3 Food Stabilizers
6.1.4 Yeast
6.1.5 Emulsifiers
6.1.6 Enzymes
6.1.6.1 Carbohydrase
6.1.7 Acidity Regulators
6.1.8 Antioxidants
6.1.9 Release Agents
7 Food Processing Ingredients Market, By Form (Page No. - 69)
7.1 Introduction
7.1.1 Dry Ingredients
7.1.2 Liquid Ingredients
8 Food Processing Ingredients Market, By Source (Page No. - 73)
8.1 Introduction
8.1.1 Modified Starch & Starch Derivatives
8.1.1.1 Natural Source
8.1.2 Proteins
8.1.3 Food Stabilizers
8.1.3.1 Natural Source
8.1.3.2 Synthetic Source
8.1.4 Emulsifiers
8.1.4.1 Animal Source
8.1.4.2 Plant Source
8.1.5 Yeast
8.1.6 Enzymes
8.1.6.1 Microbial Source
8.1.6.2 Plant Source
8.1.6.3 Animal Source
8.1.7 Acidity Regulators
8.1.8 Antioxidants
8.1.8.1 Natural Source
8.1.8.2 Synthetic Source
8.1.9 Release Agents
9 Food Processing Ingredients Market, By Application (Page No. - 83)
9.1 Introduction
9.1.1 Beverages
9.1.2 Bakery & Confectionery Products
9.1.3 Dairy & Frozen Desserts
9.1.4 Convenience Foods
9.1.5 Other Applications
10 Food Processing Ingredients Market, By Region (Page No. - 90)
10.1 Introduction
10.2 North America
10.2.1 US
10.2.2 Canada
10.2.3 Mexico
10.3 Europe
10.3.1 Germany
10.3.2 France
10.3.3 UK
10.3.4 Italy
10.3.5 Spain
10.3.6 Poland
10.3.7 Rest of Europe
10.4 Asia Pacific
10.4.1 China
10.4.2 India
10.4.3 Japan
10.4.4 Australia
10.4.5 Indonesia
10.4.6 Rest of Asia Pacific
10.5 Rest of the World (RoW)
10.5.1 South America
10.5.2 Africa
10.5.3 Middle East
11 Regulations (Page No. - 127)
11.1 Food Emulsifiers
11.1.1 Introduction
11.1.2 Regulatory Status Determined By the EU
11.1.3 Regulatory Status Determined By the USFDA
11.1.3.1 Regulatory Status in the US
11.1.3.2 Generally Recognized as Safe (GRAS)
11.1.4 Codex Alimentarius
11.1.5 Japan
11.1.6 Canada
11.1.7 India
11.2 Dairy Ingredients
11.2.1 Introduction
11.2.2 EU Regulation on Milk and Milk Products
11.2.2.1 General Dairy Conditions
11.2.2.2 Specific Dairy Rules
11.2.3 US Food and Drug Administration Inspection Guide
11.2.3.1 Regulation for Raw Milk Receiving
11.2.3.2 Regulation for Raw Milk Processing
11.3 Food Enzymes
11.3.1 Enzyme Preparations Used in Food (Partial List)
11.4 Food Antioxidants
11.4.1 Regulations of Antioxidants in the European Union (EU)
11.5 Acidulants
11.5.1 European Union
11.5.2 Modified Starch and Starch Derivatives
11.5.2.1 Gluten-Free
11.5.2.2 This Communication Also Applies to Barley Starch and Barley Starch Derivatives
11.6 Antioxidants
11.6.1 Bha (Butylated Hydroxyanisole)
11.6.2 Bht (Butylated Hydroxytoluene)
11.6.3 Tbhq (Tert-Butylhydroquinone)
11.6.4 Pg (Propyl Gallate)
12 Competitive Landscape (Page No. - 144)
12.1 Overview
12.2 Company Rankings
12.3 Competitive Scenario
12.3.1 New Product Launches
12.3.2 Acquisitions
12.3.3 Joint Ventures, Agreements, and Partnerships
12.3.4 Expansions, Investments, and Divestitures
13 Company Profiles (Page No. - 151)
(Business Overview, Products Offered, Recent Developments, SWOT Analysis & MnM View)*
13.1 Cargill
13.2 Archer Daniels Midland Company
13.3 Dupont
13.4 Ingredion Incorporated
13.5 Tate & Lyle PLC
13.6 Kerry Group
13.7 Koninklijke DSM N.V.
13.8 CHR. Hansen Holdings A/S
13.9 Ashland Global Holdings Inc.
13.10 Associated British Foods PLC
13.11 Arla Foods
13.12 Glanbia PLC
13.13 Nexira
13.14 Kemin Industries, Inc.
13.15 KB Ingredients, LLC
*Details on Business Overview, Products Offered, Recent Developments, SWOT Analysis & MnM View Might Not Be Captured in Case of Unlisted Companies.
14 Appendix (Page No. - 186)
14.1 Discussion Guide
14.2 Other Developments
14.3 Knowledge Store: Marketsandmarkets’ Subscription Portal
14.4 Introducing RT: Real Time Market Intelligence
14.5 Available Customizations
14.6 Related Reports
14.7 Author Details
List of Tables (85 Tables)
Table 1 US Dollar Exchange Rate Considered for Study, 2014–2017
Table 2 Food Processing Ingredients Market Snapshot, in Terms of Value, 2018 vs 2023
Table 3 Food Processing Ingredients Market Size, By Type, 2016–2023 (USD Million)
Table 4 Modified Starch & Starch Derivatives Market Size, By Region, 2016–2023 (USD Million)
Table 5 Modified Starch & Starch Derivatives Market Size, By Sub-Type, 2016–2023 (USD Million)
Table 6 Proteins Market Size, By Region, 2016–2023 (USD Million)
Table 7 Proteins Market Size, By Sub-Type, 2016–2023 (USD Million)
Table 8 Food Stabilizers Market Size, By Region, 2016–2023 (USD Million)
Table 9 Food Stabilizers Market Size, By Sub-Type, 2016–2023 (USD Million)
Table 10 Yeast Market Size, By Region, 2016–2023 (USD Million)
Table 11 Yeast Market Size, By Sub-Type, 2016–2023 (USD Million)
Table 12 Emulsifiers Market Size, By Region, 2016–2023 (USD Million)
Table 13 Emulsifiers Market Size, By Sub-Type, 2016–2023 (USD Million)
Table 14 Enzymes Market Size, By Region, 2016–2023 (USD Million)
Table 15 Enzymes Market Size, By Sub-Type, 2016–2023 (USD Million)
Table 16 Carbohydrase Enzymes Market Size, By Region, 2016–2023 (USD Million)
Table 17 Carbohydrase Enzymes Market Size, By Category, 2016–2023 (USD Million)
Table 18 Acidity Regulators Market Size, By Region, 2016–2023 (USD Million)
Table 19 Acidity Regulators Market Size, By Sub-Type, 2016–2023 (USD Million)
Table 20 Antioxidants Market Size, By Region, 2016–2023 (USD Million)
Table 21 Antioxidants Market Size, By Sub-Type, 2016–2023 (USD Million)
Table 22 Release Agents Market Size, By Region, 2016–2023 (USD Million)
Table 23 Release Agents Market Size, By Sub-Type, 2016–2023 (USD Million)
Table 24 Food Processing Ingredients Market, By Form, 2016–2023 (USD Million)
Table 25 Dry Food Processing Ingredients Market Size, By Region, 2016–2023 (USD Million)
Table 26 Liquid Food Processing Ingredients Market Size, By Region, 2016–2023 (USD Million)
Table 27 Food Processing Ingredients Market Size, By Source, 2016–2023 (USD Million)
Table 28 Natural Food Processing Ingredients Market Size, By Source, 2016–2023 (USD Million)
Table 29 Modified Starch & Starch Derivatives: Food Processing Ingredients Market Size, By Source, 2016–2023 (USD Million)
Table 30 Proteins: Food Processing Ingredients Market Size, By Source, 2016–2023 (USD Million)
Table 31 Food Stabilizers: Food Processing Ingredients Market Size, By Source, 2016–2023 (USD Million)
Table 32 Emulsifiers: Food Processing Ingredients Market Size, By Source, 2016–2023 (USD Million)
Table 33 Yeast: Food Processing Ingredients Market Size, By Source, 2016–2023 (USD Million)
Table 34 Enzymes: Food Processing Ingredients Market Size, By Source, 2016–2023 (USD Million)
Table 35 Acidity Regulators: Food Processing Ingredients Market Size, By Source, 2016–2023 (USD Million)
Table 36 Antioxidants: Food Processing Ingredients Market Size, By Source, 2016–2023 (USD Million)
Table 37 Release Agents: Food Processing Ingredients Market Size, By Source, 2016–2023 (USD Million)
Table 38 Food Processing Ingredients Market, By Application, 2016 - 2023 (USD Million)
Table 39 Food Processing Ingredients Market Size for Beverages, By Region, 2016-2023 (USD Million)
Table 40 Food Processing Ingredients Market Size for Bakery & Confectionery Products, By Region, 2016-2023 (USD Million)
Table 41 Food Processing Ingredients Market Size for Dairy & Frozen Desserts, By Region, 2016-2023 (USD Million)
Table 42 Food Processing Ingredients Market Size for Convenience Foods, By Region, 2016-2023 (USD Million)
Table 43 Food Processing Ingredients Market Size for Other Applications, By Region, 2016-2023 (USD Million)
Table 44 Food Processing Ingredients Market Size, By Region, 2016–2023 (USD Million)
Table 45 North America: Food Processing Ingredients Market Size, By Country, 2016–2023 (USD Million)
Table 46 North America: Market Size, By Type, 2016–2023 (USD Million)
Table 47 North America: Food Processing Ingredients Market Size, By Application, 2016–2023 (USD Million)
Table 48 North America: Market Size, By Form, 2016–2023 (USD Million)
Table 49 US: Food Processing Ingredients Market Size, By Type, 2016–2023 (USD Million)
Table 50 Canada: Market Size, By Type, 2016–2023 (USD Million)
Table 51 Mexico: Food Processing Ingredients Market Size, By Type, 2016–2023 (USD Million)
Table 52 Europe: Market Size, By Country, 2016–2023 (USD Million)
Table 53 Europe: Food Processing Ingredients Market Size, By Type, 2016–2023 (USD Million)
Table 54 Europe: Market Size, By Application, 2016–2023 (USD Million)
Table 55 Europe: Food Processing Ingredients Market Size, By Form, 2016–2023 (USD Million)
Table 56 Germany: Market Size, By Type, 2016–2023 (USD Million)
Table 57 France: Food Processing Ingredients Market Size, By Type, 2016–2023 (USD Million)
Table 58 UK: Market Size, By Type, 2016–2023 (USD Million)
Table 59 Italy: Food Processing Ingredients Market Size, By Type, 2016–2023 (USD Million)
Table 60 Spain: Market Size, By Type, 2016–2023 (USD Million)
Table 61 Poland: Food Processing Ingredients Market Size, By Type, 2016–2023 (USD Million)
Table 62 Rest of Europe: Market Size, By Type, 2016–2023 (USD Million)
Table 63 Asia Pacific: Food Processing Ingredients Market Size, By Country, 2016–2023 (USD Million)
Table 64 Asia Pacific: Market Size, By Type, 2016–2023 (USD Million)
Table 65 Asia Pacific: Food Processing Ingredients Market Size, By Application, 2016–2023 (USD Million)
Table 66 Asia Pacific: Market Size, By Form, 2016–2023 (USD Million)
Table 67 China: Food Processing Ingredients Market Size, By Type, 2016–2023 (USD Million)
Table 68 India: Market Size, By Type, 2016–2023 (USD Million)
Table 69 Japan: Food Processing Ingredients Market Size, By Type, 2016–2023 (USD Million)
Table 70 Australia:Market Size, By Type, 2016–2023 (USD Million)
Table 71 Indonesia: Food Processing Ingredients Market Size, By Type, 2016–2023 (USD Million)
Table 72 Rest of Asia Pacific: Food Processing Ingredients Market Size, By Type, 2016–2023 (USD Million)
Table 73 RoW: Food Processing Ingredients Market Size, By Region, 2016–2023 (USD Million)
Table 74 RoW: Food Processing Ingredients Market Size, By Type, 2016–2023 (USD Million)
Table 75 RoW: Market Size, By Application, 2016–2023 (USD Million)
Table 76 RoW: Food Processing Ingredients Market Size, By Form, 2016–2023 (USD Million)
Table 77 South America: Food Processing Ingredients Market Size, By Type, 2016–2023 (USD Million)
Table 78 Africa: Food Processing Ingredients Market Size, By Type, 2016–2023 (USD Million)
Table 79 Middle East: Food Processing Ingredients Market Size, By Type, 2016–2023 (USD Million)
Table 80 Food Processing Ingredients Market, Company Rankings, 2017
Table 81 New Product Launches, 2014–2018
Table 82 Acquisitions, 2014–2018
Table 83 Joint Ventures, Agreements, and Partnerships, 2014–2018
Table 84 Expansions, Investments, and Divestitures, 2014–2018
Table 85 Developments, 2013–2018
List of Figures (50 Figures)
Figure 1 Food Processing Ingredients Market Snapshot
Figure 2 Food Processing Ingredients Market Segmentation, By Source
Figure 3 Food Processing Ingredients Market, By Region
Figure 4 Food Processing Ingredients: Research Design
Figure 5 Market Size Estimation Methodology: Bottom-Up Approach
Figure 6 Market Size Estimation Methodology: Top-Down Approach
Figure 7 Data Triangulation Methodology
Figure 8 Food Processing Ingredients Market Size, By Type, 2018 vs 2023
Figure 9 Food Processing Ingredients Market Size, By Form, 2018 vs 2023
Figure 10 Food Processing Ingredients Market Size, By Source, 2018 vs 2023
Figure 11 Food Processing Ingredients Market Size, By Application, 2018 vs 2023
Figure 12 Food Processing Ingredients Market Share, By Region
Figure 13 Rapid Growth in the Demand From Convenience & Processed Food Industry for Food Processing Ingredients has Led Market Growth
Figure 14 Food Processing Ingredients Market Share (Value), By Region, 2016–2023
Figure 15 Beverages Segment Recorded the Largest Share in 2017
Figure 16 China & India: Emerging Markets for Food Processing Ingredients During the Forecast Period
Figure 17 Steady Growth is Projected in All Regions During the Forecast Period
Figure 18 Synthetic Source of Food Processing Ingredients is Projected to Be Larger During the Forecast Period
Figure 19 Modified Starch & Starch Derivatives is Projected to Be the Fastest-Growing During the Forecast Period
Figure 20 Food Processing Ingredients: Drivers, Restraints, Opportunities, and Challenges
Figure 21 Alcoholic Beverages Consumption Trend, 2013–2015 (Liter Per Capita)
Figure 22 Global Raw Material Prices, 2001–2017 (USD/Metric Ton)
Figure 23 Raw Material Suppliers are Vital Components of the Supply Chain
Figure 24 Modified Starch & Starch Derivatives Segment is Projected to Hold the Largest Market Share During the Forecast Period
Figure 25 Dry Form Projected to Hold the Largest Market Share During the Forecast Period
Figure 26 Natural Segment is Projected to Acquire A Larger Share During the Forecast Period
Figure 27 Beverage Segment is Projected to Dominate the Food Processing Ingredients Through the Forecast Period
Figure 28 Regional Snapshot: US Held the Largest Share in the Market, 2017
Figure 29 Europe: Food Processing Ingredients Market
Figure 30 Asia Pacific: Food Processing Ingredients Market
Figure 31 Australian Imports of Food Processing Ingredients, 2017
Figure 32 New Products Launches, and Expansions Were Preferred By Key Food Processing Ingredients Companies in the Last Five Years
Figure 33 Strengthening Market Presence Through New Product Launches, Expansions & Investments Between 2014 to 2018
Figure 34 Cargill: Company Snapshot
Figure 35 Cargill: SWOT Analysis
Figure 36 Archer Daniels Midland Company: Company Snapshot
Figure 37 Archer Daniels Midland Company: SWOT Analysis
Figure 38 Dupont: Company Snapshot
Figure 39 Dupont: SWOT Analysis
Figure 40 Ingredion Incorporated: Company Snapshot
Figure 41 Ingredion Incorporated: SWOT Analysis
Figure 42 Tate & Lyle PLC: Company Snapshot
Figure 43 Tate & Lyle PLC: SWOT Analysis
Figure 44 Kerry Group: Company Snapshot
Figure 45 Koninklijke DSM N.V.: Company Snapshot
Figure 46 CHR. Hansen Holdings A/S: Company Snapshot
Figure 47 Ashland Inc.: Company Snapshot
Figure 48 Associated British Foods PLC: Company Snapshot
Figure 49 Arla Foods: Company Snapshot
Figure 50 Glanbia PLC: Company Snapshot


Growth opportunities and latent adjacency in Food Processing Ingredients Market