
Food Ultrasound Market by Frequency Range (High-intensity and Low-intensity), Food Product (Meat, Beverages, F&V, Dairy, Bakery), Function (Microbial Inactivation, Quality Assurance, Homogenization, Cutting), and Region - Global forecast to 2022
Market Segmentation
| Report Metrics | Details |
|
Market size available for years |
2017 - 2022 |
|
CAGR % |
7.5 |
Top 10 companies in Food Ultrasound Market
Food Ultrasound Market News


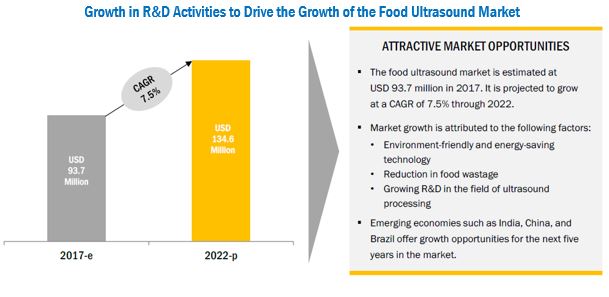
[138 Pages Report] The food ultrasound market was valued at USD 87.7 Million in 2016. It is projected to reach USD 134.6 Million by 2022, growing at a CAGR of 7.5% from 2017. Ultrasound technology is used for the processing of various food products such as meat & food, fruits & vegetables, beverages, dairy, bakery & confectionery, and others (cereals, grains, pulses, nuts, seeds, spices, and packaged foods).
For More details on this research, Request Free Sample Report
The global market is expected to grow at a considerable rate with the rising awareness about food quality, the demand for an extended shelf-life, and nutritional value in food. Further, the ultrasound technique has been emerging as a new trend in the food industry offering multiple functions such as quality assurance, microbial enzyme) inactivation, homogenization, emulsification, cutting, cleaning, drying, thawing, freezing, and others (drying, mixing, freezing, thawing, crystallization, filtration, pickling, marinating, sterilization, fermentation, pasteurization, and packaging). Market players are responding to new opportunities by expanding their global presence and product offerings. They are witnessing strong demand from the food processing industry due to its high reliability.
The objectives of the study are:
- To define, segment, and forecast the size of the food ultrasound market with respect to frequency range, function, food product, and region
- To analyze the market structure by identifying various subsegments of the food ultrasound market
- To forecast the size of the food ultrasound market and its various submarkets with respect to four main regions, namely, North America, Asia Pacific, Europe, and the Rest of the World (RoW)
- To provide detailed information about the crucial factors that are influencing the growth of the market (drivers, restraints, opportunities, and challenges)
- To analyze the opportunities in the market for stakeholders and provide details of the competitive landscape for market leaders
- To strategically profile the key players and comprehensively analyze their market ranking and core competencies
- To analyze the competitive developments such as expansions, new product & technology launches, acquisitions, mergers, collaborations, and partnerships in the food ultrasound market
The years considered for the study are as follows:
- Base Year: 2016
- Estimated Year: 2017
- Projected Year: 2022
- Forecast Period: 2017 to 2022
This report includes estimations of the market size in terms of value (USD million). Both, top-down and bottom-up approaches have been used to estimate and validate the size of the food ultrasound market and to estimate the size of various other dependent submarkets in the overall market. Key players in the market have been identified through secondary research and their market ranking in the respective regions have been determined through primary and secondary research. All percentage shares, splits, and breakdowns have been determined using secondary sources and were verified through primary sources.
To know about the assumptions considered for the study, download the pdf brochure
The key product providers in the food ultrasound market include Bühler, Bosch, Dukane, Hielscher, Emerson, Newtech, Siemens, Cheersonic, Rinco Ultrasonics, Omni International, Sonics & Materials, Elliptical Design, Marchant Schmidt, and Sonomechanics.
Target Audience:
- Manufacturers, importers & exporters, traders, distributors, and suppliers of ultrasonic food processing equipment
- Food processing companies
- Packaged food manufacturers
- Raw material suppliers
- Food technologists
- Government and research organizations
- Regulatory bodies
- End users
“The study answers several questions for stakeholders; primarily, which market segments to focus on in the next two to five years for prioritizing efforts and investments.”
Get online access to the report on the World's First Market Intelligence Cloud
Request Sample Scope of the Report

This research report categorizes the food ultrasound market based on frequency range, function, food product, and region.
Based on Food Product, the market has been segmented as follows:
- Meat & seafood
- Fruits & vegetables
- Beverages
- Dairy
- Bakery & confectionery
- Others
Based on Frequency Range, the market has been segmented as follows:
- High-frequency low-intensity
- Low-frequency high-intensity
Based on Function, the market has been segmented as follows:
- Quality assurance
- Microbial enzyme) inactivation
- Cutting
- Emulsification & homogenization
- Cleaning
- Others
Based on Region, the market has been segmented as follows:
- North America
- Europe
- Asia Pacific
- RoW (Brazil, Argentina, the Middle East, and others in RoW)
Available Customizations
With the given market data, MarketsandMarkets offers customizations according to the company’s specific scientific needs.
The following customization options are available for the report:
Segmental Analysis
- Segmental analysis, which provides further breakdown of the quality assurance, microbial enzyme) inactivation, cutting, emulsification & homogenization, and cleaning segments
- Further breakdown of food products such as meat & meat products, fruits & vegetables, beverages, dairy, bakery & confectionery, packaged food, cereals, grains & pulses, nuts, seeds & spices, and other food products
Geographic Analysis
- Further breakdown of the Rest of Asia Pacific food ultrasound market, by country
- Further breakdown of other countries in the Rest of the World food ultrasound market, by key country
Company Information
- Detailed analyses and profiling of additional market players (up to five)
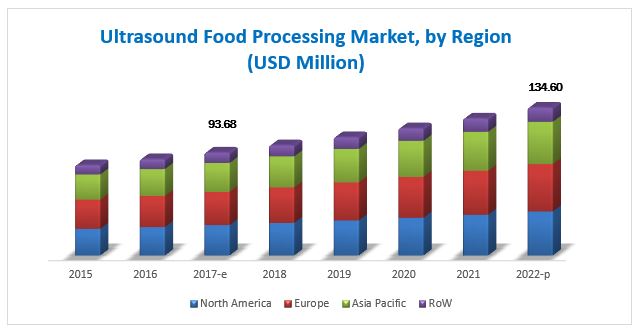
The global market for food ultrasound has grown exponentially in the last few years. The market was valued at USD 93.7 Million in 2017 and is projected to reach USD 134.6 Million by 2022, growing at a CAGR of 7.5% from 2017. Emerging economies such as India, China, Japan, South Africa, and Brazil are the potential primary markets of the industry. Concerns regarding food wastage and energy savings during food processing are prompting companies to adopt ultrasonic technology. The increasing R&D in the field of ultrasonic food processing to reduce wastage during processing and maintaining the quality of the food product is also one of the important drivers responsible for growth in this market.
Conventionally used thermal food processing technologies may lead to alteration in a product’s flavor, color, texture, or nutritional value. With the growing need for process efficiency and environmental friendly technology, the demand for energy-efficient ultrasound technology has been increasing. Ultrasound technology aids in the retention of sensory attributes and increased productivity. It also accommodates the current consumer demand for natural, fresh, and minimally processed foods as no preservatives or additives are added to the products.
Ultrasound technology in food finds application in processes such as quality assurance, microbial (enzyme) inactivation, cutting, homogenization, cleaning, and others such as drying, mixing, freezing, thawing, crystallization, filtration, pickling, marinating, sterilization, fermentation, and pasteurization. Of these, quality assurance is the largest segment in the food ultrasound market, followed by microbial inactivation. In meat production, ultrasonic technology accelerates the process of margination and pickling.
The food ultrasound market for food, based on frequency range, is segmented into low-intensity high-frequency and high-intensity low-frequency. The frequency to be used is chosen according to the food product to be processed and the function to be performed. Processes such as cleaning, microbial inactivation, and cutting can be performed through both high as well as low ultrasound frequency depending upon the sensitivity of the product being processed and the function which has to be performed.
By food product, the market is segmented into meat & seafood, fruits & vegetables, beverages, dairy, bakery & confectionery, and others. Bakery & confectionery include chocolates, cakes, cookies, and other confectionery products. Meat & seafood processing is the prominent market for ultrasound technology. The demand for ultrasonic food processing is driven by the growing demand for process efficiency through shortened processing time and energy-saving technology.
For More details on this research, Request Free Sample Report
The North American region is projected to dominate the food ultrasound market by 2022. The Asia Pacific region is projected to be the fastest-growing market during the forecast period since the demand in countries such as Japan, China, and India due to the adoption of the latest techniques for food processing to meet the growing food demand. Other factors responsible for the growth of the Asia Pacific market are the emerging economies and the growing R&D activities for launching new technologies.
Being a new and emerging technology, not many people have the skillset for operating ultrasonic processing equipment. Shortage of skilled labor could delay processing and affect the results, which could increase the wastage of raw materials. Companies have been taking several efforts by providing training and organizing seminars to increase the awareness of ultrasonic processing to avoid these issues.
New product & technology launches, expansions, acquisitions & collaborations, and mergers & partnerships are the key strategies adopted by market players to ensure their growth in the market. The market is dominated by players such as Bosch (Germany), Emerson (US), Bühler (Switzerland), Dukane (US), Heilscher (Germany), Siemens (Germany), and Newtech (UK). Other major players in the market include Cheersonic (China), Rinco Ultrasonics (Switzerland), Omni international (US), Sonics & Materials (US), Elliptical Design (UK), Marchant Schmidt (US), and Sonomechanics (US).
To speak to our analyst for a discussion on the above findings, click Speak to Analyst
Table of Contents
1 Introduction (Page No. - 13)
1.1 Objectives of the Study
1.2 Market Definition
1.3 Study Scope
1.4 Years Considered
1.5 Currency Considered
1.6 Stakeholders
2 Research Methodology (Page No. - 17)
2.1 Research Data
2.1.1 Secondary Data
2.1.2 Primary Data
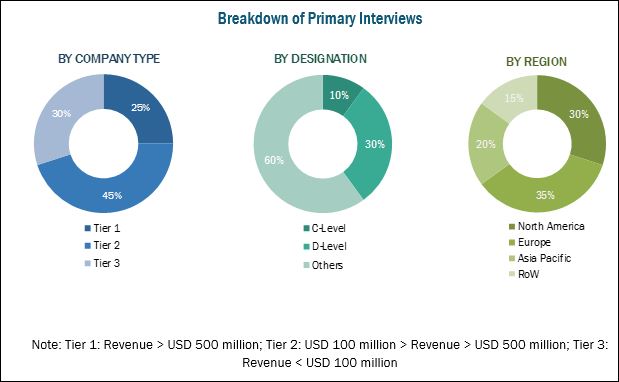
2.1.2.1 Breakdown of Primary Interviews
2.2 Market Size Estimation
2.2.1 Bottom-Up Approach
2.2.2 Top-Down Approach
2.3 Data Triangulation
2.4 Research Assumptions & Limitations
2.4.1 Assumptions
2.4.2 Limitations
3 Executive Summary (Page No. - 24)
4 Premium Insights (Page No. - 30)
4.1 Opportunities in this Market
4.2 Food Ultrasound Market: Key Country
4.3 Market, By Frequency Range & Region
4.4 Developed vs Developing Food Ultrasound Markets
4.5 Food Ultrasound Market, By Food Product & Region
4.6 Market, By Function
4.7 North America: Food Ultrasound Market, By Food Product & Country, 2016
5 Market Overview (Page No. - 36)
5.1 Introduction
5.2 Industry Trends
5.2.1 Multi-Functionality & Combination Technologies With Ultrasonication
5.2.2 Manufacturers’ Trend Towards Sustainable Production
5.2.3 Quality Management of Food
5.2.4 Increasing Consumption of Processed and Packaged Food
5.2.5 Growing Reach of Organized Retail Sector in Developing Economies
5.3 Market Dynamics
5.3.1 Drivers
5.3.1.1 Environment-Friendly and Energy-Efficient Technology
5.3.1.2 Prevention of Food Wastage
5.3.1.3 Process Efficiency Through Ultrasound to Draw the Attention of Food Manufacturers
5.3.1.3.1 Shortened Processing Time
5.3.1.3.2 Retention of Sensory Attributes and Increased Productivity
5.3.1.4 Growing R&D Activities in the Field of Ultrasonic Processing
5.3.1.4.1 Patented Techniques in Ultrasound
5.3.2 Restraints
5.3.2.1 Technological Difficulties and Lack of Skilled Manpower
5.3.2.2 Stringent Food Safety Regulations
5.3.3 Opportunities
5.3.3.1 Adoption of Ultrasonic Equipment for the Packaging of Food Products
5.3.3.2 Shelf Life Enhancement of Processed Food
5.3.4 Challenges
5.3.4.1 High Capital Investment
6 Food Ultrasound Market, By Frequency Range (Page No. - 43)
6.1 Introduction
6.1.1 Destructive Technique
6.1.2 Non-Destructive Technique
6.2 High-Frequency Low-Intensity
6.3 Low-Frequency High-Intensity
7 Food Ultrasound Market, By Function (Page No. - 48)
7.1 Introduction
7.2 Quality Assurance
7.3 Microbial (& Enzyme) Inactivation
7.3.1 Enzyme Inactivation to Enhance the Product Shelf-Life
7.4 Cutting
7.5 Emulsification & Homogenization
7.6 Cleaning
7.7 Others
8 Food Ultrasound Market, By Food Product (Page No. - 55)
8.1 Introduction
8.2 Meat & Seafood
8.3 Fruits & Vegetables
8.4 Beverages
8.5 Dairy
8.6 Bakery & Confectionery
8.7 Others
9 Food Ultrasound Market, By Region (Page No. - 62)
9.1 Introduction
9.2 North America
9.2.1 US
9.2.2 Canada
9.2.3 Mexico
9.3 Europe
9.3.1 Germany
9.3.2 UK
9.3.3 France
9.3.4 Spain
9.3.5 Italy
9.3.6 Rest of Europe
9.4 Asia Pacific
9.4.1 China
9.4.2 Japan
9.4.3 India
9.4.4 Australia & New Zealand
9.4.5 Rest of Asia Pacific
9.5 Rest of the World (RoW)
9.5.1 Brazil
9.5.2 Argentina
9.5.3 Middle East
9.5.4 Others in RoW
10 Competitive Landscape (Page No. - 99)
10.1 Overview
10.2 Market Ranking
10.3 Competitive Scenario
10.3.1 New Product & Technology Launches
10.3.2 Expansions
10.3.3 Collaborations, Mergers, and Partnerships
10.3.4 Acquisitions
11 Company Profiles (Page No. - 104)
(Business Overview, Products Offered, Recent Developments, SWOT Analysis & MnM View)*
11.1 Bosch
11.2 Emerson
11.3 Bühler
11.4 Dukane
11.5 Hielscher
11.6 Newtech
11.7 Siemens
11.8 Cheersonic
11.9 Rinco Ultrasonics
11.10 Omni International
11.11 Sonics & Materials
11.12 Elliptical Design
11.13 Marchant Schmidt
11.14 Sonomechanics
*Details on Business Overview, Products Offered, Recent Developments, SWOT Analysis & MnM View Might Not Be Captured in Case of Unlisted Companies.
12 Appendix (Page No. - 128)
12.1 Discussion Guide
12.2 Additional Company Developments
12.2.1 New Product and Technology Launches
12.2.2 Expansions
12.2.3 Collaborations, Mergers, and Partnerships
12.3 Knowledge Store: Marketsandmarkets’ Subscription Portal
12.4 Introducing RT: Real-Time Market Intelligence
12.5 Available Customizations
12.6 Related Reports
12.7 Author Details
List of Tables (78 Tables)
Table 1 US Dollar Exchange Rate Considered for the Study, 2014–2016
Table 2 Food Ultrasound Market Size, By Frequency Range, 2015–2022 (USD Million)
Table 3 High-Frequency Low-Intensity Food Ultrasound Market Size, By Region, 2015–2022 (USD Million)
Table 4 Low-Frequency High-Intensity Food Ultrasound Market Size, By Region, 2015–2022 (USD Million)
Table 5 Food Ultrasound Market Size, By Function, 2015–2022 (USD Million)
Table 6 Quality Assurance: Food Ultrasound Market Size, By Region, 2015–2022 (USD Million)
Table 7 Microbial (& Enzyme) Inactivation: Market Size for Food Ultrasound, By Region, 2015–2022 (USD Million)
Table 8 Cutting: Food Ultrasound Market Size, By Region, 2015–2022 (USD Million)
Table 9 Emulsification & Homogenization: Market Size for Food Ultrasound, By Region, 2015–2022 (USD Million)
Table 10 Cleaning: Market Size for Food Ultrasound, By Region, 2015–2022 (USD Million)
Table 11 Other Functions: Food Ultrasound Market Size, By Region, 2015–2022 (USD Million)
Table 12 Market Size for Food Ultrasound, By Food Product, 2015–2022 (USD Million)
Table 13 Food Ultrasound Market Size in Meat & Seafood Processing, By Region, 2015–2022 (USD Million)
Table 14 Food Ultrasound Market Size in Fruit & Vegetable Processing, By Region, 2015–2022 (USD Million)
Table 15 Food Ultrasound Market Size in Beverage Processing, By Region, 2015–2022 (USD Million)
Table 16 Food Ultrasound Market Size in Dairy Processing, By Region, 2015–2022 (USD Million)
Table 17 Food Ultrasound Market Size in Bakery & Confectionery Processing, By Region, 2015–2022 (USD Million)
Table 18 Food Ultrasound Market Size in Other Food Product Processing, By Region, 2015–2022 (USD Million)
Table 19 Food Ultrasound Market Size, By Region, 2015–2022 (USD Million)
Table 20 North America: Food Ultrasound Market Size, By Country, 2015–2022 (USD Million)
Table 21 North America: Market Size, By Frequency Range, 2015–2022 (USD Million)
Table 22 North America: Market Size, By Food Product, 2015–2022 (USD Million)
Table 23 North America: Market Size, By Function, 2015–2022 (USD Million)
Table 24 US: Market Size, By Frequency Range, 2015–2022 (USD Million)
Table 25 US: Market Size, By Food Product, 2015–2022 (USD Million)
Table 26 Canada: Market Size, By Frequency Range, 2015–2022 (USD Million)
Table 27 Canada: Market Size, By Food Product, 2015–2022 (USD Million)
Table 28 Mexico: Market Size, By Frequency Range, 2015–2022 (USD Million)
Table 29 Mexico: Market Size, By Food Product, 2015–2022 (USD Million)
Table 30 Europe: Food Ultrasound Market Size, By Country, 2015–2022 (USD Million)
Table 31 Europe: Market Size, By Frequency Range, 2015–2022 (USD Million)
Table 32 Europe: Market Size, By Food Product, 2015–2022 (USD Million)
Table 33 Europe: Market Size, By Function, 2015–2022 (USD Million)
Table 34 Germany: Market Size, By Frequency Range, 2015–2022 (USD Million)
Table 35 Germany: Market Size, By Food Product, 2015–2022 (USD Million)
Table 36 UK: Market Size, By Frequency Range, 2015–2022 (USD Million)
Table 37 UK: Market Size, By Food Product, 2015–2022 (USD Million)
Table 38 France: Market Size, By Frequency Range, 2015–2022 (USD Million)
Table 39 France: Market Size, By Food Product, 2015–2022 (USD Million)
Table 40 Spain: Market Size, By Frequency Range, 2015–2022 (USD Million)
Table 41 Spain: Market Size, By Food Product, 2015–2022 (USD Million)
Table 42 Italy: Market Size, By Frequency Range, 2015–2022 (USD Million)
Table 43 Italy: Market Size, By Food Product, 2015–2022 (USD Million)
Table 44 Rest of Europe: Market Size, By Frequency Range, 2015–2022 (USD Million)
Table 45 Rest of Europe: Market Size, By Food Product, 2015–2022 (USD Million)
Table 46 Asia Pacific: Food Ultrasound Market Size, By Country, 2015–2022 (USD Million)
Table 47 Asia Pacific: Market Size, By Frequency Range, 2015–2022 (USD Million)
Table 48 Asia Pacific: Market Size, By Food Product, 2015–2022 (USD Million)
Table 49 Asia Pacific: Market Size, By Function, 2015–2022 (USD Million)
Table 50 China: Market Size, By Frequency Range, 2015–2022 (USD Million)
Table 51 China: Market Size, By Food Product, 2015–2022 (USD Million)
Table 52 Japan: Market Size, By Frequency Range, 2015–2022 (USD Million)
Table 53 Japan: Market Size, By Food Product, 2015–2022 (USD Million)
Table 54 India: Market Size, By Frequency Range, 2015–2022 (USD Million)
Table 55 India: Market Size, By Food Product, 2015–2022 (USD Million)
Table 56 Australia & New Zealand: Food Ultrasound Market Size, By Frequency Range, 2015–2022 (USD Million)
Table 57 Australia & New Zeeland: Market Size, By Food Product, 2015–2022 (USD Million)
Table 58 Rest of Asia Pacific: Food Ultrasound Market Size, By Frequency Range, 2015–2022 (USD Million)
Table 59 Rest of Asia Pacific: Market Size, By Food Product, 2015–2022 (USD Million)
Table 60 RoW: Food Ultrasound Market Size, By Country/Region, 2015–2022 (USD Million)
Table 61 RoW: Market Size, By Frequency Range, 2015–2022 (USD Million)
Table 62 RoW: Market Size, By Food Product, 2015–2022 (USD Million)
Table 63 RoW: Market Size, By Function, 2015–2022 (USD Million)
Table 64 Brazil: Market Size, By Frequency Range, 2015–2022 (USD Million)
Table 65 Brazil: Market Size, By Food Product, 2015–2022 (USD Million)
Table 66 Argentina: Food Ultrasound Market Size, By Frequency Range, 2015–2022 (USD Million)
Table 67 Argentina: Market Size, By Food Product, 2015–2022 (USD Million)
Table 68 Middle East: Food Ultrasound Market Size, By Frequency Range, 2015–2022 (USD Million)
Table 69 Middle East: Market Size, By Food Product, 2015–2022 (USD Million)
Table 70 Others in RoW: Market Size for Food Ultrasound, By Frequency Range, 2015–2022 (USD Million)
Table 71 Other Countries: Food Ultrasound Market Size, By Food Product, 2015–2022 (USD Million)
Table 72 New Product & Technology Launches, 2017–2018
Table 73 Expansions, 2017
Table 74 Collaborations, Mergers, and Partnerships, 2017
Table 75 Acquisitions, 2017
Table 76 New Product and Technology Launches, 2014–2017
Table 77 Expansions, 2017
Table 78 Collaborations, Mergers, and Partnerships 2017
List of Figures (44 Figures)
Figure 1 Market Segmentation
Figure 2 Regional Segmentation: Food Ultrasound Market
Figure 3 Food Ultrasound Market: Research Design
Figure 4 Breakdown of Primary Interviews: By Company Type, Designation, and Region
Figure 5 Market Size Estimation Methodology: Bottom-Up Approach
Figure 6 Market Size Estimation Methodology: Top-Down Approach
Figure 7 Food Ultrasound Market: Data Triangulation
Figure 8 Assumptions of the Research Study
Figure 9 Limitations of the Research Study
Figure 10 Food Ultrasound Market Size, By Frequency Range, 2017–2022 (USD Million)
Figure 11 Market Size, By Food Product, 2017–2022 (USD Million)
Figure 12 Market Snapshot, By Function, 2017 vs 2022 (USD Million)
Figure 13 Asia Pacific to Be the Fastest-Growing Regional Food Ultrasound Market, 2017–2022
Figure 14 Food Ultrasound Market Share, By Region
Figure 15 Growth in R&D Activities to Drive the Growth of the Food Ultrasound Market
Figure 16 China to Be the Fastest-Growing Country-Level Food Ultrasound Market By 2022
Figure 17 Low-Frequency High-Intensity Segment Dominated the Market in 2016
Figure 18 Developing Countries to Progress at High Growth Rates During the Forecast Period (USD Million)
Figure 19 Europe Dominated the Market Across All Food Products in 2016
Figure 20 Quality Assurance Segment Projected to Be the Largest By
Figure 21 US Accounted for the Largest Share in 2016
Figure 22 Market Dynamics: Food Ultrasound Market
Figure 23 Per Capita Food Losses During Production in 2010 (Kg)
Figure 24 Comparison of Processes for the Extraction of Oil From Rice Bran
Figure 25 Patents Filed in the Field of Ultrasonic Food Processing, 2000–2016
Figure 26 Food Ultrasound Market Size, By Frequency Range, 2017 vs 2022 (USD Million)
Figure 27 Low-Frequency High-Intensity Market Size, By Region, 2017 vs 2022 (USD Million)
Figure 28 Food Ultrasound Market Size, By Function, 2017 vs 2022 (USD Million)
Figure 29 Quality Assurance: Market Size for Food Ultrasound, By Region, 2017 vs 2022 (USD Million)
Figure 30 Food Ultrasound Market Size, By Food Product, 2017 vs 2022 (USD Million)
Figure 31 Food Ultrasound Market Size in Meat & Seafood Processing, By Region, 2017 vs 2022 (USD Million)
Figure 32 US Held the Largest Share in the Food Ultrasound Market, 2016
Figure 33 North American Food Ultrasound Market Snapshot
Figure 34 Europe: Leading Importing Countries for Food Processing Equipment Parts, 2015 (USD Million)
Figure 35 European Food Ultrasound Market Snapshot
Figure 36 Spanish Trade Balance of the Food Processing Machinery & Equipment Sector, 2007–2010 (USD Million)
Figure 37 Asia Pacific Food Ultrasound Market Snapshot
Figure 38 Key Developments of the Leading Players in the Food Ultrasound Market From 2013 to 2017
Figure 39 Top Five Companies in the Food Ultrasound Market, 2016
Figure 40 Market Evaluation Framework
Figure 41 Bosch: Company Snapshot
Figure 42 Emerson: Company Snapshot
Figure 43 Bühler: Company Snapshot
Figure 44 Siemens: Company Snapshot


Growth opportunities and latent adjacency in Food Ultrasound Market