Glass Curtain Wall Market by Type (Unitized curtain wall, stick curtain wall), End-use (Commercial, Public, Residential), and Region (North America, Europe, Asia Pacific, Middle East & Africa, South America) - Global Forecast to 2023


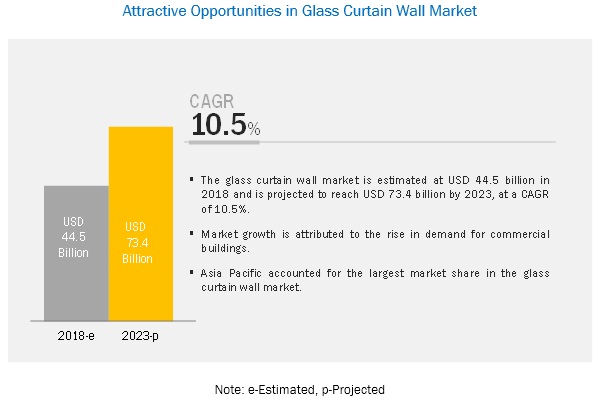
[151 Pages Report] The glass curtain wall market is projected to grow from USD 44.5 billion in 2018, to reach USD 73.4 billion by 2023, at a CAGR of 10.5% from 2018 to 2023. The growth of this market is attributed to the rise in the need for energy-efficient fa�ade systems and strict environmental regulations. In addition, the upward trend in the building & construction industry is projected to contribute to the growth of the glass curtain wall market during the forecast period.
In terms of value and volume , the unitized curtain wall segment is projected to lead the glass curtain wall market from 2018 to 2023.
Based on system , the unitized curtain wall segment in the glass curtain wall market is projected to grow at a higher CAGR during the forecast period, in terms of both value and volume. The growth of this segment can be attributed to high demand of unitized glass curtain walls in the commercial industry. These curtain wall systems are designed to be external glazed systems of buildings. This framing is attached to the buildings, and hence doesn�t lift or support the floor or roof loads of the buildings.
In terms of value and volume, the commercial buildings segment in the glass curtain wall market is projected to grow at the highest CAGR during the forecast period.
Based on end use, the commercial buildings segment is projected to lead the glass curtain wall market from 2018 to 2023, in terms of both value and volume. The demand for smooth exterior glass facade on buildings, attractive architectural design, day-lighting, thermal efficiency, exterior exposure of metal framing for water elimination and air infiltration, and environmental control are some of the key factors contributing to the growth of the glass curtain wall market in the commercial buildings segment. These systems provides a protective layer for large-scale commercial buildings and enhance the energy efficiency of the buildings, along with reducing the cost of heating & cooling .
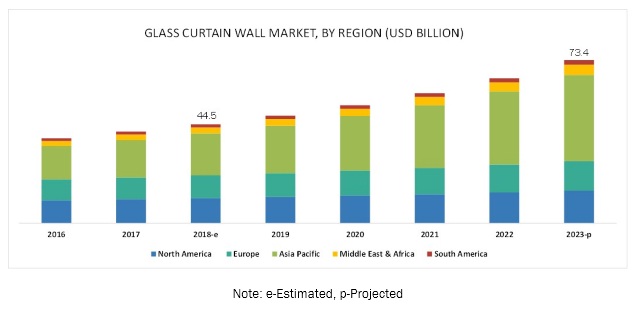
The Asia Pacific glass curtain wall market is projected to witness rapid growth during the forecast period.
The increase in the demand for glass curtain wall can be largely attributed to the growing infrastructure and building & construction industries. The demand for glass curtain wall is growing rapidly in the region, owing to the high growth in the infrastructure sector for an aesthetic appeal. Asia Pacific is the hub of foreign investments and booming industrial sectors largely due to the availability of low-cost labor and land . . This market is also projected to lead the market, in terms of both value and volume, during the forecast period.
Key Market Players
Saint-Gobain (France), Asahi Glass (Japan), Central Glass (Japan), Guardian Industries (US), Nippon Sheet Glass (US), AVIC Sanxin Co., Ltd (China), Schott AG (Germany), China Glass Holdings Limited (Hong Kong), Vitro (Mexico), and Xinyi Glass Holdings Limited (Hong Kong) are the key players operating in the glass curtain wall market.
Saint-Gobain is one of the largest companies which designs, manufactures, and distributes building and construction materials such as ceramic , glass, plastic , and fiber cement products. It is one of the leading curtain wall manufacturer. The strong global presence and adoption of growth strategies such as acquisitions, partnerships, divestments, and expansion have ensured its leading position in the market. In January 2019, the company opened a new flat glass production line (float) in Sriperumbudur, near Chennai, India; in July 2017, Saint-Gobain SA acquired TekBond (Brazil), the number two adhesive business operating in the construction sector and automotive aftermarket; and in December 2016, it acquired the entire share capital of the Romanian company Pietta Glass to expand in the facade market.
Get online access to the report on the World's First Market Intelligence Cloud
- Easy to Download Historical Data & Forecast Numbers
- Company Analysis Dashboard for high growth potential opportunities
- Research Analyst Access for customization & queries
- Competitor Analysis with Interactive dashboard
- Latest News, Updates & Trend analysis
Request Sample Scope of the Report
Get online access to the report on the World's First Market Intelligence Cloud
- Easy to Download Historical Data & Forecast Numbers
- Company Analysis Dashboard for high growth potential opportunities
- Research Analyst Access for customization & queries
- Competitor Analysis with Interactive dashboard
- Latest News, Updates & Trend analysis

|
Report Metric |
Details |
|
Market size available for years |
2016�2023 |
|
Base year considered |
2017 |
|
Forecast period |
2018�2023 |
|
Forecast units |
Value (USD Million) and Volume (Thousand Square Meters) |
|
Segments covered |
System, End Use, and Region |
|
Geographies covered |
North America, Asia Pacific, Europe, South America, and the Middle East & Africa |
|
Companies covered |
Saint-Gobain (France), Asahi Glass (Japan), Central Glass (Japan), Guardian Industries (US), Nippon Sheet Glass (US), AVIC Sanxin Co., Ltd (China), Schott AG (Germany), China Glass Holdings Limited (Hong Kong), Vitro (Mexico), Xinyi Glass Holdings Limited (Hong Kong) |
This research report categorizes the glass curtain wall market based on system, end use, and region.
On the basis of the glass curtain wall market has been categorized as follows:
- Unitized
- Stick
On the basis of end use, the glass curtain wall market has been categorized as follows:
- Commercial
- Public
- Residential
On the basis of region, the glass curtain wall market has been categorized as follows:
- North America
- Europe
- Asia Pacific
- Middle East & Africa
- South America
Recent Developments
- In January 2019, Saint-Gobain opened a new flat glass production line (float) in Sriperumbudur, near Chennai, India. This new production line represents a Euro 115 million (USD 130 Million) investment and complemented Saint-Gobain�s industrial glass facilities in India, which also included a float in Bhiwadi (Rajasthan) and another in Jhagadia (Gujarat).
- In January 2019, Tecnoglass, a leading manufacturer of glass windows and fa�ades in Colombian, took a minority share in the capital of Saint-Gobain subsidiary Vidrio Andino (Colombia). Within the framework of this partnership, Vidrio Andino would build a new float in Colombia to meet the growing demand for glass in this region.
- In Ocrtober 2018, NSG announced its plan to build a new float glass plant in Argentina. The new plant would support the growing demand for architectural and automotive glass products in Argentina.
Key Questions Addressed by the Report:
- What are the global trends that are increasing the demand for glass curtain walls? Would the market witness an increase or decline in demand in the coming years?
- What is the estimated demand for different systems of glass curtain walls?
- Where will the strategic developments take the industry in the mid- to-long term?
- What are the upcoming industry applications and trends for glass curtain walls?
- Who are the major players in the glass curtain wall market, globally?
Frequently Asked Questions (FAQ):
What are the factors influencing the growth of glass curtain wall?
The growing investment in infrastructural projects, rising demand for green buildings and technological advancements in the glass industry are driving the growth of the market.
What are the types of glass curtain wall?
There are two types of glass curtain wall are available in the market in the form of Unitized curtain wall, stick curtain wall.
Who are the major manufacturers?
The global market for glass curtain wall dominated by prominent players such as Nippon Sheet Glass (Japan), Saint-Gobain (France), Asahi Glass (AGC) (Japan), Guardian Industries (US), AVIC Sanxin Co., Ltd, Inc.(China), Schott AG (Germany), China Glass Holdings Limited (China)), Central Glass Co., Ltd. (Japan), Vitro (Mexico) and Xinyi Glass Holdings Limited (Hong Kong) etc.
What are the factors contributing to the final price of glass curtain wall?
In glass curtain wall, raw material cost contributed about 40-45%, followed by labor and installation cost of around 60-55%.
To speak to our analyst for a discussion on the above findings, click Speak to Analyst
Table of Contents
1 Introduction (Page No. - 18)
1.1 Objectives of the Study
1.2 Market Definition
1.3 Study Scope
1.3.1 Periodization Considered for the Study
1.4 Currency Considered for the Study
1.5 Units Considered
1.6 Stakeholders
2 Research Methodology (Page No. - 21)
2.1 Research Data
2.1.1 Secondary Data
2.1.1.1 Key Data From Secondary Sources
2.1.2 Primary Data
2.1.2.1 Key Data From Primary Sources
2.1.2.2 Key Industry Insights
2.2 Market Size Estimation
2.3 Market Share Estimation
2.4 Data Triangulation
2.5 Research Assumptions & Limitations
2.5.1 Research Assumptions
2.5.2 Limitations
3 Executive Summary (Page No. - 28)
4 Premium Insights (Page No. - 31)
4.1 Developing Economies to Witness Higher Demand for Glass Curtain Wall Systems
4.2 Glass Curtain Wall Market, By System
4.3 Glass Curtain Wall Market, By End Use
4.4 Asia Pacific: Glass Curtain Wall Market, By End Use and Key Country
4.5 Glass Curtain Wall Market: Geographical Snapshot
5 Market Overview (Page No. - 35)
5.1 Introduction
5.2 Market Dynamics
5.2.1 Drivers
5.2.1.1 Growth in Industrial and Commercial Construction Activities
5.2.1.2 Technological Advancements in the Glass Industry
5.2.2 Restraints
5.2.2.1 Government Regulations for Carbon Emissions
5.2.2.2 High Capital Investment Requirement
5.2.3 Opportunities
5.2.3.1 Rise in Demand for Green Buildings
5.2.3.2 Growth in Investment on Infrastructural Projects in Developing Economies
5.2.4 Challenges
5.2.4.1 Production and Installation Requirements of A Complex Structural Glazing
5.2.4.2 Energy-Efficient Manufacturing of Raw Materials
6 Glass Curtain Wall Market, By System (Page No. - 39)
6.1 Introduction
6.2 Unitized
6.2.1 Unitized Curtain Wall Segment to Dominated the Glass Curtain Wall Market in 2017
6.3 Stick
6.3.1 Easier Installation Feature Leads to the Demand for Stick Curtain Wall Systems
7 Glass Curtain Wall Market, By End-Use (Page No. - 42)
7.1 Introduction
7.2 Commercial
7.2.1 Commercial Buildings Segment is Accounted to Lead the Glass Curtain Wall Market
7.3 Public
7.3.1 the Need for Structural Strengthening, Protective Coating, and Protection of Public Buildings Drive the Market for Glass Curtain Wall
7.4 Residential
7.4.1 Aesthetic Appeal, Durability, and Protection of Residential Buildings From Extreme Weather Drives the Market for Curtain Walls System
8 Glass Curtain Wall Market, By Region (Page No. - 46)
8.1 Introduction
8.2 North America
8.2.1 US
8.2.1.1 US is The Largest Country Level Market Glass Curtain Wall Market in North America
8.2.2 Canada
8.2.2.1 Unitized Glass Curtain Wall System is Projected to Grow at Highest Rate Through 2023
8.2.3 Mexico
8.2.3.1 Commercial Segment Accounted for the Largest Market Share and is Projected to Grow at Highest Cagr Through 2023
8.3 Europe
8.3.1 Germany
8.3.1.1 Germany to Lead European Glass Curtain Wall Market
8.3.2 UK
8.3.2.1 Unitized System to Lead the Glass Curtain Wall Market in UK
8.3.3 France
8.3.3.1 The Growing Construction Industry Drives the Demand for Glass Curtain Wall Market in France
8.3.4 Russia
8.3.4.1 The Construction Industry of Russia is A Potential Market for Advanced Glass Curtain Wall Systems
8.3.5 Spain
8.3.5.1 The Demand for Glass Curtain Wall Glass is Expected to Be High for Commercial Construction in Spain
8.3.6 Italy
8.3.6.1 Unitized System to Grow at Highest Rate By 2023
8.3.7 Rest of Europe
8.3.7.1 Rest of Europe is Projected to Witness Moderate Growth
8.4 Asia Pacific
8.4.1 China
8.4.1.1 China is the Largest Country Level Market for Glass Curtain Wall in Asia Pacific Region
8.4.2 Japan
8.4.2.1 The Commercial Sector to Lead the Glass Curtain Wall Market in Japan
8.4.3 Australia
8.4.3.1 Unitized Glass Curtain Wall System is Projected to Grow at Highest Cagr Through 2023
8.4.4 India
8.4.4.1 India is Projected to Grow at Second Highest Cagr in Asia Pacific Glass Curtain Wall Market
8.4.5 South Korea
8.4.5.1 The Commercial Segment to Be the Fastest Growing End-Use for Glass Curtain Wall in South Korea
8.4.6 Vietnam
8.4.6.1 Vietnam is Projected to Witness Moderate Growth in Glass Curtain Wall Market
8.4.7 Thailand
8.4.7.1 The Growing Demand for Commercial Construction in Thailand Will Drive the Market for Glass Curtain Wall Systems
8.4.8 Rest of Asia Pacific
8.4.8.1 Rest of Asia Pacific is Projected to Witness Moderate Growth in Glass Curtain Wall Market
8.5 Middle East & Africa (MEA)
8.5.1 UAE
8.5.1.1 UAE to Be Fastest Growing Country Level Market for Glass Curtain Wall in Middle East & Africa Region
8.5.2 Turkey
8.5.2.1 Turkey to Be the Second Fastest Growing Market in Middle East & Africa, in Terms of Value
8.5.3 Saudi Arabia
8.5.3.1 Increase in Investments in Infrastructural Projects is A Key Factor Driving the Growth of Glass Curtain Wall Market in Saudi Arabia
8.5.4 South Africa
8.5.4.1 Commercial Segment to Drive the Glass Curtain Wall Market in South Africa
8.5.5 Rest of the Middle East & Africa
8.5.5.1 Unitized Segment is Projected to Grow at Highest Rate Through 2023
8.6 South America
8.6.1 Brazil
8.6.1.1 Brazil to Lead Glass Curtain Wall Market in South America
8.6.2 Argentina
8.6.2.1 Increasing Government Expenditure on Industrial, Residential, Commercial, and Infrastructural Construction Projects to Drive the Market of Glass Curtain Wall
8.6.3 Chile
8.6.3.1 Curtain Wall Market in Chile is Driven By the Increase in Number of Construction Projects, and Demand for Energy-Efficient Buildings
8.6.4 Rest of South America
8.6.4.1 Rest of South America to Experience Moderate Growth Rate
9 Competitive Landscape (Page No. - 102)
9.1 Overview
9.2 Competitive Leadership Mapping
9.2.1 Visionary Leaders
9.2.2 Innovators
9.2.3 Dynamic Differentiators
9.2.4 Emerging Companies
9.3 Competitive Scenario
9.3.1 New Product Launches
9.3.2 Partnerships & Agreements
9.3.3 Expansions and Investments
9.3.4 Acquisitions
10 Company Profiles (Page No. - 108)
(Business Overview, Products Offered, Recent Developments, SWOT Analysis & MnM View)*
10.1 Nippon Sheet Glass
10.2 Asahi Glass
10.3 Central Glass
10.4 Saint-Gobain
10.5 Guardian Industries
10.6 Avic Sanxin Co., Ltd
10.7 Schott AG
10.8 China Glass Holdings Limited
10.9 Vitro
10.10 Xinyi Glass Holdings Limited
11 Additional Company Profiles (Page No. - 132)
11.1 Arconic
11.2 Apogee Enterprises Inc.
11.3 Yuanda China Holdings Limited
11.4 Kalwall Corporation
11.5 Heroal
11.6 Hansen Group Ltd.
11.7 Commdoor Aluminum
11.8 Suhuco
11.9 Permasteelisa
11.10 Gutmann
*Details on Business Overview, Products Offered, Recent Developments, SWOT Analysis & MnM View Might Not Be Captured in Case of Unlisted Companies.
12 Appendix (Page No. - 146)
12.1 Discussion Guide
12.2 Knowledge Store: Marketsandmarkets� Subscription Portal
12.3 Available Customizations
12.4 Related Reports
12.5 Author Details
List of Tables (148 Tables)
Table 1 Glass Curtain Wall Market, By System, 2018�2023 (USD Million)
Table 2 Glass Curtain Wall Market, By System, 2018�2023 (Thousand Square Meter) 41
Table 3 Glass Curtain Wall Market, By End-Use, 2018�2023 (USD Million)
Table 4 Glass Curtain Wall Market, By End-Use, 2018�2023 (Thousand Square Meter)
Table 5 Glass Curtain Wall Market Size, By Region, 2016�2023 (USD Million)
Table 6 Glass Curtain Wall Market Size, By Region, 2016�2023 (Thousand Square Meter)
Table 7 North America: Glass Curtain Wall Market Size, By Country, 2016�2023 (USD Million)
Table 8 North America: Glass Curtain Wall Market Size, By Country, 2016�2023 (Thousand Square Meter)
Table 9 North America: Glass Curtain Wall Market Size, By System, 2016�2023 (USD Million)
Table 10 North America: Glass Curtain Wall Market Size, By System, 2016�2023 (Thousand Square Meter)
Table 11 North America: Glass Curtain Wall Market Size, By End Use, 2016�2023 (USD Million)
Table 12 North America: Glass Curtain Wall Market Size, By End Use, 2016�2023 (Thousand Square Meter)
Table 13 US: Glass Curtain Wall Market Size, By System, 2016�2023 (USD Million)
Table 14 US: Glass Curtain Wall Market Size, By System, 2016�2023 (Thousand Square Meter)
Table 15 US: Glass Curtain Wall Market Size, By End Use, 2016�2023 (USD Million)
Table 16 US: Glass Curtain Wall Market Size, By End Use, 2016�2023 (Thousand Square Meter)
Table 17 Canada: Glass Curtain Wall Market Size, By System, 2016�2023 (USD Million)
Table 18 Canada: Glass Curtain Wall Market Size, By System, 2016�2023 (Thousand Square Meter)
Table 19 Canada: Glass Curtain Wall Market Size, By End Use, 2016�2023 (USD Million)
Table 20 Canada: Glass Curtain Wall Market Size, By End Use, 2016�2023 (Thousand Square Meter)
Table 21 Mexico: Glass Curtain Wall Market Size, By System, 2016�2023 (USD Million)
Table 22 Mexico: Glass Curtain Wall Market Size, By System, 2016�2023 (Thousand Square Meter)
Table 23 Mexico: Glass Curtain Wall Market Size, By End Use, 2016�2023 (USD Million)
Table 24 Mexico: Glass Curtain Wall Market Size, By End Use, 2016�2023 (Thousand Square Meter)
Table 25 Europe: Glass Curtain Wall Market Size, By Country, 2016�2023 (USD Million)
Table 26 Europe: Glass Curtain Wall Market Size, By Country, 2016�2023 (Thousand Square Meter)
Table 27 Europe: Glass Curtain Wall Market Size, By System, 2016�2023 (USD Million)
Table 28 Europe: Glass Curtain Wall Market Size, By System, 2016�2023 (Thousand Square Meter)
Table 29 Europe: Glass Curtain Wall Market Size, By End Use, 2016�2023 (USD Million)
Table 30 Europe: Glass Curtain Wall Market Size, By End Use, 2016�2023 (Thousand Square Meter)
Table 31 Germany: Glass Curtain Wall Market Size, By System, 2016�2023 (USD Million)
Table 32 Germany: Glass Curtain Wall Market Size, By System, 2016�2023 (Thousand Square Meter)
Table 33 Germany: Glass Curtain Wall Market Size, By End Use, 2016�2023 (USD Million)
Table 34 Germany: Glass Curtain Wall Market Size, By End Use, 2016�2023 (Thousand Square Meter)
Table 35 UK: Glass Curtain Wall Market Size, By System, 2016�2023 (USD Million)
Table 36 UK: Glass Curtain Wall Market Size, By System, 2016�2023 (Thousand Square Meter)
Table 37 UK: Glass Curtain Wall Market Size, By End Use, 2016�2023 (USD Million)
Table 38 UK : Glass Curtain Wall Market Size, By End Use, 2016�2023 (Thousand Square Meter)
Table 39 France: Glass Curtain Wall Market Size, By System, 2016�2023 (USD Million)
Table 40 France: Glass Curtain Wall Market Size, By System, 2016�2023 (Thousand Square Meter)
Table 41 France: Glass Curtain Wall Market Size, By End Use, 2016�2023 (USD Million)
Table 42 France: Glass Curtain Wall Market Size, By End Use, 2016�2023 (Thousand Square Meter)
Table 43 Russia: Glass Curtain Wall Market Size, By System, 2016�2023 (USD Million)
Table 44 Russia: Glass Curtain Wall Market Size, By System, 2016�2023 (Thousand Square Meter)
Table 45 Russia: Glass Curtain Wall Market Size, By End Use, 2016�2023 (USD Million)
Table 46 Russia: Glass Curtain Wall Market Size, By End Use, 2016�2023 (Thousand Square Meter)
Table 47 Spain: Glass Curtain Wall Market Size, By System, 2016�2023 (USD Million)
Table 48 Spain: Glass Curtain Wall Market Size, By System, 2016�2023 (Thousand Square Meter)
Table 49 Spain: Glass Curtain Wall Market Size, By End Use, 2016�2023 (USD Million)
Table 50 Spain: Glass Curtain Wall Market Size, By End Use, 2016�2023 (Thousand Square Meter)
Table 51 Italy: Glass Curtain Wall Market Size, By System, 2016�2023 (USD Million)
Table 52 Italy: Glass Curtain Wall Market Size, By System, 2016�2023 (Thousand Square Meter)
Table 53 Italy: Glass Curtain Wall Market Size, By End Use, 2016�2023 (USD Million)
Table 54 Italy: Glass Curtain Wall Market Size, By End Use, 2016�2023 (Thousand Square Meter)
Table 55 Rest of Europe: Glass Curtain Wall Market Size, By System, 2016�2023 (USD Million)
Table 56 Rest of Europe: Glass Curtain Wall Market Size, By System, 2016�2023 (Thousand Square Meter)
Table 57 Rest of Europe: Glass Curtain Wall Market Size, By End Use, 2016�2023 (USD Million)
Table 58 Rest of Europe: Glass Curtain Wall Market Size, By End Use, 2016�2023 (Thousand Square Meter)
Table 59 Asia Pacific: Glass Curtain Wall Market Size, By Country, 2016�2023 (USD Million)
Table 60 Asia Pacific: Curtain Wall Market Size, By Country, 2016�2023 (Thousand Square Meter)
Table 61 Asia Pacific: Glass Curtain Wall Market Size, By System, 2016�2023 (USD Million)
Table 62 Asia Pacific: Glass Curtain Wall Market Size, By System, 2016�2023 (Thousand Square Meter)
Table 63 Asia Pacific: Glass Curtain Wall Market Size, By End Use, 2016�2023 (USD Million)
Table 64 Asia Pacific: Glass Curtain Wall Market Size, By End Use, 2016�2023 (Thousand Square Meter)
Table 65 China: Glass Curtain Wall Market Size, By System, 2016�2023 (USD Million)
Table 66 China: Glass Curtain Wall Market Size, By System, 2016�2023 (Thousand Square Meter)
Table 67 China: Glass Curtain Wall Market Size, By End Use, 2016�2023 (USD Million)
Table 68 China: Glass Curtain Wall Market Size, By End Use, 2016�2023 (Thousand Square Meter)
Table 69 Japan: Glass Curtain Wall Market Size, By System, 2016�2023 (USD Million)
Table 70 Japan: Glass Curtain Wall Market Size, By System, 2016�2023 (Thousand Square Meter)
Table 71 Japan: Glass Curtain Wall Market Size, By End Use, 2016�2023 (USD Million)
Table 72 Japan: Glass Curtain Wall Market Size, By End Use, 2016�2023 (Thousand Square Meter)
Table 73 Australia: Glass Curtain Wall Market Size, By System, 2016�2023 (USD Million)
Table 74 Australia: Glass Curtain Wall Market Size, By System, 2016�2023 (Thousand Square Meter)
Table 75 Australia: Glass Curtain Wall Market Size, By End Use, 2016�2023 (USD Million)
Table 76 Australia: Glass Curtain Wall Market Size, By End Use, 2016�2023 (Thousand Square Meter)
Table 77 India: Glass Curtain Wall Market Size, By System, 2016�2023 (USD Million)
Table 78 India: Glass Curtain Wall Market Size, By System, 2016�2023 (Thousand Square Meter)
Table 79 India: Glass Curtain Wall Market Size, By End Use, 2016�2023 (USD Million)
Table 80 India: Glass Curtain Wall Market Size, By End Use, 2016�2023 (Thousand Square Meter)
Table 81 South Korea: Glass Curtain Wall Market Size, By System, 2016�2023 (USD Million)
Table 82 South Korea: Glass Curtain Wall Market Size, By System, 2016�2023 (Thousand Square Meter)
Table 83 South Korea: Glass Curtain Wall Market Size, By End Use, 2016�2023 (USD Million)
Table 84 South Korea: Glass Curtain Wall Market Size, By End Use, 2016�2023 (Thousand Square Meter)
Table 85 Vietnam: Glass Curtain Wall Market Size, By System, 2016�2023 (USD Million)
Table 86 Vietnam: Glass Curtain Wall Market Size, By System, 2016�2023 (Thousand Square Meter)
Table 87 Vietnam: Glass Curtain Wall Market Size, By End Use, 2016�2023 (USD Million)
Table 88 Vietnam: Glass Curtain Wall Market Size, By End Use, 2016�2023 (Thousand Square Meter)
Table 89 Thailand: Glass Curtain Wall Market Size, By System, 2016�2023 (USD Million)
Table 90 Thailand: Glass Curtain Wall Market Size, By System, 2016�2023 (Thousand Square Meter)
Table 91 Thailand: Glass Curtain Wall Market Size, By End Use, 2016�2023 (USD Million)
Table 92 Thailand: Glass Curtain Wall Market Size, By End Use, 2016�2023 (Thousand Square Meter)
Table 93 Rest of Asia Pacific: Glass Curtain Wall Market Size, By System, 2016�2023 (USD Million)
Table 94 Rest of Asia Pacific: Glass Curtain Wall Market Size, By System, 2016�2023 (Thousand Square Meter)
Table 95 Rest of Asia Pacific: Glass Curtain Wall Market Size, By End Use, 2016�2023 (USD Million)
Table 96 Rest of Asia Pacific: Glass Curtain Wall Market Size, By End Use, 2016�2023 (Thousand Square Meter)
Table 97 Middle East & Africa: Glass Curtain Wall Market Size, By Country, 2016�2023 (USD Million)
Table 98 Middle East & Africa: Glass Curtain Wall Market Size, By Country, 2016�2023 (Thousand Square Meter)
Table 99 Middle East & Africa: Glass Curtain Wall Market Size, By System, 2016�2023 (USD Million)
Table 100 Middle East & Africa: Glass Curtain Wall Market Size, By System, 2016�2023 (Thousand Square Meter)
Table 101 Middle East & Africa: Glass Curtain Wall Market Size, By End Use, 2016�2023 (USD Million)
Table 102 Middle East & Africa: Glass Curtain Wall Market Size, By End Use, 2016�2023 (Thousand Square Meter)
Table 103 UAE: Glass Curtain Wall Market Size, By System, 2016�2023 (USD Million)
Table 104 UAE: Glass Curtain Wall Market Size, By System, 2016�2023 (Thousand Square Meter)
Table 105 UAE: Glass Curtain Wall Market Size, By End Use, 2016�2023 (USD Million)
Table 106 UAE: Glass Curtain Wall Market Size, By End Use, 2016�2023 (Thousand Square Meter)
Table 107 Turkey: Glass Curtain Wall Market Size, By System, 2016�2023 (USD Million)
Table 108 Turkey: Glass Curtain Wall Market Size, By System, 2016�2023 (Thousand Square Meter)
Table 109 Turkey: Glass Curtain Wall Market Size, By End Use, 2016�2023 (USD Million)
Table 110 Turkey: Glass Curtain Wall Market Size, By End Use, 2016�2023 (Thousand Square Meter)
Table 111 Saudi Arabia: Glass Curtain Wall Market Size, By System, 2016�2023 (USD Million)
Table 112 Saudi Arabia: Glass Curtain Wall Market Size, By System, 2016�2023 (Thousand Square Meter)
Table 113 Saudi Arabia: Glass Curtain Wall Market Size, By End Use, 2016�2023 (USD Million)
Table 114 Saudi Arabia: Glass Curtain Wall Market Size, By End Use, 2016�2023 (Thousand Square Meter)
Table 115 South Africa: Glass Curtain Wall Market Size, By System, 2016�2023 (USD Million)
Table 116 South Africa: Glass Curtain Wall Market Size, By System, 2016�2023 (Thousand Square Meter)
Table 117 South Africa: Glass Curtain Wall Market Size, By End Use, 2016�2023 (USD Million)
Table 118 South Africa: Glass Curtain Wall Market Size, By End Use, 2016�2023 (Thousand Square Meter)
Table 119 Rest of the Middle East & Africa: Glass Curtain Wall Market Size, By System, 2016�2023 (USD Million)
Table 120 Rest of the Middle East & Africa: Glass Curtain Wall Market Size, By System, 2016�2023 (Thousand Square Meter)
Table 121 Rest of the Middle East & Africa: Glass Curtain Wall Market Size, By End Use, 2016�2023 (USD Million)
Table 122 Rest of the Middle East & Africa: Glass Curtain Wall Market Size, By End Use, 2016�2023 (Thousand Square Meter)
Table 123 South America: Curtain Wall Market Size, By Country, 2016-2023 (USD Million)
Table 124 South America: Curtain Wall Market Size, By Country, 2016-2023 (Thousand Square Meters)
Table 125 South America: Curtain Wall Market Size, By System, 2016-2023 (USD Million)
Table 126 South America: Curtain Wall Market Size, By System, 2016-2023 (Thousand Square Meters)
Table 127 South America: Curtain Wall Market Size, By End-Use, 2016�2023 (USD Million)
Table 128 South America: Curtain Wall Market Size, By End-Use, 2016�2023 (Thousand Square Meters)
Table 129 Brazil: Curtain Wall Market Size, By System, 2016-2023 (USD Million)
Table 130 Brazil: Curtain Wall Market Size, By System, 2016-2023 (Thousand Square Meters)
Table 131 Brazil: Curtain Wall Market Size, By End-Use, 2016�2023 (USD Million)
Table 132 Brazil: Curtain Wall Market Size, By End-Use, 2016�2023 (Thousand Square Meters)
Table 133 Argentina: Curtain Wall Market Size, By System, 2016-2023 (USD Million)
Table 134 Argentina: Curtain Wall Market Size, By System, 2016-2023 (Thousand Square Meters)
Table 135 Argentina: Curtain Wall Market Size, By End-Use, 2016�2023 (USD Million)
Table 136 Argentina: Curtain Wall Market Size, By End-Use, 2016�2023 (Thousand Square Meters)
Table 137 Chile: Curtain Wall Market Size, By System, 2016-2023 (USD Million)
Table 138 Chile: Curtain Wall Market Size, By System, 2016-2023 (Thousand Square Meters)
Table 139 Chile: Curtain Wall Market Size, By End Use, 2016�2023 (USD Million)
Table 140 Chile: Curtain Wall Market Size, By End Use, 2016�2023 (Thousand Square Meters)
Table 141 Rest of South America: Curtain Wall Market Size, By System, 2016-2023 (USD Million)
Table 142 Rest of South America: Curtain Wall Market Size, By System, 2016-2023 (Thousand Square Meters)
Table 143 Rest of South America: Curtain Wall Market Size, By End-Use, 2016�2023 (USD Million)
Table 144 Rest of South America: Curtain Wall Market Size, By End-Use, 2016�2023 (Thousand Square Meters)
Table 145 New Product Launches, 2014
Table 146 Partnerships & Agreements, 2015-2019
Table 147 Expansions and Investments, 2017-2019
Table 148 Acquisitions, 2015-2017
List of Figures (33 Figures)
Figure 1 Glass Curtain Wall Market Segmentation
Figure 2 Glass Curtain Wall Market: Research Design
Figure 3 Breakdown of Primaries
Figure 4 Market Size Estimation Methodology: Bottom-Up Approach
Figure 5 Market Size Estimation Methodology: Top-Down Approach
Figure 6 Glass Curtain Wall Market: Data Triangulation
Figure 7 Unitized Segment to Grow at the Highest Rate During the Forecast Period
Figure 8 Commercial Segment to Lead the Market for Glass Curtain Wall Systems Through 2023
Figure 9 Asia Pacific Dominated the Glass Curtain Wall Market in 2017
Figure 10 Emerging Economies Offer Growth Opportunities to the Glass Curtain Wall Market
Figure 11 Unitized Glass Curtain Wall Systems to Account for the Largest Share During the Forecast Period
Figure 12 Commercial Buildings Segment to Lead the Market Through 2023
Figure 13 The Commercial Segment Captured the Largest Share in Asia Pacific in 2017
Figure 14 Market in China Projected to Grow at the Highest Rate From 2018 to 2023
Figure 15 Drivers, Restraints, Opportunities, and Challenges Inthe Curtain Wall Market
Figure 16 Glass Curtain Wall Market Share, By System, 2018 vs 2023 (USD Million)
Figure 17 Glass Curtain Wall Market Share, By End-Use, 2018 vs 2023 (USD Million)
Figure 18 Geographical Snapshot: Glass Curtain Wall Market Growth Rate, By Country, 2018�2023
Figure 19 Asia Pacific: Glass Curtain Wall Market Snapshot
Figure 20 Companies Adopted Various Growth Strategies From, 2014 to 2019
Figure 21 Glass Curtain Wall Market: Competitive Leadership Mapping, 2017
Figure 22 Nippon Sheet Glass: Company Snapshot
Figure 23 Asahi Glass: Company Snapshot
Figure 24 Central Glass: Company Snapshot
Figure 25 Saint-Gobain: Company Snapshot
Figure 26 Schott AG: Company Snapshot
Figure 27 China Glass Holdings Limited: Company Snapshot
Figure 28 Vitro: Company Snapshot
Figure 29 Xinyi Glass Holdings Limited: Company Snapshot
Figure 30 Arconic: Company Snapshot
Figure 31 Apogee Enterprises Inc.: Company Snapshot
Figure 32 Yuanda China Holdings Limited: Company Snapshot
Figure 33 Permasteelisa: Company Snapshot
The study involved four major activities for estimating the current global size of the glass curtain wall market. The exhaustive secondary research was carried out to collect information on the market, the peer market, and the parent market. The next step was to validate these findings, assumptions and sizes with the industry experts across the value chain of glass curtain wall market through primary research. Both the top-down and bottom-up approaches were employed to estimate the overall size of the glass curtain wall market. Thereafter, market breakdown and data triangulation procedures were used to estimate the size of different segments and subsegments of the market.
Secondary Research
In the secondary research process, various secondary sources such as Hoovers, Bloomberg BusinessWeek, and Dun & Bradstreet were referred to, so as to identify and collect information for the study on the glass curtain wall market. These secondary sources included annual reports, press releases & investor presentations of companies, white papers, certified publications, articles by recognized authors, gold & silver standard websites, regulatory bodies, trade directories, and databases.
Primary Research
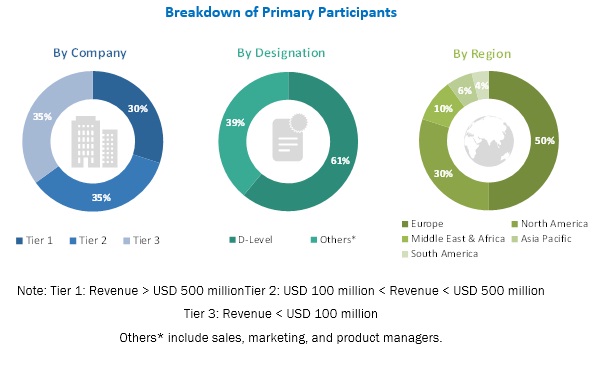
Various primary sources from both the supply- and demand-side of the market were interviewed to obtain qualitative and quantitative information. The primary sources from the supply-side included industry experts such as Chief Executive Officers (CEOs), vice presidents, marketing directors, sales professionals, and related key executives from various key companies and organizations operating in the glass curtain wall market. The primary sources from the demand-side included key executives from the industrial, buildings, and construction companies. The breakdown of the profiles of primary respondents is as follows:
To know about the assumptions considered for the study, download the pdf brochure
Market Size Estimation
Both the top-down and bottom-up approaches were used to estimate and validate the global size of the glass curtain wall market. These approaches were also used extensively to estimate the size of various dependent segments of the market. The research methodology used to estimate the market size included the following details:
- The key players were identified through extensive secondary research.
- The industry�s supply chain and market size, in terms of value, were determined through primary and secondary research processes.
- All percentage shares, splits, and breakdowns were determined using secondary sources and verified through primary sources.
Data Triangulation
After arriving at the overall market size from the estimation process explained above, the total market was split into several segments and subsegments. The data triangulation and market breakdown procedures were employed, wherever applicable, to complete the overall market engineering process and arrive at the exact statistics for all segments and subsegments of the glass curtain wall market. The data was triangulated by studying various factors and trends from both the demand- and supply-side.
Research Objectives
- To define, analyze, and project the size of the glass curtain wall market, in terms of value and volume, based on system, end use, and region.
- To project the size of the market and its segments, in terms of value and volume, with respect to the five main regions, namely, North America, Europe, Asia Pacific, the Middle East & Africa, and South America.
- To provide detailed information about the key factors such as drivers, opportunities, restraints, and challenges influencing the growth of the market.
- To strategically analyze the micromarkets, with respect to individual growth trends, future prospects, and their contribution to the total market.
- To analyze the opportunities in the market for stakeholders and provide a detailed competitive landscape of the market leaders.
- To analyze the competitive developments such as acquisitions, expansions, investments, new product developments, partnerships, and agreements in the glass curtain wall market.
- To strategically profile the key players operating in the market and comprehensively analyze their market shares and core competencies.
Available Customizations
With the given market data, MarketsandMarkets offers customizations according to client-specific needs.
The following customization options are available for the glass curtain wall report:
Product Analysis
- Product matrix, which offers a detailed comparison of the product portfolio of companies
Regional Analysis
- Further analysis of the glass curtain wall market for additional countries
Company Information
- Detailed analysis and profiling of additional market players (up to 5)


Growth opportunities and latent adjacency in Glass Curtain Wall Market