
Glycinates Market by Type (Magnesium, Zinc, Calcium, Manganese, Copper, Sodium), Form (Dry and Liquid), and Application (Pharmaceuticals/Nutraceuticals, Food Additives, Feed Additives, Personal Care Products), and Region - Global Forecast to 2022
Market Segmentation
| Report Metrics | Details |
|
Market size available for years |
2017 - 2022 |
|
CAGR % |
5.89 |
Top 10 companies in Glycinates Market
Glycinates Market News
| Publish Date | Glycinates Market Updates |
|---|---|
| 04-Mar-2024 | Draslovka and Barrick Gold Commence Commercial Use of Glycine Leaching Technology for Gold Mining |
| 12-Oct-2023 | Effect of water stress and foliar application of chitosan and glycine ... |
| 21-Aug-2023 | "Amazon Elements Chelated Magnesium Glycinate - Vegan, 240 ... |


[131 Pages Report] The glycinates market was valued at USD 878.1 Million in 2016, and is projected to grow at a CAGR of 5.89% from 2017, to reach USD 1,234.3 Million by 2022. The base year considered for the study is 2016, and the forecast period spans from 2017 to 2022. The basic objective of the report is to define, segment, and project the global market size of the glycinates market on the basis of type, form, application, and region. It also helps to understand the structure of the market by identifying its various segments. The other objectives include analyzing the opportunities in the market for stakeholders and providing the competitive landscape of market trends, the supply chain of this market, and projecting the size of this market and its submarkets, in terms of value and volume.
This report includes estimations of the market size in terms of value (USD million) and volume (KT). Both top-down and bottom-up approaches have been used to estimate and validate the size of the global glycinates market and to estimate the size of various other dependent submarkets in the overall market. The key players in the market have been identified through secondary research, some of the sources are press releases, paid databases such as Factiva and Bloomberg, annual reports, and financial journals; their market share in respective regions have also been determined through primary and secondary research. All percentage shares, splits, and breakdowns have been determined using secondary sources and were verified through primary sources. The figure below shows the breakdown of profiles of industry experts that participated in the primary discussions.
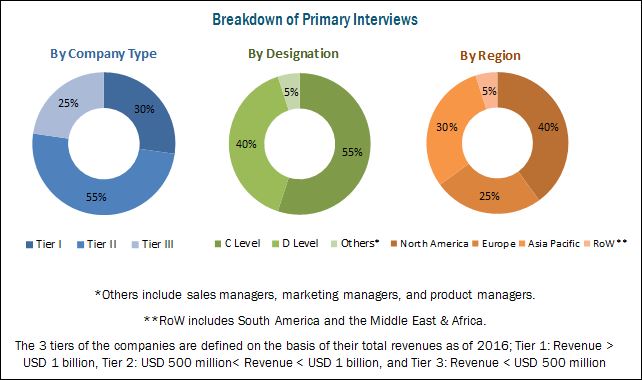
To know about the assumptions considered for the study, download the pdf brochure
Key participants in the glycinates market are the glycinates manufacturers, suppliers, and end users. The key players that are profiled in the report include BASF (Germany), Solvay (Belgium), Ajinomoto (Japan), Clariant (Switzerland), and Albion Laboratories (US). Other players include Shijiazhuang Donghua Jinlong Chemical (China), Galaxy Surfactants (India), Novotech Nutraceuticals (US), Schaumann (Germany), Dunstan Nutrition (New Zealand), Aliphos (Belgium), Chaitanya Chemicals (India), and Provit (Poland).
This report is targeted at the existing players in the industry, which include the following:
- Raw material suppliers
- Glycinate manufacturers/suppliers, importers, and exporters
- Intermediary suppliers
- Consumers\End-user industries
�The study answers several questions for stakeholders, primarily which market segments to focus on in the next two to five years, for prioritizing efforts and investments.�
Scope of the Glycinates Market Report
The Glycinates Market has been segmented as follows:
On the basis of Type, the market has been segmented as follows:
- Magnesium glycinate
- Zinc glycinate
- Calcium glycinate
- Copper glycinate
- Manganese glycinate
- Sodium glycinate
On the basis of Form, the market has been segmented as follows:
- Dry
- Liquid
On the basis of Application, the glycinates market has been segmented as follows:
- Pharmaceuticals/Nutraceuticals
- Food additives
- Feed additives
- Personal care products
On the basis of Region, the market has been segmented as follows:
- North America
- Europe
- Asia Pacific
- RoW (South America and the Middle East & Africa)
Available Customizations
With the given market data, MarketsandMarkets offers customizations according to the company�s specific needs.
The following customization options are available for the report:
Segment Analysis
- Product matrix, which gives a detailed comparison of the product portfolio of each company
- Detailed analysis at volume level can also be provided
Regional Analysis
- Further breakdown of the Rest of Asia Pacific glycinates market, by country
- Further breakdown of the Rest of Europe glycinates market, by country
Company Information
- Detailed analysis and profiling of additional market players (up to five)
The glycinates market is estimated to be valued at 927.2 Million in 2017 and is projected to reach a value of USD 1,234.3 Million by 2022, at a CAGR of 5.89% during the forecast period. The global demand for glycinates is increasing significantly due to the growing demand for nutritive food products. The market is further driven by factors such as increasing deficiency of minerals among the population, especially in developing countries such as Brazil, growing demand for chelated minerals in food additives, and growing restrictions on the use of antibiotics in livestock feed.
On the basis of type, the global market was led by the magnesium glycinates segment in 2016. Magnesium plays a vital role in the body's detoxification processes, as magnesium glycinate increases bio-absorbability and has a significant application in dietary supplements.
The glycinates market, on the basis of form, is segmented into dry and liquid. The dry segment is estimated to account for the larger market share; this can be attributed to several benefits associated with this form, including lower costs, along with the convenience of usage in a wide range of applications such as food, feed, pharmaceutical, and personal care.
The global market, based on application, is segmented into pharmaceuticals/nutraceuticals, food additives, feed additives, and personal care products. The feed additives segment covered the largest market share. Increase in the focus of manufacturers on animal feed with increased opportunities in the dairy and meat industries is one of the key factors for the consumption of glycinates in animal feed. Furthermore, incorporation of various ingredients in animal feed by manufacturers for improvement in the quality of meat has increased the demand for glycinates with glycine being the most widely used chelates in the market for chelated feed minerals.
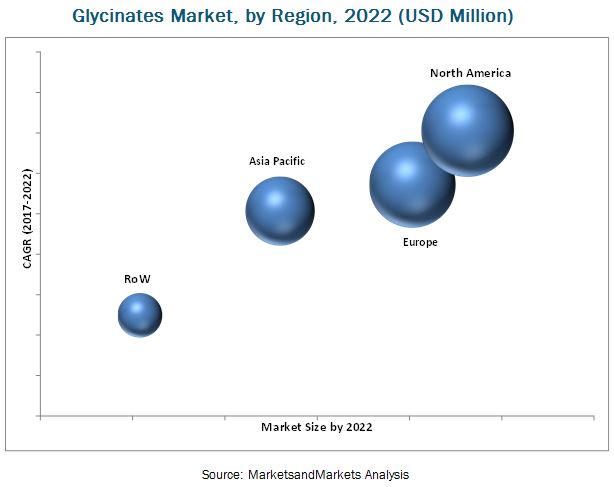
North America is one of the largest markets for feed production, and therefore, a significant amount of glycinates are being consumed in the region. This results in a significant demand for glycinates for the feed application in the region. Europe and Asia Pacific are the dominant regions in the glycinates market. The developed personal care industry has created lucrative opportunities for glycinate manufacturers in Europe with the presence of major players such as Solvay and Clariant operating in the personal care space, to cater to the increasing demand for personal care products in the region. Furthermore, major countries contributing significantly toward the growth of the Asia Pacific region include China, Japan, India, and Australia & New Zealand. The increasing demand for animal products in developing countries contributes to the growing demand for glycinates in the Asia Pacific region. The increasing demand for fortified food agents is further expected to further boost the glycinates market in the region.
The major restraining factor for the growth of the glycinates market is the high R&D costs associated with the new product development of chelated mineral glycinates.
Companies such as BASF (Germany), Solvay (Belgium), Ajinomoto (Japan), Clariant (Switzerland), and Albion Laboratories (US) collectively account for a share of more than half of the glycinates market. These companies have a strong presence in Europe and Asia Pacific. They also have manufacturing facilities across these regions and a strong distribution network.
To speak to our analyst for a discussion on the above findings, click Speak to Analyst
Table of Contents
1 Introduction (Page No. - 13)
1.1 Objectives of the Study
1.2 Market Definition
1.3 Market Scope
1.4 Periodization Considered
1.5 Currency Considered
1.6 Unit Considered
1.7 Stakeholders
2 Research Methodology (Page No. - 18)
2.1 Research Data
2.1.1 Secondary Data
2.1.2 Primary Data
2.1.2.1 Breakdown of Primaries
2.2 Market Size Estimation
2.2.1 Bottom-Up Approach
2.2.2 Top-Down Approach
2.3 Data Triangulation
2.4 Research Assumptions & Limitations
2.4.1 Assumptions
2.4.2 Limitations
3 Executive Summary (Page No. - 26)
4 Premium Insights (Page No. - 30)
4.1 Attractive Opportunities in this Market
4.2 Glycinates Market Size, By Application
4.3 Glycinates Market, By Type
4.4 Glycinates Market, By Application & Region
4.5 North American Glycinates Market, By Type & Country
5 Market Overview (Page No. - 34)
5.1 Introduction
5.2 Market Dynamics
5.2.1 Drivers
5.2.1.1 Rising Demand From Supplements & Preventive Healthcare Products Sectors
5.2.1.2 Growth of Feed & Personal Care Industries
5.2.1.3 Increasing Awareness About Precision Nutrition Techniques
5.2.1.4 Mineral Deficiency Among Consumers
5.2.2 Restraints
5.2.2.1 High R&D Costs
5.2.3 Opportunities
5.2.3.1 Growing Demand in Developing Countries
5.2.4 Challenges
5.2.4.1 Fluctuating Raw Material Prices
5.2.4.2 Lack of Awareness in Developing and Underdeveloped Countries
6 Glycinates Market, By Type (Page No. - 43)
6.1 Introduction
6.2 Magnesium Glycinate
6.3 Zinc Glycinate
6.4 Calcium Glycinate
6.5 Copper Glycinate
6.6 Manganese Glycinate
6.7 Sodium Glycinate
6.8 Others
7 Glycinates Market, By Form (Page No. - 53)
7.1 Introduction
7.2 Dry
7.3 Liquid
8 Glycinates Market, By Application (Page No. - 58)
8.1 Introduction
8.2 Pharmaceuticals/Nutraceuticals
8.3 Food Additives
8.4 Feed Additives
8.5 Personal Care Products
8.6 Others
9 Glycinates Market, By Region (Page No. - 66)
9.1 Introduction
9.2 Asia Pacific
9.2.1 China
9.2.2 Japan
9.2.3 India
9.2.4 Australia & New Zealand
9.2.5 Rest of Asia Pacific
9.3 North America
9.3.1 US
9.3.2 Canada
9.3.3 Mexico
9.4 Europe
9.4.1 Germany
9.4.2 France
9.4.3 Spain
9.4.4 UK
9.4.5 Rest of Europe
9.5 RoW
9.5.1 South America
9.5.2 Middle East & Africa
10 Competitive Landscape (Page No. - 93)
10.1 Overview
10.2 Market Ranking Analysis, By Key Players
10.3 Key Market Strategies
10.4 Competitive Scenario
10.4.1 Expansions & Investments
10.4.2 Mergers & Acquisitions
10.4.3 Agreements, Partnerships, Collaborations, and Joint Ventures
11 Company Profiles (Page No. - 100)
(Business Overview, Products Offered, Recent Developments, SWOT Analysis, MnM View)*
11.1 Introduction
11.2 BASF
11.3 Solvay
11.4 Ajinomoto
11.5 Clariant
11.6 Albion Laboratories
11.7 Shijiazhuang Donghua Jinlong Chemical
11.8 Galaxy Surfactants
11.9 Novotech Nutraceuticals
11.10 Schaumann
11.11 Dunstan Nutrition
11.12 Aliphos
11.13 Chaitanya Chemicals
11.14 Provit
*Details on Business Overview, Products Offered, Recent Developments, SWOT Analysis, MnM View Might Not Be Captured in Case of Unlisted Companies.
12 Appendix (Page No. - 123)
12.1 Discussion Guide
12.2 Knowledge Store: Marketsandmarkets� Subscription Portal
12.3 Introducing RT: Real-Time Market Intelligence
12.4 Available Customizations
12.5 Related Reports
12.6 Author Details
List of Tables (89 Tables)
Table 1 US Dollar Exchange Rates Considered for the Study, 2014�2016
Table 2 Per Capita Consumption of Livestock Products Across Regions 1964�2030
Table 3 Glycinates Market Size, By Type, 2015�2022 (USD Million)
Table 4 Market Size for Glycinates, By Type, 2015�2022 (KT)
Table 5 Magnesium Glycinate Market Size, By Region, 2015�2022 (USD Million)
Table 6 Magnesium Glycinate Market Size, By Region, 2015�2022 (KT)
Table 7 Zinc Glycinate Market Size, By Region, 2015�2022 (USD Million)
Table 8 Zinc Glycinate Market Size, By Region, 2015�2022 (KT)
Table 9 Calcium Glycinate Market Size, By Region, 2015�2022 (USD Million)
Table 10 Calcium Glycinate Market Size, By Region, 2015�2022 (KT)
Table 11 Copper Glycinate Market Size, By Region, 2015�2022 (USD Million)
Table 12 Copper Glycinate Market Size, By Region, 2015�2022 (KT)
Table 13 Manganese Glycinate Market Size, By Region, 2015�2022 (USD Million)
Table 14 Manganese Glycinate Market Size, By Region, 2015�2022 (KT)
Table 15 Sodium Glycinate Market Size, By Region, 2015�2022 (USD Million)
Table 16 Sodium Glycinate Market Size, By Region, 2015�2022 (KT)
Table 17 Other Glycinates Market Size, By Region, 2015�2022 (USD Million)
Table 18 Other Glycinate Market Size, By Region, 2015�2022 (KT)
Table 19 Glycinates Market Size, By Form, 2015-2022 (USD Million)
Table 20 Market Size for Glycinates, By Form, 2015-2022 (KT)
Table 21 Dry Glycinates Market Size, By Region, 2015-2022 (USD Million)
Table 22 Market Size for Dry Glycinates, By Region, 2015-2022 (KT)
Table 23 Liquid Glycinates Market Size, By Region, 2015-2022 (USD Million)
Table 24 Market Size for Liquid Glycinates, By Region, 2015-2022 (KT)
Table 25 Glycinates Market Size, By Application, 2015�2022 (USD Million)
Table 26 Glycinate Market Size, By Application, 2015�2022 (KT)
Table 27 Pharmaceuticals/Nutraceuticals: Market Size for Glycinates, By Region, 2015�2022 (USD Million)
Table 28 Pharmaceuticals/Nutraceuticals: Market Size for Glycinates, By Region, 2015�2022 (KT)
Table 29 Food Additives: Glycinates Market Size, By Region, 2015�2022 (USD Million)
Table 30 Food Additives: Market Size, By Region, 2015�2022 (KT)
Table 31 Feed Additives: Market Size, By Region, 2015�2022 (USD Million)
Table 32 Feed Additives: Market Size, By Region, 2015�2022 (KT)
Table 33 Personal Care Products: Glycinates Market Size, By Region, 2015�2022 (USD Million)
Table 34 Personal Care Products: Market Size, By Region, 2015�2022 (KT)
Table 35 Other Applications: Market Size for Glycinates, By Region, 2015�2022 (USD Million)
Table 36 Other Applications: Market Size, By Region, 2015�2022 (KT)
Table 37 Glycinates Market Size, By Region, 2015-2022 (USD Million)
Table 38 Market Size for Glycinates, By Region, 2015-2022 (KT)
Table 39 Asia Pacific: Glycinates Market Size, By Country, 2015�2022 (USD Million)
Table 40 Asia Pacific: Market Size, By Country, 2015�2022 (KT)
Table 41 Asia Pacific: Market Size, By Form, 2015�2022 (USD Million)
Table 42 Asia Pacific: Market Size, By Form, 2015�2022 (KT)
Table 43 China: Market Size for Glycinates, By Form, 2015�2022 (USD Million)
Table 44 China: Market Size, By Form, 2015�2022 (KT)
Table 45 Japan: Glycinate Market Size, By Form, 2015�2022 (USD Million)
Table 46 Japan: Market Size, By Form, 2015�2022 (KT)
Table 47 India: Glycinate Market Size, By Form, 2015�2022 (USD Million)
Table 48 India: Market Size, By Form, 2015�2022 (KT)
Table 49 Australia & New Zealand: Market Size for Glycinates, By Form, 2015�2022 (USD Million)
Table 50 Australia & New Zealand: Market Size, By Form, 2015�2022 (KT)
Table 51 Rest of Asia Pacific: Glycinates Market Size, By Form, 2015�2022 (USD Million)
Table 52 Rest of Asia Pacific: Market Size, By Form, 2015�2022 (KT)
Table 53 North America: Glycinates Market Size, By Country, 2015-2022 (USD Million)
Table 54 North America: Market Size, By Country, 2015-2022 (KT)
Table 55 North America: Market Size, By Form, 2015-2022 (USD Million)
Table 56 North America: Market Size, By Form, 2015-2022 (KT)
Table 57 US: Glycinates Market Size, By Form, 2015-2022 (USD Million)
Table 58 US: Market Size, By Form, 2015-2022 (KT)
Table 59 Canada: Market Size for Glycinates, By Form, 2015-2022 (USD Million)
Table 60 Canada: Market Size, By Form, 2015-2022 (KT)
Table 61 Mexico: Market Size for Glycinates, By Form, 2015-2022 (USD Million)
Table 62 Mexico: Market Size, By Form, 2015-2022 (KT)
Table 63 Europe: Glycinates Market Size, By Country, 2015�2022 (USD Million)
Table 64 Europe: Market Size, By Country, 2015�2022 (KT)
Table 65 Europe: Glycinate Market Size, By Form, 2015�2022 (USD Million)
Table 66 Europe: Market Size, By Form, 2015�2022 (KT)
Table 67 Germany: Market Size for Glycinates, By Form, 2015�2022 (USD Million)
Table 68 Germany: Market Size for Glycinates, By Form, 2015�2022 (KT)
Table 69 France: Market Size for Glycinates, By Form, 2015-2022 (USD Million)
Table 70 France: Market Size for Glycinates, By Form, 2015-2022 (KT)
Table 71 Spain: Market Size for Glycinates, By Form, 2015�2022 (USD Million)
Table 72 Spain: Market Size for Glycinates, By Form, 2015�2022 (KT)
Table 73 UK: Glycinates Market Size, By Form, 2015�2022 (USD Million)
Table 74 UK: Market Size for Glycinates, By Form, 2015�2022 (KT)
Table 75 Rest of Europe: Market Size for Glycinates, By Form, 2015-2022 (USD Million)
Table 76 Rest of Europe: Market Size for Glycinates, By Form, 2015�2022 (KT)
Table 77 RoW: Glycinates Market Size, By Region, 2015�2022 (USD Million)
Table 78 RoW: Market Size for Glycinates, By Region, 2015�2022 (KT)
Table 79 RoW: Market Size for Glycinates, By Form, 2015�2022 (USD Million)
Table 80 RoW: Market Size for Glycinates, By Form, 2015�2022 (KT)
Table 81 South America: Glycinates Market Size, By Form, 2015�2022 (USD Million)
Table 82 South America: Market Size for Glycinates, By Form, 2015�2022 (KT)
Table 83 Middle East & Africa: Market Size for Glycinates, By Form, 2015�2022 (USD Million)
Table 84 Middle East & Africa: Market Size for Glycinates, By Form, 2015�2022 (KT)
Table 85 Key Players in the Global Glycinates Market, 2016
Table 86 Expansions & Investments, 2014�2017
Table 87 New Product Launches, 2014
Table 88 Mergers & Acquisitions, 2016
Table 89 Agreements, Partnerships, Collaborations, and Joint Ventures, 2012�2016
List of Figures (42 Figures)
Figure 1 Market Segmentation
Figure 2 Geographic Segmentation
Figure 3 Glycinates Market: Research Design
Figure 4 Breakdown of Primaries, By Company Type, Designation and Region
Figure 5 Market Size Estimation Methodology: Bottom-Up Approach
Figure 6 Market Size Estimation Methodology: Top-Down Approach
Figure 7 Data Triangulation & Methodology
Figure 8 Glycinates Market Size, By Region, 2016
Figure 9 Glycinate Market Snapshot, By Type, 2017 vs 2022
Figure 10 Glycinates Market Snapshot, By Application, 2017 vs 2022
Figure 11 Glycinate Market Size, By Form, 2017 vs 2022
Figure 12 Increasing Demand From the Feed Application to Drive the Global Market Growth
Figure 13 Feed Additives Application is Estimated to Account for the Largest Share in the Glycinates Market Through 2022
Figure 14 Magnesium Glycinate is Projected to Remain the Largest Market By 2022
Figure 15 Feed Additives Was the Largest Segment Across All Regions in 2016
Figure 16 US Accounted for the Largest Share of the North American Glycinates Market in 2016
Figure 17 Glycinates Market: Drivers, Restraints, Opportunities, and Challenges
Figure 18 Global Feed Production Trend, 2011�2016 (Million Tons)
Figure 19 Regional Feed Production Status, 2016 (Million Ton)
Figure 20 Leading Feed Producers, 2016 (Million Ton)
Figure 21 Global Cosmetics Market Growth, From 2013 to 2016
Figure 22 Global Cosmetics Market Growth, By Geography, 2016
Figure 23 Global Overview Numbers Affected
Figure 24 Fluctuating Price of Zinc and Copper, 2014-2022 (USD/MT)
Figure 25 Glycinates Market Size, By Type, 2017�2022 (USD Million)
Figure 26 Glycinate Market Size, By Form, 2017-2022
Figure 27 Feed Additives Segment Projected to Dominate the Market Through 2022
Figure 28 Geographic Snapshot: US is Showing Strong Signs of Growth in the North American Market, 2017-2022
Figure 29 North America: Market Snapshot
Figure 30 Europe: Market Snapshot
Figure 31 Glycinates Market Developments, By Growth Strategy, 2012�2017
Figure 32 BASF: Company Snapshot
Figure 33 BASF: SWOT Analysis
Figure 34 Solvay: Company Snapshot
Figure 35 Solvay: SWOT Analysis
Figure 36 Ajinomoto: Company Snapshot
Figure 37 Ajinomoto: SWOT Analysis
Figure 38 Clariant: Company Snapshot
Figure 39 Clariant: SWOT Analysis
Figure 40 Albion Laboratories: Company Snapshot
Figure 41 Albion Laboratories: SWOT Analysis
Figure 42 Galaxy Surfactants: Company Snapshot


Growth opportunities and latent adjacency in Glycinates Market