Graph Database Market

Graph Database Market by Type (RDF and LPG), Application (Fraud Detection and Prevention, and Recommendation Engine), Component (Software and Services), Deployment Mode, Vertical, and Region - Global Forecast to 2026

Report Code: TC 6341 Jul, 2021, by marketsandmarkets.com

Updated on : April 18, 2023

Graph Database Market Size & Industry Growth

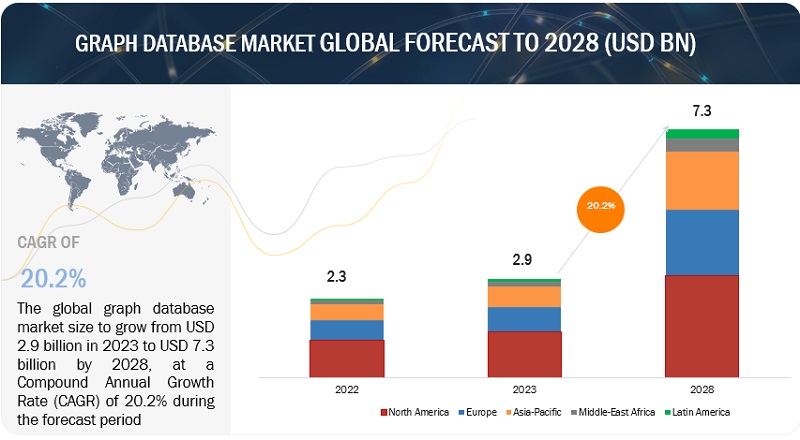
The global graph database market size is projected to grow at a compound annual growth rate (CAGR) of 22.5% to reach USD 5.1 billion in the upcoming five years. The market value was USD 1.9 billion in 2021.

An industry trend analysis of the market is part of the latest research report. The latest research study includes market buying trends, pricing analysis, patent analysis, conference and webinar materials, and important stakeholders. Various factors such as increasing demand for flexible online schema environment and real-time big data mining with visualization are expected to drive the adoption of graph database solutions and services.

Graph Database Market

To know about the assumptions considered for the study, Request for Free Sample Report
COVID-19 Impact

Before March 2020, the COVID-19 epidemic shattered what was deemed normal. All types of organisations required to react promptly. Healthcare organisations needed to plan for and respond to COVID-19 outbreaks. Governments needed to take steps as granting stay-at-home mandates and then reopening local economies. And businesses had to discover strategies to stay afloat in the face of potentially steep income declines. Many firms that have managed to stay afloat are still grappling with the aftermath of the pandemic. Some industries have recovered to some extent, and some businesses have thrived, but others, such as hospitality and tourism, are still seeing major drops in demand from pre-pandemic levels as cases continue to ebb and flow and new forms of the coronavirus emerge. While just a tiny percentage of firms used graph technology to inform decision-making at the start of the epidemic, the speed to insight afforded by graph technology will lead to a considerable increase in graph database adoption.

Graph Database Market Dynamics

Driver: Growing demand for solutions that can process low-latency queries

In graph database market, tools and services are now being broadly adopted, even to the point where some providers of legacy database technologies are trying to implant graph database schemas on top of their existing relational database architectures. While the approach may reduce costs in theory, in reality, it can limit and compromise the performance of the queries launched against the database. When it comes to digital business initiatives, a graph database is transforming the traditional brick-and-mortar companies into digital business powerhouses. Companies face challenges with placing huge amounts of connected data in a database, which is not optimized for any desired purpose. Instead of employing a complex batch process on top of a legacy relational database, companies can use a real-time recommendation system built on top of a graph database capable of processing low-latency queries. It can be used to uniquely query customers’ past purchases during an online visit to match historical and session data in a way that dramatically outperforms traditional relational databases. Graph database gives lower latency. As the nodes and links ‘point’ to one another, millions of related records can be traversed with a constant response time irrespective of database size. Queries are broken into sub-queries, which run concurrently to achieve low-latency and high throughput.

Restraint: Lack of standardization and programming ease

While graph databases are technically NoSQL databases, in practice, they cannot be implemented across a low-cost cluster but have to run on a single machine. This is the reason behind the rapid performance degradation across a network. Another potential drawback is that developers have to write their queries using Java as there is no Standard Query Language (SQL) to retrieve data from graph databases, which means employing expensive programmers or developers have to use SparcQL or one of the other query languages that have been developed to support graph databases, however, it would mean learning a new skill. This results in the lack of standardization and programming ease for graph database systems. In graph database market, there are visualization tools available for graph databases, but they are still in the developing stage.

Opportunity: Emergence of open knowledge networks

Knowledge networks assimilate and integrate knowledge from various domains and must possess datasets, schemes, and documentation to establish usability across applications; support knowledge-intensive applications; and interlink multiple fields for the creation of a cross-domain knowledge network. Applications such as elderly patient care and monitoring necessitate knowledge of biometrics, patient health history, home conditions, and real-time behavior. This is where knowledge networks can interlink multimodal cross-domain information curated from different sources in addition to a personalized knowledge graph for healthcare.

Several knowledge graphs in this knowledge network remain proprietary and are usually expensive for use by academia or researchers. Owing to this scenario, several academia, federal, and industry experts have coined the open knowledge network to establish an open-source infrastructure that links cross-domain information from relevant entities. Such an initiative is aimed at creating an open knowledge graph of all world knowledge represented as entities and relationships. The open knowledge network has been proposed as one of the ten big ideas by the National Science Foundation, US, and is expected to drive the curation of reliable knowledge graphs/networks.

Challenge: Lack of technical expertise

Graph database tools and services provide a conclusive view of large data volumes in real-time. The integration of solutions offers a larger picture to decision-makers and provides actionable insights to boost the overall performance of the systems. Graph database solutions can be customized to enable integration with tools and services, depending on the level and nature of the analysis. Today’s business and user requirements demand applications that connect more and more of the world’s data, expect high levels of performance and data reliability. Graph database engines require a different approach to application development, a custom storage model, and special query tools. Additionally, large enterprises and SMEs need professional services to customize a particular product’s capability to meet the customer’s requirement. Since the graph database concept is in its growing phase, the availability of skilled labor is limited, and this can act as a restraint for graph database market growth. Companies should invest significantly in training and certifications for their workforce to effectively implement the insights received from large data volumes. Additionally, as retail organizations scale up their performance, the need for integrating data from various industry verticals across geographic locations becomes more necessary. The knowledge constraints and inadequate workforce skills may limit end users from adopting graph database software and associated services.

The software segment is expected to account for a larger market size during the forecast period

The component segment has been further divided into software and services. The software segment is expected to account for a larger market size during the forecast period. Software help analyze data generated from IoT devices, sensors, clickstreams, and social media platforms. They provide data results via interactive dashboards. However, services associated with such software form an integral part of the graph database market, ensuring effective use of graph database solutions.

North America to account for the largest market size during the forecast period

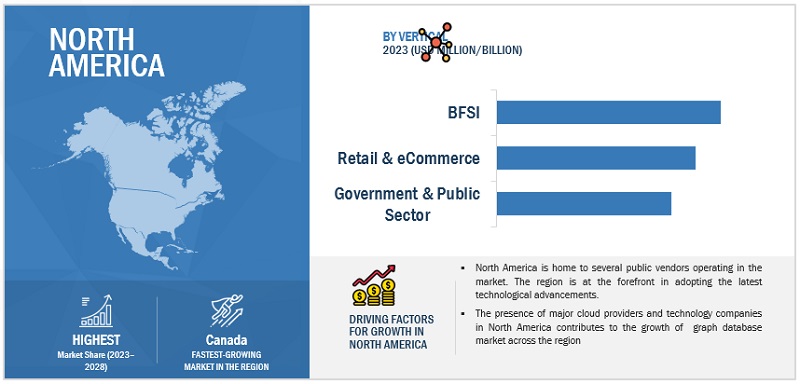
North America is expected to have the largest market share in the graph database market. Key factors favoring the growth of the graph database market in North America include the increasing technological advancements in the region. The growing number of graph database players across regions is expected to further drive market growth.

Graph Database Market by Region

To know about the assumptions considered for the study, download the pdf brochure

Graph Database Market - Key Players

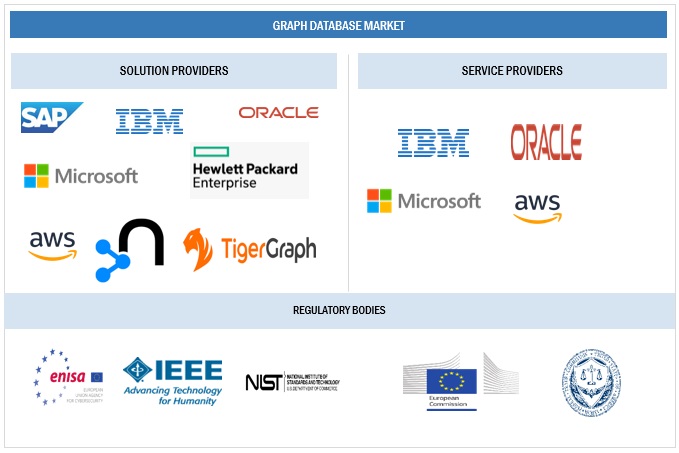
The graph database vendors have implemented various types of organic and inorganic growth strategies, such as new product launches, product upgradations, partnerships and agreements, business expansions, and mergers and acquisitions to strengthen their offerings in the market. The major vendors in the global graph database market include Oracle Corporation (US), IBM Corporation (US), Amazon Web Services, Inc. (US), DataStax (US), Ontotext (Bulgaria), Stardog Union (US), Hewlett Packard Enterprise (US), ArangoDB (US), Blazegraph (US), Microsoft Corporation (US), SAP SE (Germany), Teradata Corporation (US), Openlink Software (US), MarkLogic Corporation (US), TIBCO Software, Inc. (US), Neo4j, Inc. (US), GraphBase (Australia), Cambridge Semantics (US), TigerGraph, Inc. (US), Objectivity Inc. (US), Bitnine Co, Ltd. (US), Franz Inc. (US), Redis Labs (US), Graph Story (US), Dgraph Labs (US), Eccenca (Germany), and Fluree (US). The study includes an in-depth competitive analysis of these key players in the graph database market with their company profiles, recent developments, and key market strategies.

Get online access to the report on the World's First Market Intelligence Cloud

  • Easy to Download Historical Data & Forecast Numbers
  • Company Analysis Dashboard for high growth potential opportunities
  • Research Analyst Access for customization & queries
  • Competitor Analysis with Interactive dashboard
  • Latest News, Updates & Trend analysis
Request Sample

Scope of the Report

Report Metric

Details

Market Size value in 2021

$1.9 billion

Market Size value for 2026

$5.1 billion

Growth Rate

22.5% CAGR

Largest Market

North America

Market size available for years

2015–2026

Base year considered

2020

Forecast period

2022–2026

Forecast units

USD Billion

Market Segmentation

Component, Deployment Mode, Organization Size, Type, Application, Vertical, and Region

Geographies covered

North America, Europe, APAC, MEA, and Latin America

Graph Database Market Drivers

  • Need to incorporate real-time big data mining with visualization of result
  • Growing demand for solutions that can process low-latency queries
  • Adoption of AI-based graph database tools and services to drive the market

Graph Database Market Opportunities

  • Enterprise data unification and rapid proliferation of knowledge graphs
  • Semantic knowledge graphs for addressing complex scientific research
  • Emergence of open knowledge networks

Companies covered

Oracle Corporation (US), IBM Corporation (US), Amazon Web Services, Inc. (US), DataStax (US), Ontotext (Bulgaria), Stardog Union (US), Hewlett Packard Enterprise (US), ArangoDB (US), Blazegraph (US), Microsoft Corporation (US), SAP SE (Germany), Teradata Corporation (US), Openlink Software (US), MarkLogic Corporation (US), TIBCO Software, Inc. (US), Neo4j, Inc. (US), GraphBase (Australia), Cambridge Semantics (US), TigerGraph, Inc. (US), Objectivity Inc. (US), Bitnine Co, Ltd. (US), Franz Inc. (US), Redis Labs (US), Graph Story (US), Dgraph Labs (US), Eccenca (Germany), and Fluree (US).

This research report categorizes the graph database market based on components, type, deployment mode, organization size, application, vertical, and regions.

Graph Database Market By Component:
  • Software
  • Services
    • Professional Services
    • Managed Services
By Deployment Mode:
  • Cloud
  • On-premises
By Organization Size:
  • Large enterprises
  • Small and medium-sized enterprises (SMEs)
By Type
  • RDF
  • Labeled Property Graph
Graph Database Market By Application
  • Customer Analytics
  • Risk, Compliance and Reporting Management
  • Recommendation Engines
  • Fraud Detection and Prevention
  • Supply Chain Management
  • Operations Management and Asset Management
  • Infrastructure Management, IoT, Industry 4.0
  • Knowledge Management
  • Content Management, Data Extraction and Search
  • Metadata and Master Data Management
  • Scientific Data Management
  • Others (Chatbot, digital twin, scientific, Product and Technical Information Management, and Human Capital Management)
By Vertical:
  • BFSI
  • Retail and eCommerce
  • Telecom and IT
  • Healthcare, Pharmaceuticals, and Life Sciences
  • Government and Public Sector
  • Manufacturing and Automotive
  • Media and Entertainment
  • Energy and Utilities
  • Travel and Hospitality
  • Transportation and Logistics
  • Others
By Region:
  • North America
    • US
    • Canada
  • Europe
    • UK
    • Germany
    • France
    • Rest of Europe
  • APAC
    • China
    • Japan
    • AnZ
    • Rest of APAC
  • MEA
    • Middle East
    • Africa
  • Latin America
    • Brazil
    • Mexico
    • Rest of Latin America

Recent Developments in Graph Database Market:

  • In June 2021, NEO4J version 4.3 of the company's graph database was released, including incremental enhancements that showcase prior innovations. The latest version adds relationship chain locking in higher write transaction throughput, graph data science, and parallelized backup, and increased performance through new smart IO scheduling and relationship and relationship property indexes.
  • In April 2021, MANTA, a data lineage platform, announced a strategic partnership with Neo4j to integrate Neo4j's graph database technology directly into MANTA's platform for pipeline analysis. Customers will be able to process increasingly large volumes of data quickly with improved graph database capabilities as companies continue to transition digitally.
  • In April 2021, MarkLogic data hub central, a new low-code/no-code user interface for MarkLogic data hub, has been made generally available by MarkLogic Corporation. Data hub central is compatible with MarkLogic data hub in any environment, on-premises or in the cloud, and is packed with MarkLogic data hub service. It gives enterprises a clear roadmap to cloud modernization by bringing agility and ease of use to the data infrastructure.
  • In March 2021, The Technical University of Denmark (DTU), a leading university in the fields of technical and natural sciences, announced the strategic partnership with TigerGraph's superior graph analytics with machine learning and AI techniques to improve the treatment of acute lymphoblastic leukemia.
  • In October 2020, Microsoft released a new AI system that can caption and describe images. The new AI system helps caption and describe images even better than humans.
  • In May 2020, AWS introduced the general availability of Amazon Kendra. Amazon Kendra is a highly accurate and easy-to-use enterprise search service powered by ML. With just a few clicks, Amazon Kendra uses ML, which enables organizations to index all their internal data sources, makes that data searchable, and enables users to get precise answers to natural language queries.

Frequently Asked Questions (FAQ):

To speak to our analyst for a discussion on the above findings, click Speak to Analyst


TABLE OF CONTENTS

1 INTRODUCTION (Page No. - 29)
    1.1 INTRODUCTION TO COVID-19
    1.2 COVID-19 HEALTH ASSESSMENT
           FIGURE 1 COVID-19: GLOBAL PROPAGATION
           FIGURE 2 COVID-19 PROPAGATION: SELECT COUNTRIES
    1.3 COVID-19 ECONOMIC ASSESSMENT
           FIGURE 3 REVISED GROSS DOMESTIC PRODUCT FORECASTS FOR SELECT G20 COUNTRIES IN 2020
           1.3.1 COVID-19 ECONOMIC IMPACT—SCENARIO ASSESSMENT
                    FIGURE 4 CRITERIA IMPACTING GLOBAL ECONOMY
                    FIGURE 5 SCENARIOS IN TERMS OF RECOVERY OF GLOBAL ECONOMY
    1.4 OBJECTIVES OF THE STUDY
    1.5 MARKET DEFINITION
           1.5.1 INCLUSIONS AND EXCLUSIONS
    1.6 MARKET SCOPE
           1.6.1 MARKET SEGMENTATION
           1.6.2 REGIONS COVERED
           1.6.3 YEARS CONSIDERED FOR THE STUDY
    1.7 CURRENCY CONSIDERED
           TABLE 1 UNITED STATES DOLLAR EXCHANGE RATE, 2018–2020
    1.8 STAKEHOLDERS
    1.9 SUMMARY OF CHANGES

2 RESEARCH METHODOLOGY (Page No. - 40)
    2.1 RESEARCH DATA
           FIGURE 6 GRAPH DATABASE MARKET: RESEARCH DESIGN
           2.1.1 SECONDARY DATA
           2.1.2 PRIMARY DATA
                    TABLE 2 PRIMARY INTERVIEWS
                    2.1.2.1 Breakup of primary profiles
                    2.1.2.2 Key industry insights
    2.2 MARKET BREAKUP AND DATA TRIANGULATION
           FIGURE 7 DATA TRIANGULATION
    2.3 MARKET SIZE ESTIMATION
           FIGURE 8 MARKET: TOP-DOWN AND BOTTOM-UP APPROACHES
           2.3.1 TOP-DOWN APPROACH
           2.3.2 BOTTOM-UP APPROACH
                    FIGURE 9 MARKET SIZE ESTIMATION METHODOLOGY - APPROACH 1 (SUPPLY-SIDE): REVENUE FROM SOFTWARE/SERVICES OF THE MARKET
                    FIGURE 10 MARKET SIZE ESTIMATION METHODOLOGY ? ILLUSTRATION OF COMPANY’S GRAPH DATABASE REVENUE ESTIMATION I
                    FIGURE 11 MARKET SIZE ESTIMATION METHODOLOGY- APPROACH 2, BOTTOM-UP (SUPPLY-SIDE): COLLECTIVE REVENUE FROM ALL SOFTWARE/SERVICES OF THE GRAPH DATABASE MARKET
                    FIGURE 12 MARKET SIZE ESTIMATION METHODOLOGY-APPROACH 3, BOTTOM-UP (SUPPLY-SIDE): COLLECTIVE REVENUE FROM ALL SOFTWARE/SERVICES OF THE MARKET
                    FIGURE 13 MARKET SIZE ESTIMATION METHODOLOGY-APPROACH 4, BOTTOM-UP (DEMAND-SIDE): SHARE OF GRAPH DATABASE THROUGH OVERALL GRAPH DATABASE SPENDING
    2.4 MARKET FORECAST
           TABLE 3 FACTOR ANALYSIS
    2.5 COMPANY EVALUATION MATRIX METHODOLOGY
           FIGURE 14 COMPANY EVALUATION MATRIX: CRITERIA WEIGHTAGE
    2.6 STARTUP/SME EVALUATION MATRIX METHODOLOGY
           FIGURE 15 STARTUP/SME EVALUATION MATRIX: CRITERIA WEIGHTAGE
    2.7 ASSUMPTIONS FOR THE STUDY
    2.8 LIMITATIONS OF THE STUDY
    2.9 IMPLICATIONS OF COVID-19 ON GRAPH DATABASE MARKET
           FIGURE 16 QUARTERLY IMPACT OF COVID-19 DURING 2020–2021

3 EXECUTIVE SUMMARY (Page No. - 56)
    TABLE 4 GLOBAL GRAPH DATABASE MARKET SIZE AND GROWTH RATE, 2015–2020 (USD MILLION, Y-O-Y%)
    TABLE 5 GLOBAL MARKET SIZE AND GROWTH RATE, 2021–2026 (USD MILLION, Y-O-Y%)
    FIGURE 17 SOFTWARE SEGMENT TO HOLD A LARGER MARKET SIZE IN 2021
    FIGURE 18 PROFESSIONAL SERVICES SEGMENT TO HOLD A LARGER MARKET SHARE IN 2021
    FIGURE 19 LABELED PROPERTY GRAPH SEGMENT TO HOLD A LARGER MARKET SIZE IN 2021
    FIGURE 20 ON-PREMISES SEGMENT TO HOLD A LARGER MARKET SIZE IN 2021
    FIGURE 21 LARGE ENTERPRISES SEGMENT TO HOLD A LARGER MARKET SHARE IN 2021
    FIGURE 22 BANKING, FINANCIAL SERVICES, AND INSURANCE VERTICAL TO HOLD THE LARGEST MARKET SIZE IN 2021
    FIGURE 23 FRAUD DETECTION AND PREVENTION SEGMENT TO HOLD THE LARGEST MARKET SIZE IN 2021
    FIGURE 24 NORTH AMERICA TO HOLD THE HIGHEST MARKET SHARE IN 2021

4 PREMIUM INSIGHTS (Page No. - 63)
    4.1 ATTRACTIVE OPPORTUNITIES IN THE GRAPH DATABASE MARKET
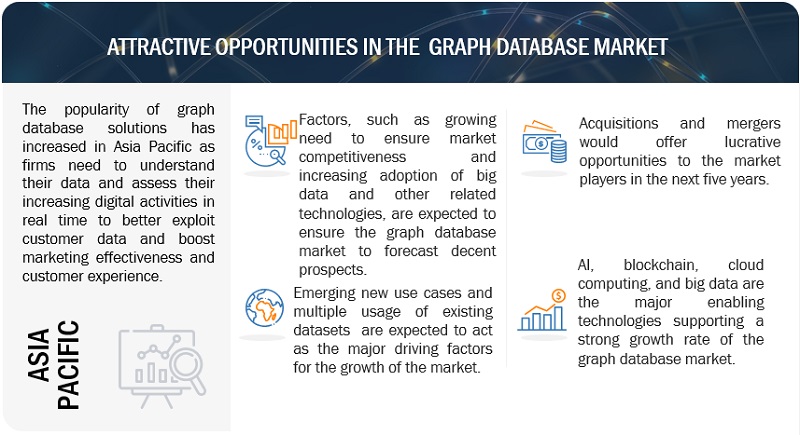
           FIGURE 25 GROWING NEED TO ENSURE MARKET COMPETITIVENESS TO BOOST THE MARKET GROWTH
    4.2 MARKET, BY VERTICAL
           FIGURE 26 BANKING, FINANCIAL SERVICES, AND INSURANCE VERTICAL TO HOLD THE LARGEST MARKET SIZE DURING THE FORECAST PERIOD
    4.3 MARKET, BY REGION
           FIGURE 27 NORTH AMERICA TO HOLD THE LARGEST MARKET SHARE BY 2026
    4.4 MARKET, BY APPLICATION AND VERTICAL
           FIGURE 28 FRAUD DETECTION AND PREVENTION AND BANKING, FINANCIAL SERVICES, AND INSURANCE SEGMENTS TO HOLD THE LARGEST MARKET BY 2026

5 MARKET DYNAMICS (Page No. - 66)
    5.1 MARKET DYNAMICS
           FIGURE 29 DRIVERS, RESTRAINTS, OPPORTUNITIES, AND CHALLENGES: GRAPH DATABASE MARKET
           5.1.1 DRIVERS
                    5.1.1.1 Need to incorporate real-time big data mining with visualization of result
                    5.1.1.2 Growing demand for solutions that can process low-latency queries
                    5.1.1.3 Adoption of AI-based graph database tools and services to drive the market
           5.1.2 RESTRAINT
                    5.1.2.1 Lack of standardization and programming ease
           5.1.3 CHALLENGES
                    5.1.3.1 Lack of technical expertise
           5.1.4 OPPORTUNITY
                    5.1.4.1 Enterprise data unification and rapid proliferation of knowledge graphs
                    5.1.4.2 Semantic knowledge graphs for addressing complex scientific research
                    5.1.4.3 Emergence of open knowledge networks
    5.2 GRAPH DATABASE MARKET TRENDS
           5.2.1 GROWING POPULARITY OF ENTERPRISE KNOWLEDGE GRAPH
           5.2.2 RAPID USE OF VIRTUALIZATION FOR BIG DATA ANALYTICS
           5.2.3 MASSIVE DATA GENERATION ACROSS BFSI, RETAIL, AND MEDIA AND ENTERTAINMENT INDUSTRIES TO DRIVE THE ADOPTION OF GRAPH DATABASE SOFTWARE.
    5.3 CASE STUDY ANALYSIS
           5.3.1 HOW KERBEROS PERFORMED MONEY LAUNDERING PREVENTION AND DEVELOPED A NEW COMPLIANCE MANAGEMENT APPLICATION FOR RISK MANAGEMENT WITH NEO4J
           5.3.2 CREATING A SELF-DESCRIPTIVE REPOSITORY OF GRAPH DATA THAT CAN BE QUERIED IN REAL TIME TO DELIVER CRITICAL ANSWERS TO COMPLEX QUESTIONS AND POWER SMART APPLICATIONS
           5.3.3 HOW KINCARDS USED NEO4J TO REVOLUTIONIZE BUSINESS CARDS
           5.3.4 YAHOO7 TO REPRESENT CONTENT WITHIN A KNOWLEDGE GRAPH AND UNDERSTAND THE FORMAT OF THE CONTENT AND ITS CONTEXT WITH THE HELP OF BLAZEGRAPH
           5.3.5 NEO4J ENABLED PULITZER PRIZE-WINNING INVESTIGATION INTO GLOBAL TAX EVASION TO VISUALIZE AND ANALYZE CONNECTIONS BETWEEN ELEMENTS OF THE PANAMA PAPERS LEAKS
           5.3.6 GRAPH TECHNOLOGY KEEPS THE US ARMY UP AND RUNNING BY TRACKING AND ANALYZING EQUIPMENT MAINTENANCE AFTER EMPLOYING NEO4J
           5.3.7 OBJECTIVE ECM UNDERPINNED CRITICAL HEALTH AND SAFETY PROCESSES IN THE OFFSHORE PETROLEUM INDUSTRY
           5.3.8 REDISGRAPH OFFERED A GREAT MIX OF MATURITY, FEATURE COMPLETENESS, AND INTEROPERABILITY TO THINKDATA
           5.3.9 SPRINGERMATERIALS ACCELERATED RESEARCH WITH SEMANTIC SEARCH
           5.3.10 MEDEANALYTICS DELIVERED HIGH-PERFORMANCE DATABASES CAPABLE OF HANDLING MULTIPLE APPLICATION SCENARIOS USING REDIS ENTERPRISE
           5.3.11 JAGUAR LAND ROVER ACCELERATED SUPPLY CHAIN PLANNING FROM THREE WEEKS TO 45 MINUTES
           5.3.12 MACY'S REDUCES CATALOG DATA REFRESH TIME BY 6X
           5.3.13 METAPHACTS AND ONTOTEXT ENABLE A GLOBAL PHARMA COMPANY TO BOOST R&D KNOWLEDGE DISCOVERY
           5.3.14 HOW RFS OPTIMIZED ITS GLOBAL PRODUCT AND INVENTORY MANAGEMENT BY USING ECCENCA’S SOLUTION
    5.4 REVENUE SHIFT – YC/YCC SHIFT FOR GRAPH DATABASE MARKET
            FIGURE 30 MARKET: YC/YCC SHIFT
    5.5 GRAPH DATABASE: EVOLUTION
    5.6 GRAPH DATABASE: ARCHITECTURE
            FIGURE 31 ARCHITECTURE OF GRAPH DATABASE
    5.7 INVESTMENTS IN ANALYTICS
            TABLE 6 MAJOR INVESTMENTS IN ANALYTICS, 2018–2021
    5.8 ACQUISITIONS IN THE MARKET
            TABLE 7 MAJOR ACQUISITIONS IN THE MARKET BETWEEN 2018 AND 2021
    5.9 PATENT ANALYSIS
           5.9.1 METHODOLOGY
           5.9.2 DOCUMENT TYPE
                    TABLE 8 PATENTS FILED, 2018-2021
           5.9.3 INNOVATION AND PATENT APPLICATIONS
                    FIGURE 32 TOTAL NUMBER OF PATENTS GRANTED IN A YEAR, 2018–2021
                    5.9.3.1 Top applicants
                                FIGURE 33 TOP 10 COMPANIES WITH THE HIGHEST NUMBER OF PATENT APPLICATIONS, 2018–2021
                                TABLE 9 TOP TEN PATENT OWNERS (US) IN THE GRAPH DATABASE MARKET, 2018–2021
    5.10 GRAPH DATABASE: ECOSYSTEM/ VALUE/SUPPLY CHAIN
            FIGURE 34 VALUE/SUPPLY CHAIN OF GRAPH DATABASE
            TABLE 10 MARKET: ECOSYSTEM/VALUE/SUPPLY CHAIN
    5.11 PRICING MODEL ANALYSIS
    5.12 TECHNOLOGY ANALYSIS
           5.12.1 ARTIFICIAL INTELLIGENCE (AI), MACHINE LEARNING (ML), AND GRAPH DATABASE
           5.12.2 CLOUD COMPUTING AND GRAPH DATABASE
           5.12.3 ANALYTICS AND GRAPH DATABASE
           5.12.4 IOT AND GRAPH DATABASE
    5.13 PORTER’S FIVE FORCES ANALYSIS
            FIGURE 35 MARKET: PORTER’S FIVE FORCES ANALYSIS
            TABLE 11 GRAPH DATABASE MARKET: PORTER’S FIVE FORCES ANALYSIS
           5.13.1 THREAT OF NEW ENTRANTS
           5.13.2 THREAT OF SUBSTITUTES
           5.13.3 BARGAINING POWER OF SUPPLIERS
           5.13.4 BARGAINING POWER OF BUYERS
           5.13.5 INTENSITY OF COMPETITIVE RIVALRY
    5.14 REGULATORY IMPLICATIONS
           5.14.1 GENERAL DATA PROTECTION REGULATION
           5.14.2 THE INTERNATIONAL ORGANIZATION FOR STANDARDIZATION 27001
           5.14.3 EU DATA GOVERNANCE ACT
           5.14.4 HEALTH INSURANCE PORTABILITY AND ACCOUNTABILITY ACT OF 1996
           5.14.5 BASEL COMMITTEE ON BANKING SUPERVISION 239 COMPLIANCE
           5.14.6 SARBANES-OXLEY ACT OF 2002

6 GRAPH DATABASE MARKET: COVID-19 IMPACT (Page No. - 94)
    FIGURE 36 MARKET – PRE-COVID AND POST-COVID

7 GRAPH DATABASE MARKET, BY COMPONENT (Page No. - 95)
    7.1 INTRODUCTION
           7.1.1 COMPONENT: MARKET DRIVERS
           7.1.2 COMPONENT: COVID-19 IMPACT
                    FIGURE 37 SERVICES SEGMENT TO GROW AT A HIGHER CAGR DURING THE FORECAST PERIOD
                    TABLE 12 MARKET SIZE, BY COMPONENT, 2015–2020 (USD MILLION)
                    TABLE 13 MARKET SIZE, BY COMPONENT, 2021–2026 (USD MILLION)
    7.2 SOFTWARE
           7.2.1 DEMAND TO HARNESS PRECISE AND IN-DEPTH DATA CONNECTIONS TO DRIVE THE ADOPTION OF GRAPH DATABASE SOFTWARE
                    TABLE 14 SOFTWARE: MARKET SIZE, BY REGION, 2015–2020 (USD MILLION)
                    TABLE 15 SOFTWARE: MARKET SIZE, BY REGION, 2021–2026 (USD MILLION)
    7.3 SERVICES
           FIGURE 38 MANAGED SERVICES SEGMENT TO GROW AT A HIGHER CAGR DURING THE FORECAST PERIOD
             TABLE 16 MARKET SIZE, BY SERVICE, 2015–2020 (USD MILLION)
             TABLE 17 MARKET SIZE, BY SERVICE, 2021–2026 (USD MILLION)
             TABLE 18 SERVICES: GRAPH DATABASE SERVICES MARKET SIZE, BY REGION, 2015–2020 (USD MILLION)
             TABLE 19 SERVICES: GRAPH DATABASE MARKET SIZE, BY REGION, 2021–2026 (USD MILLION)
           7.3.1 MANAGED SERVICES
                    7.3.1.1 Increasing need for monitoring and maintaining tool operations and reducing overhead costs to drive the growth of managed services in the market.
                                TABLE 20 MANAGED SERVICES: MARKET SIZE, BY REGION, 2015–2020 (USD MILLION)
                                TABLE 21 MANAGED SERVICES: MARKET SIZE, BY REGION, 2021–2026 (USD MILLION)
           7.3.2 PROFESSIONAL SERVICES
                    FIGURE 39 SUPPORT AND MAINTENANCE SERVICES SEGMENT TO GROW AT THE HIGHEST CAGR DURING THE FORECAST PERIOD
                    TABLE 22 PROFESSIONAL SERVICES: MARKET SIZE, BY REGION, 2015–2020 (USD MILLION)
                    TABLE 23 PROFESSIONAL SERVICES: MARKET SIZE, BY REGION, 2021–2026 (USD MILLION)
                    TABLE 24 MARKET SIZE, BY PROFESSIONAL SERVICE, 2015–2020 (USD MILLION)
                    TABLE 25 MARKET SIZE, BY PROFESSIONAL SERVICE, 2021–2026 (USD MILLION)
                    7.3.2.1 Consulting services
                               7.3.2.1.1 Technicalities involved in implementing graph database tools and services to boost the growth of consulting services
                                             TABLE 26 CONSULTING SERVICES: GRAPH DATABASE MARKET SIZE, BY REGION, 2015–2020 (USD MILLION)
                                             TABLE 27 CONSULTING SERVICES: MARKET SIZE, BY REGION, 2021–2026 (USD MILLION)
                    7.3.2.2 Deployment and integration services
                               7.3.2.2.1 Growing need to overcome system-related issues effectively to drive deployment and integration services
                                             TABLE 28 DEPLOYMENT AND INTEGRATION SERVICES: MARKET SIZE, BY REGION, 2015–2020 (USD MILLION)
                                             TABLE 29 DEPLOYMENT AND INTEGRATION SERVICES: MARKET SIZE, BY REGION, 2021–2026 (USD MILLION)
                    7.3.2.3 Support and maintenance services
                               7.3.2.3.1 Growing deployment of graph database software to drive the demand for support and maintenance services
                                             TABLE 30 SUPPORT AND MAINTENANCE SERVICES: MARKET SIZE, BY REGION, 2015–2020 (USD MILLION)
                                             TABLE 31 SUPPORT AND MAINTENANCE SERVICES: MARKET SIZE, BY REGION, 2021–2026 (USD MILLION)

8 GRAPH DATABASE MARKET, BY TYPE (Page No. - 107)
    8.1 INTRODUCTION
           FIGURE 40 RESOURCE DESCRIPTION FRAMEWORK SEGMENT TO GROW AT A HIGHER CAGR DURING THE FORECAST PERIOD
           TABLE 32 MARKET SIZE, BY TYPE, 2015–2020 (USD MILLION)
           TABLE 33 MARKET SIZE, BY TYPE, 2021–2026 (USD MILLION)
    8.2 RESOURCE DESCRIPTION FRAMEWORK
           8.2.1 DEMAND FOR INTELLIGENT DATA MANAGEMENT SOLUTIONS TO DRIVE THE GROWTH OF RESOURCE DESCRIPTION FRAMEWORK IN THE MARKET
                    TABLE 34 RESOURCE DESCRIPTION FRAMEWORK: MARKET SIZE, BY REGION, 2015–2020 (USD MILLION)
                    TABLE 35 RESOURCE DESCRIPTION FRAMEWORK: MARKET SIZE, BY REGION, 2021–2026 (USD MILLION)
    8.3 LABELED PROPERTY GRAPH
           8.3.1 INCREASING DEMAND TO FIND RELATIONSHIPS AMONG NUMEROUS ENTITIES TO BOOST THE LABELED PROPERTY GRAPH SEGMENT GROWTH
                    TABLE 36 LABELED PROPERTY GRAPH: MARKET SIZE, BY REGION, 2015–2020 (USD MILLION)
                    TABLE 37 LABELED PROPERTY GRAPH: MARKET SIZE, BY REGION, 2021–2026 (USD MILLION)

9 GRAPH DATABASE MARKET, BY DEPLOYMENT MODE (Page No. - 112)
    9.1 INTRODUCTION
           9.1.1 DEPLOYMENT MODE: COVID-19 IMPACT
           9.1.2 DEPLOYMENT MODE: OPERATIONAL DRIVERS
                    FIGURE 41 CLOUD DEPLOYMENT MODE TO GROW AT THE HIGHEST CAGR DURING THE FORECAST PERIOD
                    TABLE 38 MARKET SIZE, BY DEPLOYMENT MODE, 2015–2020 (USD MILLION)
                    TABLE 39 MARKET SIZE, BY DEPLOYMENT MODE, 2021–2026 (USD MILLION)
    9.2 CLOUD
           9.2.1 REDUCED OPERATIONAL COST AND HIGHER SCALABILITY TO ENABLE GROWTH IN CLOUD-BASED DEPLOYMENTS
                    TABLE 40 CLOUD: MARKET SIZE, BY REGION, 2015–2020 (USD MILLION)
                    TABLE 41 CLOUD : MARKET SIZE, BY REGION, 2021–2026 (USD MILLION)
    9.3 ON-PREMISES
           9.3.1 WITH GROWING THREAT OF DATA THEFT, ORGANIZATIONS TO PREFER GRAPH DATABASE SOLUTIONS TO REMAIN ON-PREMISES
                    TABLE 42 ON-PREMISES: MARKET SIZE, BY REGION, 2015–2020 (USD MILLION)
                    TABLE 43 ON-PREMISES: MARKET SIZE, BY REGION, 2021–2026 (USD MILLION)

10 GRAPH DATABASE MARKET, BY ORGANIZATION SIZE (Page No. - 117)
     10.1 INTRODUCTION
             10.1.1 ORGANIZATION SIZE: COVID-19 IMPACT
             10.1.2 ORGANIZATION SIZE: OPERATIONAL DRIVERS
                       FIGURE 42 LARGE ENTERPRISES TO HOLD A LARGER MARKET SIZE DURING THE FORECAST PERIOD
                       TABLE 44 MARKET SIZE, BY ORGANIZATION SIZE, 2015–2020 (USD MILLION)
                       TABLE 45 MARKET SIZE, BY ORGANIZATION SIZE, 2021–2026 (USD MILLION)
     10.2 LARGE ENTERPRISES
             10.2.1 ADVANCES IN GRAPH TECHNOLOGY AND CLOUD ADOPTION TO DRIVE THE MARKET ACROSS LARGE ENTERPRISES
                       TABLE 46 LARGE ENTERPRISES: MARKET SIZE, BY REGION, 2015–2020 (USD MILLION)
                       TABLE 47 LARGE ENTERPRISES: MARKET SIZE, BY REGION, 2021–2026 (USD MILLION)
     10.3 SMALL AND MEDIUM-SIZED ENTERPRISES
             10.3.1 ROBUST CLOUD-BASED DEPLOYMENTS TO LEAD SMALL AND MEDIUM-SIZED ENTERPRISES TO RECORD A HIGHER GROWTH RATE AND COST-EFFECTIVE SOLUTIONS
                       TABLE 48 SMALL AND MEDIUM-SIZED ENTERPRISES: MARKET SIZE, BY REGION, 2015–2020 (USD MILLION)
                       TABLE 49 SMALL AND MEDIUM-SIZED ENTERPRISES: MARKET SIZE, BY REGION, 2021–2026 (USD MILLION)

11 GRAPH DATABASE MARKET, BY APPLICATION (Page No. - 122)
     11.1 INTRODUCTION
             11.1.1 APPLICATIONS: COVID-19 IMPACT
             11.1.2 APPLICATIONS: MARKET DRIVERS
     11.2 GRAPH DATABASE: ENTERPRISE USE CASES
             FIGURE 43 FRAUD DETECTION APPLICATION TO HOLD THE LARGEST MARKET SIZE DURING THE FORECAST PERIOD
             TABLE 50 MARKET SIZE, BY APPLICATION, 2015–2020 (USD MILLION)
             TABLE 51 MARKET SIZE, BY APPLICATION, 2021–2026 (USD MILLION)
     11.3 CUSTOMER ANALYTICS
             11.3.1 GROWING DEMAND TO UNDERSTAND CUSTOMER BUYING BEHAVIOR FOR KEY BUSINESS DECISIONS TO DRIVE THE MARKET
                       TABLE 52 CUSTOMER ANALYTICS: MARKET SIZE, BY REGION, 2015–2020 (USD MILLION)
                       TABLE 53 CUSTOMER ANALYTICS: MARKET SIZE, BY REGION, 2021–2026 (USD MILLION)
     11.4 RISK, COMPLIANCE, AND REPORTING MANAGEMENT
             11.4.1 DEMAND TO SECURE CUSTOMERS’ DATA AND MEET STRINGENT REGULATORY COMPLIANCE TO PAVE THE WAY FOR THE ADOPTION OF GRAPH DATABASE
                       TABLE 54 RISK, COMPLIANCE, AND REPORTING MANAGEMENT: GRAPH DATABASE MARKET SIZE, BY REGION, 2015–2020 (USD MILLION)
                       TABLE 55 RISK, COMPLIANCE, AND REPORTING MANAGEMENT: MARKET SIZE, BY REGION, 2021–2026 (USD MILLION)
     11.5 RECOMMENDATION ENGINES
             11.5.1 INCREASING NEED TO PROVIDE EFFICIENT, ACCURATE, AND PERSONALIZED SERVICES TO RETAIN THE CUSTOMERS AND ENHANCE THEIR SHOPPING EXPERIENCE
                       TABLE 56 RECOMMENDATION ENGINE: MARKET SIZE, BY REGION, 2015–2020 (USD MILLION)
                       TABLE 57 RECOMMENDATION ENGINE: MARKET SIZE, BY REGION, 2021–2026 (USD MILLION)
     11.6 FRAUD DETECTION AND PREVENTION
             11.6.1 GROWING FOCUS ON MITIGATING RISKS AND REDUCING LOSS TO DRIVE THE ADOPTION OF GRAPH DATABASE TOOLS AND SERVICES
                       TABLE 58 FRAUD DETECTION AND PREVENTION: MARKET SIZE, BY REGION, 2015–2020 (USD MILLION)
                       TABLE 59 FRAUD DETECTION AND PREVENTION : MARKET SIZE, BY REGION, 2021–2026 (USD MILLION)
     11.7 SUPPLY CHAIN MANAGEMENT
             11.7.1 DEMAND TO TRACK INVENTORY LEVELS AND SHIPMENTS TO FUEL THE GROWTH OF GRAPH DATABASE TOOLS AND SERVICES IN SUPPLY CHAIN MANAGEMENT
                       TABLE 60 SUPPLY CHAIN MANAGEMENT: GRAPH DATABASE MARKET SIZE, BY REGION, 2015–2020 (USD MILLION)
                       TABLE 61 SUPPLY CHAIN MANAGEMENT: MARKET SIZE, BY REGION, 2021–2026 (USD MILLION)
     11.8 OPERATIONS MANAGEMENT AND ASSET MANAGEMENT
             11.8.1 MARKET: DRIVERS AND OPPORTUNITIES; ASSET MANAGEMENT
                       TABLE 62 OPERATIONS MANAGEMENT AND ASSET MANAGEMENT: MARKET SIZE, BY REGION, 2015–2020 (USD MILLION)
                       TABLE 63 OPERATIONS MANAGEMENT AND ASSET MANAGEMENT: MARKET SIZE, BY REGION, 2021–2026 (USD MILLION)
     11.9 IOT, INFRASTRUCTURE MANAGEMENT, AND INDUSTRY 4.0
             11.9.1 WITH ADVANCEMENTS IN TECHNOLOGIES, SUCH AS IOT, INFRASTRUCTURE MANAGEMENT, AND INDUSTRY 4.0, THE USE OF GRAPH DATABASE TECHNOLOGY IS ON THE RISE
                       TABLE 64 IOT, INFRASTRUCTURE MANAGEMENT, AND INDUSTRY 4.0: MARKET SIZE, BY REGION, 2015–2020 (USD MILLION)
                       TABLE 65 IOT, INFRASTRUCTURE MANAGEMENT, AND INDUSTRY 4.0: MARKET SIZE, BY REGION, 2021–2026 (USD MILLION)
     11.10 KNOWLEDGE MANAGEMENT
             11.10.1 DEMAND TO TRACK INVENTORY LEVELS AND SHIPMENTS TO FUEL THE GROWTH OF GRAPH DATABASE TOOLS AND SERVICES IN SUPPLY CHAIN MANAGEMENT
                        TABLE 66 KNOWLEDGE MANAGEMENT: GRAPH DATABASE MARKET SIZE, BY REGION, 2015–2020 (USD MILLION)
                        TABLE 67 KNOWLEDGE MANAGEMENT: MARKET SIZE, BY REGION, 2021–2026 (USD MILLION)
     11.11 CONTENT MANAGEMENT, DATA EXTRACTION, AND SEARCH
             11.11.1 NEED TO GAIN INSIGHTS IN REAL TIME TO FUEL THE GROWTH OF GRAPH DATABASE SOLUTIONS
                        TABLE 68 CONTENT MANAGEMENT, DATA EXTRACTION, AND SEARCH: MARKET SIZE, BY REGION, 2015–2020 (USD MILLION)
                        TABLE 69 CONTENT MANAGEMENT, DATA EXTRACTION, AND SEARCH: MARKET SIZE, BY REGION, 2021–2026 (USD MILLION)
     11.12 METADATA AND MASTERDATA MANAGEMENT
             11.12.1 NEED TO CREATE A CENTRAL VIEW OF DATA ASSETS TO DRIVE THE GROWTH OF GRAPH DATABASE SOLUTIONS
                        TABLE 70 METADATA AND MASTER DATA MANAGEMENT: MARKET SIZE, BY REGION, 2015–2020 (USD MILLION)
                        TABLE 71 METADATA AND MASTER DATA MANAGEMENT: MARKET SIZE, BY REGION, 2021–2026 (USD MILLION)
     11.13 SCIENTIFIC DATA MANAGEMENT
              TABLE 72 SCIENTIFIC DATA MANAGEMENT: GRAPH DATABASE MARKET SIZE, BY REGION, 2015–2020 (USD MILLION)
              TABLE 73 SCIENTIFIC DATA MANAGEMENT: MARKET SIZE, BY REGION, 2021–2026 (USD MILLION)
     11.14 OTHER APPLICATIONS
              TABLE 74 OTHER APPLICATIONS: MARKET SIZE, BY REGION, 2015–2020 (USD MILLION)
              TABLE 75 OTHER APPLICATIONS: MARKET SIZE, BY REGION, 2021–2026 (USD MILLION)

12 GRAPH DATABASE MARKET, BY VERTICAL (Page No. - 144)
     12.1 INTRODUCTION
             12.1.1 VERTICALS: COVID-19 IMPACT
             12.1.2 VERTICALS: MARKET DRIVERS
                       FIGURE 44 BANKING, FINANCIAL SERVICES, AND INSURANCE SEGMENT TO HOLD THE LARGEST MARKET SIZE DURING THE FORECAST PERIOD
                       TABLE 76 MARKET SIZE, BY VERTICAL, 2015–2020 (USD MILLION)
                       TABLE 77 MARKET SIZE, BY VERTICAL, 2021–2026 (USD MILLION)
     12.2 BANKING, FINANCIAL SERVICES, AND INSURANCE
             12.2.1 GROWING FOCUS ON FINANCIAL STANDARDS AND COMPLIANCE WITH REGULATIONS TO DRIVE THE MARKET IN THE BANKING, FINANCIAL SERVICES, AND INSURANCE INDUSTRY VERTICAL
                       TABLE 78 BANKING, FINANCIAL SERVICES, AND INSURANCE: MARKET SIZE, BY REGION, 2015–2020 (USD MILLION)
                       TABLE 79 BANKING, FINANCIAL SERVICES, AND INSURANCE: MARKET SIZE, BY REGION, 2021–2026 (USD MILLION)
     12.3 RETAIL AND ECOMMERCE
             12.3.1 GROWING DEMAND TO IDENTIFY CUSTOMER BEHAVIOR IN REAL TIME TO FUEL THE GROWTH OF THE GRAPH DATABASE MARKET IN THE RETAIL AND ECOMMERCE INDUSTRY VERTICAL
                       TABLE 80 RETAIL AND ECOMMERCE: MARKET SIZE, BY REGION, 2015–2020 (USD MILLION)
                       TABLE 81 RETAIL AND ECOMMERCE: MARKET SIZE, BY REGION, 2021–2026 (USD MILLION)
     12.4 TELECOM AND IT
             12.4.1 INCREASING DEMAND TO PROVIDE IMPROVED SERVICES FOR A GROWING CUSTOMER BASE TO BOOST THE ADOPTION OF THE MARKET IN THE TELECOM AND IT INDUSTRY VERTICAL
                       TABLE 82 TELECOM AND IT: MARKET SIZE, BY REGION, 2015–2020 (USD MILLION)
                       TABLE 83 TELECOM AND IT: MARKET SIZE, BY REGION, 2021–2026 (USD MILLION)
     12.5 HEALTHCARE, PHARMACEUTICALS, AND LIFE SCIENCES
             12.5.1 GROWING DEMAND TO ACHIEVE BETTER PATIENT EXPERIENCE AND PERSONALIZED TREATMENT IN REAL TIME TO FUEL THE GROWTH OF THE MARKET IN THE HEALTHCARE, PHARMACEUTICALS, AND LIFE SCIENCES INDUSTRY VERTICAL
                       TABLE 84 HEALTHCARE AND LIFE SCIENCES: MARKET SIZE, BY REGION, 2015–2020 (USD MILLION)
                       TABLE 85 HEALTHCARE AND LIFE SCIENCES: MARKET SIZE, BY REGION, 2021–2026 (USD MILLION)
     12.6 GOVERNMENT AND PUBLIC SECTOR
             12.6.1 GROWING DEMAND FOR ENHANCED DATA SECURITY AND ADVANCED INTELLIGENCE TO DRIVE THE GRAPH DATABASE MARKET IN GOVERNMENT AND PUBLIC SECTOR
                       TABLE 86 GOVERNMENT AND PUBLIC SECTOR: MARKET SIZE, BY REGION, 2015–2020 (USD MILLION)
                       TABLE 87 GOVERNMENT AND PUBLIC SECTOR: MARKET SIZE, BY REGION, 2021–2026 (USD MILLION)
     12.7 MANUFACTURING AND AUTOMOTIVE
             12.7.1 GROWING NEED TO EXTEND THE LIFESPAN OF FACTORY EQUIPMENT AND REDUCE THE RISK OF PRODUCTION DELAYS TO FUEL THE GROWTH OF THE GRAPH DATABASE APPLICATION IN THE MANUFACTURING INDUSTRY VERTICAL
                       TABLE 88 MANUFACTURING AND AUTOMOTIVE: MARKET SIZE, BY REGION, 2015–2020 (USD MILLION)
                       TABLE 89 MANUFACTURING AND AUTOMOTIVE: MARKET SIZE, BY REGION, 2021–2026 (USD MILLION)
     12.8 MEDIA AND ENTERTAINMENT
             TABLE 90 MEDIA AND ENTERTAINMENT: MARKET SIZE, BY REGION, 2015–2020 (USD MILLION)
             TABLE 91 MEDIA AND ENTERTAINMENT: MARKET SIZE, BY REGION, 2021–2026 (USD MILLION)
     12.9 ENERGY AND UTILITIES
             TABLE 92 ENERGY AND UTILITIES: GRAPH DATABASE MARKET SIZE, BY REGION, 2015–2020 (USD MILLION)
             TABLE 93 ENERGY AND UTILITIES: MARKET SIZE, BY REGION, 2021–2026 (USD MILLION)
     12.10 TRAVEL AND HOSPITALITY
              TABLE 94 TRAVEL AND HOSPITALITY: MARKET SIZE, BY REGION, 2015–2020 (USD MILLION)
              TABLE 95 TRAVEL AND HOSPITALITY: MARKET SIZE, BY REGION, 2021–2026 (USD MILLION)
     12.11 TRANSPORTATION AND LOGISTICS
             12.11.1 INCREASING NEED TO GAIN COMPLETE AND REAL-TIME VISIBILITY INTO OPERATIONS TO MINIMIZE RISKS TO DRIVE THE MARKET IN THE TRANSPORTATION AND LOGISTICS INDUSTRY VERTICAL
                        TABLE 96 TRANSPORTATION AND LOGISTICS: MARKET SIZE, BY REGION, 2015–2020 (USD MILLION)
                        TABLE 97 TRANSPORTATION AND LOGISTICS: MARKET SIZE, BY REGION, 2021–2026 (USD MILLION)
     12.12 OTHER VERTICALS
              TABLE 98 OTHER VERTICALS: MARKET SIZE, BY REGION, 2015–2020 (USD MILLION)
              TABLE 99 OTHER VERTICALS: MARKET SIZE, BY REGION, 2021–2026 (USD MILLION)

13 GRAPH DATABASE MARKET, BY REGION (Page No. - 163)
     13.1 INTRODUCTION
             13.1.1 REGION: COVID-19 IMPACT
                       TABLE 100 MARKET SIZE, BY REGION, 2015–2020 (USD MILLION)
                       TABLE 101 MARKET SIZE, BY REGION, 2021–2026 (USD MILLION)
     13.2 NORTH AMERICA
             13.2.1 NORTH AMERICA: MARKET DRIVERS
             13.2.2 NORTH AMERICA: REGULATIONS
                        13.2.2.1 The Personal Information Protection and Electronic Documents Act (PIPEDA)
                        13.2.2.2 Gramm–Leach–Bliley (GLB) Act
                        13.2.2.3 Health Insurance Portability and Accountability (HIPAA) Act of 1996
                        13.2.2.4 Federal Information Security Management Act
                        13.2.2.5 Federal Information Processing Standards
                        13.2.2.6 California Consumer Privacy Act (CSPA)
                                     TABLE 102 NORTH AMERICA: GRAPH DATABASE MARKET SIZE, BY COMPONENT, 2015–2020 (USD MILLION)
                                     TABLE 103 NORTH AMERICA: MARKET SIZE, BY COMPONENT, 2021–2026 (USD MILLION)
                                     TABLE 104 NORTH AMERICA: MARKET SIZE, BY SERVICE, 2015–2020 (USD MILLION)
                                     TABLE 105 NORTH AMERICA: MARKET SIZE, BY SERVICE, 2021–2026 (USD MILLION)
                                     TABLE 106 NORTH AMERICA: MARKET SIZE, BY PROFESSIONAL SERVICE, 2015–2020 (USD MILLION)
                                     TABLE 107 NORTH AMERICA: MARKET SIZE, BY PROFESSIONAL SERVICE, 2021–2026 (USD MILLION)
                                     TABLE 108 NORTH AMERICA: MARKET SIZE, BY TYPE, 2015–2020 (USD MILLION)
                                     TABLE 109 NORTH AMERICA: MARKET SIZE, BY TYPE, 2021–2026 (USD MILLION)
                                     TABLE 110 NORTH AMERICA: MARKET SIZE, BY APPLICATION, 2015–2020 (USD MILLION)
                                     TABLE 111 NORTH AMERICA: GRAPH DATABASE MARKET SIZE, BY APPLICATION, 2021–2026 (USD MILLION)
                                     TABLE 112 NORTH AMERICA: MARKET SIZE, BY DEPLOYMENT MODE, 2015–2020 (USD MILLION)
                                     TABLE 113 NORTH AMERICA: MARKET SIZE, BY DEPLOYMENT MODE, 2021–2026 (USD MILLION)
                                     TABLE 114 NORTH AMERICA: MARKET SIZE, BY ORGANIZATION SIZE, 2015–2020 (USD MILLION)
                                     TABLE 115 NORTH AMERICA: MARKET SIZE, BY ORGANIZATION SIZE, 2021–2026 (USD MILLION)
                                     TABLE 116 NORTH AMERICA: MARKET SIZE, BY VERTICAL, 2015–2020 (USD MILLION)
                                     TABLE 117 NORTH AMERICA: MARKET SIZE, BY VERTICAL, 2021–2026 (USD MILLION)
                                     TABLE 118 NORTH AMERICA: MARKET SIZE, BY COUNTRY, 2015–2020 (USD MILLION)
                                     TABLE 119 NORTH AMERICA: MARKET SIZE, BY COUNTRY, 2021–2026 (USD MILLION)
             13.2.3 UNITED STATES
                        13.2.3.1 Rapid adoption and use of digitally innovative solutions, presence of tech-giants, government initiatives, and growth of social media platforms to drive the market growth
             13.2.4 CANADA
                        13.2.4.1 Increase in investments, government research initiatives, and growth in the need for real-time decision-making to drive the growth of graph database solutions in Canada
     13.3 EUROPE
             13.3.1 EUROPE: GRAPH DATABASE MARKET DRIVERS
             13.3.2 EUROPE: REGULATIONS
                        13.3.2.1 General Data Protection Regulation (GDPR)
                        13.3.2.2 European Committee for Standardization (CEN)
                                     TABLE 120 EUROPE: MARKET SIZE, BY COMPONENT, 2015–2020 (USD MILLION)
                                     TABLE 121 EUROPE: MARKET SIZE, BY COMPONENT, 2021–2026 (USD MILLION)
                                     TABLE 122 EUROPE: MARKET SIZE, BY SERVICE, 2015–2020 (USD MILLION)
                                     TABLE 123 EUROPE: MARKET SIZE, BY SERVICE, 2021–2026 (USD MILLION)
                                     TABLE 124 EUROPE: MARKET SIZE, BY PROFESSIONAL SERVICE, 2015–2020 (USD MILLION)
                                     TABLE 125 EUROPE: MARKET SIZE, BY PROFESSIONAL SERVICE, 2021–2026 (USD MILLION)
                                     TABLE 126 EUROPE: MARKET SIZE, BY TYPE, 2015–2020 (USD MILLION)
                                     TABLE 127 EUROPE: MARKET SIZE, BY TYPE, 2021–2026 (USD MILLION)
                                     TABLE 128 EUROPE: MARKET SIZE, BY APPLICATION, 2015–2020 (USD MILLION)
                                     TABLE 129 EUROPE: GRAPH DATABASE MARKET SIZE, BY APPLICATION, 2021–2026 (USD MILLION)
                                     TABLE 130 EUROPE: MARKET SIZE, BY DEPLOYMENT MODE, 2015–2020 (USD MILLION)
                                     TABLE 131 EUROPE: MARKET SIZE, BY DEPLOYMENT MODE, 2021–2026 (USD MILLION)
                                     TABLE 132 EUROPE: MARKET SIZE, BY ORGANIZATION SIZE, 2015–2020 (USD MILLION)
                                     TABLE 133 EUROPE: MARKET SIZE, BY ORGANIZATION SIZE, 2021–2026 (USD MILLION)
                                     TABLE 134 EUROPE: MARKET SIZE, BY VERTICAL, 2015–2020 (USD MILLION)
                                     TABLE 135 EUROPE: MARKET SIZE, BY VERTICAL, 2021–2026 (USD MILLION)
                                     TABLE 136 EUROPE: MARKET SIZE, BY COUNTRY, 2015–2020 (USD MILLION)
                                     TABLE 137 EUROPE: MARKET SIZE, BY COUNTRY, 2021–2026 (USD MILLION)
             13.3.3 UNITED KINGDOM
                        13.3.3.1 Ongoing initiatives by enterprises and government to drive the growth of graph database solutions in the UK
             13.3.4 GERMANY
                        13.3.4.1 Government initiatives for technological developments to drive the growth of graph database solutions in Germany
             13.3.5 FRANCE
                        13.3.5.1 Heavy R&D investments, digitalization, and stronghold of retail, aerospace and defense, and manufacturing verticals to drive the growth of the market in France
             13.3.6 REST OF EUROPE
     13.4 ASIA PACIFIC
             13.4.1 ASIA PACIFIC: GRAPH DATABASE MARKET DRIVERS
             13.4.2 ASIA PACIFIC: REGULATIONS
                        13.4.2.1 Personal Data Protection Act (PDPA)
                        13.4.2.2 International Organization for Standardization (ISO) 27001
                                     TABLE 138 ASIA PACIFIC: MARKET SIZE, BY COMPONENT, 2015–2020 (USD MILLION)
                                     TABLE 139 ASIA PACIFIC: MARKET SIZE, BY COMPONENT, 2021–2026 (USD MILLION)
                                     TABLE 140 ASIA PACIFIC: MARKET SIZE, BY SERVICE, 2015–2020 (USD MILLION)
                                     TABLE 141 ASIA PACIFIC: MARKET SIZE, BY SERVICE, 2021–2026 (USD MILLION)
                                     TABLE 142 ASIA PACIFIC: MARKET SIZE, BY PROFESSIONAL SERVICE, 2015–2020 (USD MILLION)
                                     TABLE 143 ASIA PACIFIC: MARKET SIZE, BY PROFESSIONAL SERVICE, 2021–2026 (USD MILLION)
                                     TABLE 144 ASIA PACIFIC: MARKET SIZE, BY TYPE, 2015–2020 (USD MILLION)
                                     TABLE 145 ASIA PACIFIC: MARKET SIZE, BY TYPE, 2021–2026 (USD MILLION)
                                     TABLE 146 ASIA PACIFIC: MARKET SIZE, BY APPLICATION, 2015–2020 (USD MILLION)
                                     TABLE 147 ASIA PACIFIC: GRAPH DATABASE MARKET SIZE, BY APPLICATION, 2021–2026 (USD MILLION)
                                     TABLE 148 ASIA PACIFIC: MARKET SIZE, BY DEPLOYMENT MODE, 2015–2020 (USD MILLION)
                                     TABLE 149 ASIA PACIFIC: MARKET SIZE, BY DEPLOYMENT MODE, 2021–2026 (USD MILLION)
                                     TABLE 150 ASIA PACIFIC: MARKET SIZE, BY ORGANIZATION SIZE, 2015–2020 (USD MILLION)
                                     TABLE 151 ASIA PACIFIC: MARKET SIZE, BY ORGANIZATION SIZE, 2021–2026 (USD MILLION)
                                     TABLE 152 ASIA PACIFIC: MARKET SIZE, BY VERTICAL, 2015–2020 (USD MILLION)
                                     TABLE 153 ASIA PACIFIC: MARKET SIZE, BY VERTICAL, 2021–2026 (USD MILLION)
                                     TABLE 154 ASIA PACIFIC: MARKET SIZE, BY COUNTRY, 2015–2020 (USD MILLION)
                                     TABLE 155 ASIA PACIFIC: MARKET SIZE, BY COUNTRY, 2021–2026 (USD MILLION)
             13.4.3 CHINA
                        13.4.3.1 Increasing focus on integrating AI and deep learning technologies to drive the adoption of graph database software in China
             13.4.4 JAPAN
                        13.4.4.1 Existing market and already adopted technology to boost the market in Japan
             13.4.5 AUSTRALIA AND NEW ZEALAND
                        13.4.5.1 Growth in infrastructure developments and adoption of connected devices to act as a driving factor for the graph database market in ANZ
             13.4.6 REST OF ASIA PACIFIC
     13.5 MIDDLE EAST AND AFRICA
             13.5.1 MIDDLE EAST AND AFRICA: MARKET DRIVERS
             13.5.2 MIDDLE EAST AND AFRICA: REGULATIONS
                        13.5.2.1 Israeli Privacy Protection Regulations (Data Security), 5777-2017
                        13.5.2.2 GDPR Applicability in KSA
                        13.5.2.3 Protection of Personal Information Act (POPIA)
                                     TABLE 156 MIDDLE EAST AND AFRICA GRAPH DATABASE MARKET SIZE, BY COMPONENT, 2015–2020 (USD MILLION)
                                     TABLE 157 MIDDLE EAST AND AFRICA: MARKET SIZE, BY COMPONENT, 2021–2026 (USD MILLION)
                                     TABLE 158 MIDDLE EAST AND AFRICA: MARKET SIZE, BY SERVICE, 2015–2020 (USD MILLION)
                                     TABLE 159 MIDDLE EAST AND AFRICA: MARKET SIZE, BY SERVICE, 2021–2026 (USD MILLION)
                                     TABLE 160 MIDDLE EAST AND AFRICA: MARKET SIZE, BY PROFESSIONAL SERVICE, 2015–2020 (USD MILLION)
                                     TABLE 161 MIDDLE EAST AND AFRICA: MARKET SIZE, BY PROFESSIONAL SERVICE, 2021–2026 (USD MILLION)
                                     TABLE 162 MIDDLE EAST AND AFRICA: MARKET SIZE, BY TYPE, 2015–2020 (USD MILLION)
                                     TABLE 163 MIDDLE EAST AND AFRICA: MARKET SIZE, BY TYPE, 2021–2026 (USD MILLION)
                                     TABLE 164 MIDDLE EAST AND AFRICA: GRAPH DATABASE MARKET SIZE, BY APPLICATION, 2015–2020 (USD MILLION)
                                     TABLE 165 MIDDLE EAST AND AFRICA: MARKET SIZE, BY APPLICATION, 2021–2026 (USD MILLION)
                                     TABLE 166 MIDDLE EAST AND AFRICA: MARKET SIZE, BY DEPLOYMENT MODE, 2015–2020 (USD MILLION)
                                     TABLE 167 MIDDLE EAST AND AFRICA: MARKET SIZE, BY DEPLOYMENT MODE, 2021–2026 (USD MILLION)
                                     TABLE 168 MIDDLE EAST AND AFRICA: MARKET SIZE, BY ORGANIZATION SIZE, 2015–2020 (USD MILLION)
                                     TABLE 169 MIDDLE EAST AND AFRICA: MARKET SIZE, BY ORGANIZATION SIZE, 2021–2026 (USD MILLION)
                                     TABLE 170 MIDDLE EAST AND AFRICA: MARKET SIZE, BY VERTICAL, 2015–2020 (USD MILLION)
                                     TABLE 171 MIDDLE EAST AND AFRICA: MARKET SIZE, BY VERTICAL, 2021–2026 (USD MILLION)
                                     TABLE 172 MIDDLE EAST AND AFRICA: MARKET SIZE, BY REGION, 2015–2020 (USD MILLION)
                                     TABLE 173 MIDDLE EAST AND AFRICA: MARKET SIZE, BY REGION, 2021–2026 (USD MILLION)
             13.5.3 MIDDLE EAST
                        13.5.3.1 The shift of countries in the Middle East toward digital innovations to drive the adoption of graph database solutions in the region
             13.5.4 AFRICA
                        13.5.4.1 The growing digitalization in African countries to offer opportunities for deploying graph database solutions in Africa.
     13.6 LATIN AMERICA
             13.6.1 LATIN AMERICA: GRAPH DATABASE MARKET DRIVERS
             13.6.2 LATIN AMERICA: REGULATIONS
                        13.6.2.1 Brazil Data Protection Law
                        13.6.2.2 Argentina Personal Data Protection Law No. 25.326
                                     TABLE 174 LATIN AMERICA: MARKET SIZE, BY COMPONENT, 2015–2020 (USD MILLION)
                                     TABLE 175 LATIN AMERICA: MARKET SIZE, BY COMPONENT, 2021–2026 (USD MILLION)
                                     TABLE 176 LATIN AMERICA: MARKET SIZE, BY SERVICE, 2015–2020 (USD MILLION)
                                     TABLE 177 LATIN AMERICA: MARKET SIZE, BY SERVICE, 2021–2026 (USD MILLION)
                                     TABLE 178 LATIN AMERICA: MARKET SIZE, BY PROFESSIONAL SERVICE, 2015–2020 (USD MILLION)
                                     TABLE 179 LATIN AMERICA: MARKET SIZE, BY PROFESSIONAL SERVICE, 2021–2026 (USD MILLION)
                                     TABLE 180 LATIN AMERICA: MARKET SIZE, BY TYPE, 2015–2020 (USD MILLION)
                                     TABLE 181 LATIN AMERICA: MARKET SIZE, BY TYPE, 2021–2026 (USD MILLION)
                                     TABLE 182 LATIN AMERICA: MARKET SIZE, BY APPLICATION, 2015–2020 (USD MILLION)
                                     TABLE 183 LATIN AMERICA: MARKET SIZE, BY APPLICATION, 2021–2026 (USD MILLION)
                                     TABLE 184 LATIN AMERICA: MARKET SIZE, BY DEPLOYMENT MODE, 2015–2020 (USD MILLION)
                                     TABLE 185 LATIN AMERICA: GRAPH DATABASE MARKET SIZE, BY DEPLOYMENT MODE, 2021–2026 (USD MILLION)
                                     TABLE 186 LATIN AMERICA: MARKET SIZE, BY ORGANIZATION SIZE, 2015–2020 (USD MILLION)
                                     TABLE 187 LATIN AMERICA: MARKET SIZE, BY ORGANIZATION SIZE, 2021–2026 (USD MILLION)
                                     TABLE 188 LATIN AMERICA: MARKET SIZE, BY VERTICAL, 2015–2020 (USD MILLION)
                                     TABLE 189 LATIN AMERICA: MARKET SIZE, BY VERTICAL, 2021–2026 (USD MILLION)
                                     TABLE 190 LATIN AMERICA: MARKET SIZE, BY COUNTRY, 2015–2020 (USD MILLION)
                                     TABLE 191 LATIN AMERICA: MARKET SIZE, BY COUNTRY, 2021–2026 (USD MILLION)
             13.6.3 BRAZIL
                        13.6.3.1 Investments by multinational companies to drive the market growth in Brazil
             13.6.4 MEXICO
                        13.6.4.1 Government initiatives and increasing demand for graph database software and services to trigger the market growth in Mexico
             13.6.5 REST OF LATIN AMERICA

14 COMPETITIVE LANDSCAPE (Page No. - 211)
     14.1 OVERVIEW
     14.2 RECENT VENTURE FUNDING IN THE GRAPH DATABASE MARKET, 2018-2021
     14.3 REVENUE ANALYSIS
             FIGURE 45 REVENUE ANALYSIS FOR KEY COMPANIES IN THE PAST FIVE YEARS
     14.4 MARKET SHARE ANALYSIS
             FIGURE 46 MARKET: MARKET SHARE ANALYSIS
             TABLE 192 MARKET: DEGREE OF COMPETITION
     14.5 COMPANY EVALUATION QUADRANT
             14.5.1 STARS
             14.5.2 EMERGING LEADERS
             14.5.3 PERVASIVE PLAYERS
             14.5.4 PARTICIPANTS
                       FIGURE 47 KEY MARKET PLAYERS, COMPANY EVALUATION MATRIX, 2021
     14.6 COMPETITIVE BENCHMARKING
             TABLE 193 COMPANY REGION FOOTPRINT
     14.7 STARTUP/SME EVALUATION QUADRANT
             14.7.1 PROGRESSIVE COMPANIES
             14.7.2 RESPONSIVE COMPANIES
             14.7.3 DYNAMIC COMPANIES
             14.7.4 STARTING BLOCKS
                       FIGURE 48 STARTUP/SME GRAPH DATABASE MARKET EVALUATION MATRIX, 2021
     14.8 COMPETITIVE SCENARIO
             14.8.1 PRODUCT LAUNCHES
                       TABLE 194 PRODUCT LAUNCHES, MAY 2019–JUNE 2021
             14.8.2 DEALS
                       TABLE 195 DEALS, JANUARY 2021– JUNE 2021

15 COMPANY PROFILES (Page No. - 222)
     15.1 INTRODUCTION
     15.2 KEY PLAYERS
(Business Overview, Products, Recent Developments, MnM View)*
             15.2.1 IBM
                       TABLE 196 IBM: BUSINESS OVERVIEW
                       FIGURE 49 IBM: FINANCIAL OVERVIEW
                       TABLE 197 IBM: PRODUCTS/SOLUTIONS/SERVICES OFFERED
                       TABLE 198 IBM: GRAPH DATABASE MARKET: PRODUCT LAUNCHES AND ENHANCEMENTS, 2018–2021
                       TABLE 199 IBM: DEALS, 2018–2021
             15.2.2 ORACLE
                       TABLE 200 ORACLE: BUSINESS OVERVIEW
                       FIGURE 50 ORACLE: FINANCIAL OVERVIEW
                       TABLE 201 ORACLE: PRODUCTS/SOLUTIONS/SERVICES OFFERED
                       TABLE 202 ORACLE: PRODUCT LAUNCHES AND ENHANCEMENTS, 2018–2021
                       TABLE 203 ORACLE: DEALS, 2018–2021
             15.2.3 MICROSOFT
                       TABLE 204 MICROSOFT: BUSINESS OVERVIEW
                       FIGURE 51 MICROSOFT: FINANCIAL OVERVIEW
                       TABLE 205 MICROSOFT: PRODUCTS/SOLUTIONS/SERVICES OFFERED
                       TABLE 206 MICROSOFT: PRODUCT LAUNCHES AND ENHANCEMENTS, 2018–2021
                       TABLE 207 MICROSOFT: DEALS, 2018–2021
             15.2.4 AWS
                       TABLE 208 AWS: BUSINESS OVERVIEW
                       FIGURE 52 AWS: FINANCIAL OVERVIEW
                       TABLE 209 AWS: PRODUCTS/SOLUTIONS/SERVICES OFFERED
                       TABLE 210 AWS: PRODUCT LAUNCHES AND ENHANCEMENTS, 2018–2021
                       TABLE 211 AWS: DEALS, 2018–2021
             15.2.5 SAP
                       TABLE 212 SAP: BUSINESS OVERVIEW
                       FIGURE 53 SAP: COMPANY SNAPSHOT
                       TABLE 213 SAP: PRODUCTS/SOLUTIONS/SERVICES OFFERED
                       TABLE 214 SAP: PRODUCT LAUNCHES, 2018–2021
                       TABLE 215 SAP: DEALS, 2018–2021
                       TABLE 216 SAP: OTHERS, 2018–2021
             15.2.6 NEO4J
                       TABLE 217 NEO4J: BUSINESS OVERVIEW
                       TABLE 218 NEO4J: SOLUTIONS OFFERED
                       TABLE 219 NEO4J: PRODUCT LAUNCHES AND ENHANCEMENTS
                       TABLE 220 NEO4J: DEALS
             15.2.7 MARKLOGIC
                       TABLE 221 MARKLOGIC: BUSINESS OVERVIEW
                       TABLE 222 MARKLOGIC: SOLUTIONS OFFERED
                       TABLE 223 MARKLOGIC: PRODUCT LAUNCHES AND ENHANCEMENTS
                       TABLE 224 MARKLOGIC: DEALS
                       TABLE 225 MARKLOGIC: OTHERS
             15.2.8 TIGERGRAPH
                       TABLE 226 TIGERGRAPH: BUSINESS OVERVIEW
                       TABLE 227 TIGERGRAPH: SOLUTIONS OFFERED
                       TABLE 228 TIGERGRAPH: PRODUCT LAUNCHES AND ENHANCEMENTS
                       TABLE 229 TIGERGRAPH: DEALS
                       TABLE 230 TIGERGRAPH: OTHERS
             15.2.9 STARDOG
                       TABLE 231 STARDOG: BUSINESS OVERVIEW
                       TABLE 232 STARDOG: SOLUTIONS OFFERED
                       TABLE 233 STARDOG: PRODUCT LAUNCHES AND ENHANCEMENTS
                       TABLE 234 STARDOG: DEALS
             15.2.10 DATASTAX
                        TABLE 235 DATASTAX: BUSINESS OVERVIEW
                        TABLE 236 DATASTAX: SOLUTIONS OFFERED
                        TABLE 237 DATASTAX: PRODUCT LAUNCHES AND ENHANCEMENTS
                        TABLE 238 DATASTAX: DEALS
             15.2.11 HPE
                        TABLE 239 HPE: BUSINESS OVERVIEW
                        TABLE 240 HPE: SOLUTIONS OFFERED
                        TABLE 241 HPE: PRODUCT LAUNCHES AND ENHANCEMENTS
                        TABLE 242 HPE: DEALS
             15.2.12 FRANZ INC
                        TABLE 243 FRANZ INC: BUSINESS OVERVIEW
                        TABLE 244 FRANZ INC: SOLUTIONS OFFERED
                        TABLE 245 FRANZ INC: PRODUCT LAUNCHES AND ENHANCEMENTS
                        TABLE 246 FRANZ INC: DEALS
             15.2.13 ONTOTEXT
                        TABLE 247 ONTOTEXT: BUSINESS OVERVIEW
                        TABLE 248 ONTOTEXT: SOLUTIONS OFFERED
                        TABLE 249 ONTOTEXT: PRODUCT LAUNCHES AND ENHANCEMENTS
                        TABLE 250 ONTOTEXT: DEALS
             15.2.14 OPENLINK SOFTWARE
                        TABLE 251 OPENLINK SOFTWARE: BUSINESS OVERVIEW
                        TABLE 252 OPENLINK SOFTWARE: SOLUTIONS OFFERED
                        TABLE 253 OPENLINK SOFTWARE: PRODUCT LAUNCHES AND ENHANCEMENTS
             15.2.15 DGRAPH LABS
                        TABLE 254 DGRAPH LABS: BUSINESS OVERVIEW
                        TABLE 255 DGRAPH LABS: SOLUTIONS OFFERED
                        TABLE 256 DGRAPH LABS: PRODUCT LAUNCHES AND ENHANCEMENTS
                        TABLE 257 DGRAPH LABS: DEALS
             15.2.16 TIBCO
                        TABLE 258 TIBCO: BUSINESS OVERVIEW
                        TABLE 259 TIBCO: SOLUTIONS OFFERED
                        TABLE 260 TIBCO: PRODUCT LAUNCHES AND ENHANCEMENTS
                        TABLE 261 TIBCO: DEALS
             15.2.17 TERADATA
                        TABLE 262 TERADATA: BUSINESS OVERVIEW
                        TABLE 263 TERADATA: SOLUTIONS OFFERED
             15.2.18 REDIS LABS
                        TABLE 264 REDIS LABS: BUSINESS OVERVIEW
                        TABLE 265 REDIS LABS: SOLUTIONS OFFERED
                        TABLE 266 REDIS LABS: PRODUCT LAUNCHES AND ENHANCEMENTS
                        TABLE 267 REDIS LABS: DEALS
             15.2.19 ECCENCA GMBH
             15.2.20 CAMBRIDGE SEMANTICS
             15.2.21 BITNINE
             15.2.22 ARANGODB
             15.2.23 FLUREE
             15.2.24 BLAZEGRAPH
             15.2.25 MEMGRAPH
             15.2.26 OBJECTIVITY
             15.2.27 GRAPHBASE
             15.2.28 GRAPH STORY

*Details on Business Overview, Products, Recent Developments, MnM View might not be captured in case of unlisted companies.

16 ADJACENT AND RELATED MARKETS (Page No. - 284)
     16.1 INTRODUCTION
     16.2 CLOUD DATABASE AND DBAAS MARKET - GLOBAL FORECAST TO 2025
             16.2.1 MARKET DEFINITION
             16.2.2 MARKET OVERVIEW
                        16.2.2.1 Cloud database and DbaaS market, by component
                                     TABLE 268 CLOUD DATABASE AND DBAAS MARKET SIZE, BY COMPONENT, 2018–2025 (USD MILLION)
                                     TABLE 269 CLOUD DATABASE AND DBAAS MARKET SIZE, BY SERVICE, 2018–2025 (USD MILLION)
                        16.2.2.2 Cloud database and DbaaS market, by organization size
                                     TABLE 270 CLOUD DATABASE AND DBAAS MARKET SIZE, BY ORGANIZATION SIZE, 2018–2025 (USD MILLION)
                        16.2.2.3 Cloud database and DbaaS market, by verticals
                                     TABLE 271 CLOUD DATABASE AND DBAAS MARKET SIZE, BY VERTICAL, 2018–2025 (USD MILLION)
                        16.2.2.4 Cloud database and DbaaS market, by region
                                     TABLE 272 CLOUD DATABASE AND DBAAS MARKET SIZE, BY REGION, 2018–2025 (USD MILLION)
     16.3 GRAPH ANALYTICS MARKET - GLOBAL FORECAST TO 2024
             16.3.1 MARKET DEFINITION
             16.3.2 MARKET OVERVIEW
                        16.3.2.1 Graph analytics market, by component
                                     TABLE 273 GRAPH ANALYTICS MARKET SIZE, BY COMPONENT, 2017–2024 (USD MILLION)
                                     TABLE 274 SERVICES: GRAPH ANALYTICS MARKET SIZE, BY TYPE, 2017–2024 (USD MILLION)
                        16.3.2.2 Graph analytics market, by deployment mode
                                     TABLE 275 GRAPH ANALYTICS MARKET SIZE, BY DEPLOYMENT MODE, 2017–2024 (USD MILLION)
                        16.3.2.3 Cloud database and DbaaS market, by vertical
                                     TABLE 276 GRAPH ANALYTICS MARKET SIZE, BY VERTICAL, 2017–2024 (USD MILLION)
                        16.3.2.4 Cloud database and DbaaS market, by region
                                     TABLE 277 GRAPH ANALYTICS MARKET SIZE, BY REGION, 2017–2024 (USD MILLION)

17 APPENDIX (Page No. - 292)
     17.1 DISCUSSION GUIDE
     17.2 KNOWLEDGE STORE: MARKETSANDMARKETS’ SUBSCRIPTION PORTAL
     17.3 AVAILABLE CUSTOMIZATIONS
     17.4 RELATED REPORTS
     17.5 AUTHOR DETAILS

The study involved four major activities in estimating the current market size of the graph database market. Extensive secondary research was done to collect information on the market, peer market, and parent market. The next step was to validate these findings, assumptions, and sizing with industry experts across the value chain through primary research. Both top-down and bottom-up approaches were used to estimate the total market size. After that, the market breakup and data triangulation procedures were used to estimate the market size of the segments and subsegments of the graph database market.

Secondary Research

In the secondary research process, various sources were referred to for identifying and collecting information for the study. The secondary sources included annual reports, press releases, investor presentations of companies; white papers; journals; and certified publications and articles from recognized authors, directories, and databases.

Primary Research

Various primary sources from both supply and demand sides were interviewed to obtain qualitative and quantitative information on the market. The primary sources from the supply side included various industry experts, including Chief X Officers (CXOs); Vice Presidents (VPs); directors from business development, marketing, and product development/innovation teams; related key executives from graph database solution vendors, system integrators, professional service providers, industry associations, and consultants; and key opinion leaders. All possible parameters that affect the market covered in this research study have been accounted for, viewed in extensive detail, verified through primary research, and analyzed to get the final quantitative and qualitative data.

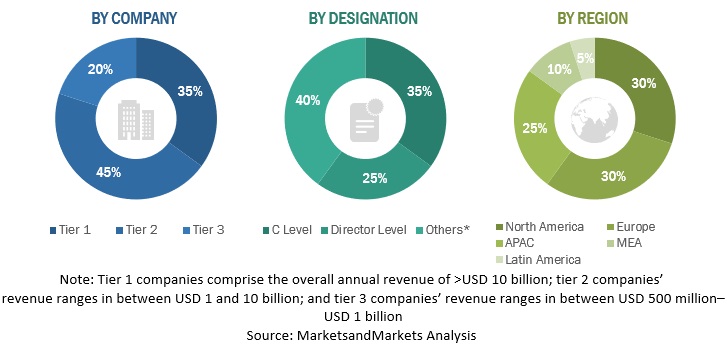
The following is the breakup of primary profiles:
Graph Database Market Size, and Share

To know about the assumptions considered for the study, download the pdf brochure

Market Size Estimation

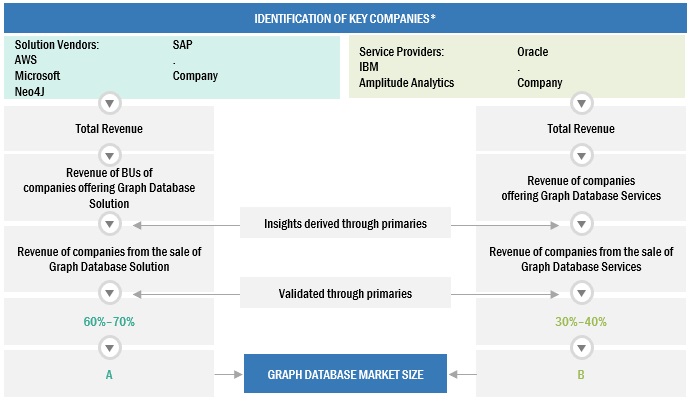
Both top-down and bottom-up approaches were used to estimate and validate the total size of the Graph Database market. The top-down approach was used to derive the revenue contribution of top vendors and their offerings in the market. The bottom-up approach was used to arrive at the overall market size of the global market using key companies’ revenue and their offerings in the market. The research methodology used to estimate the market size includes the following:

  • The key players in the market were identified through extensive secondary research.
  • The market size, in terms of value, was determined through primary and secondary research processes.
  • All percentages, shares, and breakups were determined using secondary sources and verified through primary sources.

Data Triangulation

After arriving at the overall market size using the market size estimation processes as explained above, the market was split into several segments and subsegments. To complete the overall market engineering process and arrive at the exact statistics of each market segment and subsegment, data triangulation, and market breakup procedures were employed, wherever applicable. The overall market size was then used in the top-down procedure to estimate the size of other individual markets via percentage splits of the market segmentation.

Report Objectives

  • To define, describe, and predict the graph database market by component (software and services), professional service, organization size, deployment mode, type, application, vertical, and region
  • To provide detailed information related to major factors (drivers, restraints, opportunities, and industry-specific challenges) influencing the market growth
  • To analyze opportunities in the market and provide details of the competitive landscape for stakeholders and market leaders
  • To forecast the market size of segments for five main regions: North America, Europe, Asia Pacific (APAC), Middle East and Africa (MEA), and Latin America
  • To profile key players and comprehensively analyze their market rankings and core competencies
  • To analyze competitive developments, such as partnerships, new product launches, and mergers and acquisitions, in the graph database market
  • To analyze the impact of the COVID-19 pandemic on the graph database market

Available customizations

With the given market data, MarketsandMarkets offers customizations as per the company’s specific needs. The following customization options are available for the report:

Product analysis

  • Product matrix provides a detailed comparison of the product portfolio of each company

Geographic analysis

  • Further breakup of the North American graph database market
  • Further breakup of the European market
  • Further breakup of the APAC market
  • Further breakup of the Latin American market
  • Further breakup of the MEA market

Company information

  • Detailed analysis and profiling of additional market players up to 5
Custom Market Research Services

We will customize the research for you, in case the report listed above does not meet with your exact requirements. Our custom research will comprehensively cover the business information you require to help you arrive at strategic and profitable business decisions.

Request Customization

Instant Answers with GPT - Ask Now!

Ask real questions. Get complete answers !
Report Code
TC 6341
Published ON
Jul, 2021
GET A FREE SAMPLE

FREE Sample Pages includes Graph Database Market analysis, growth, market forecasts and much more.

REQUEST FREE SAMPLE

Order Your Copy Now

ORDER THIS REPORT
  • SHARE
X
Request Customization
Speak to Analyst
Speak to Analyst
OR FACE-TO-FACE MEETING
PERSONALIZE THIS RESEARCH
  • Triangulate with your Own Data
  • Get Data as per your Format and Definition
  • Gain a Deeper Dive on a Specific Application, Geography, Customer or Competitor
  • Any level of Personalization
REQUEST A FREE CUSTOMIZATION
LET US HELP YOU!
  • What are the Known and Unknown Adjacencies Impacting the Graph Database Market
  • What will your New Revenue Sources be?
  • Who will be your Top Customer; what will make them switch?
  • Defend your Market Share or Win Competitors
  • Get a Scorecard for Target Partners
CUSTOMIZED WORKSHOP REQUEST
+1-888-600-6441
  • Call Us
  • +1-888-600-6441 (Corporate office hours)
  • +1-888-600-6441 (US/Can toll free)
  • +44-800-368-9399 (UK office hours)
CONNECT WITH US
ABOUT TRUST ONLINE
©2023 MarketsandMarkets Research Private Ltd. All rights reserved
DMCA.com Protection Status Website Feedback