Immersion Cooling Market

Immersion Cooling Market by Type (Single-Phase, Two-Phase), Application (High Performance Computing, Edge Computing, Cryptocurrency Mining), Cooling Fluid (Synthetic Oil, Mineral Oil), Component (Solutions, Services), and Region - Global Forecast to 2031

Report Code: CH 7299 Dec, 2023, by marketsandmarkets.com

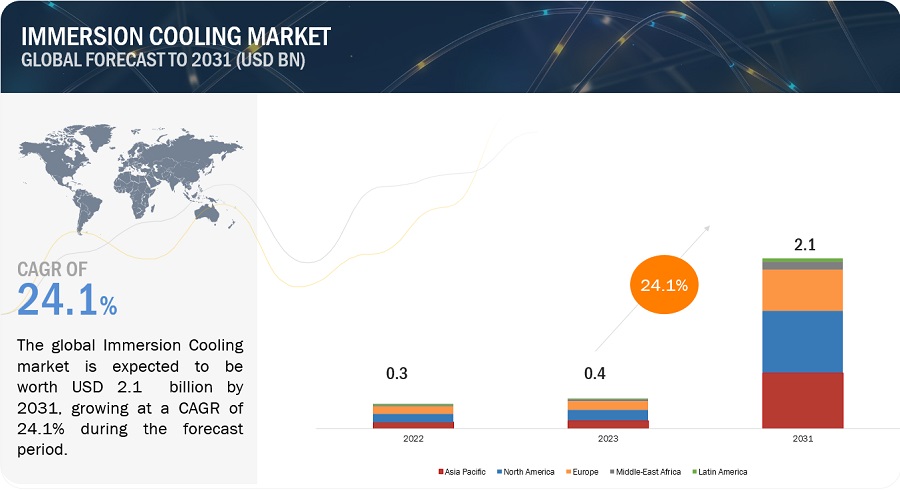
The immersion cooling market is projected to grow from USD 0.4 billion in 2023 to USD 2.1 billion by 2031, at a CAGR of 24.1% from 2023 to 2031. The major reason for the growth of the immersion cooling market is the demand for energy-efficient solutions. Immersion cooling solutions offer cost advantages, such as reduced operational expenditures and lower energy consumption, which make them an attractive option for data centers and other applications.

Attractive Opportunities in the Immersion Cooling Market
Immersion Cooling Market

To know about the assumptions considered for the study, Request for Free Sample Report
Immersion Cooling Market

Immersion Cooling Market Dynamics

Driver: Adoption of cryptocurrency mining & blockchain

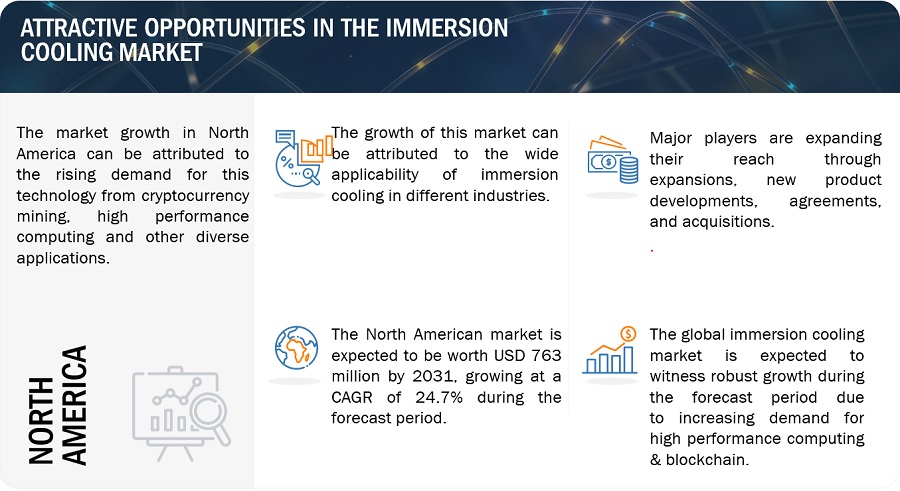
The adoption of cryptocurrency mining and blockchain technologies is expected to drive the immersion cooling market's growth. Cryptocurrency mining, which involves solving complex algorithms and generating significant heat, can benefit from immersion cooling's ability to maintain optimal temperatures and reduce energy costs.. This has led to a renewed interest and investments in crypto mining, with immersion cooling offering advantages such as increased efficiency, hardware longevity, and improved mining power.

Restraint: Susceptible to leakage

Susceptibility to leakage is indeed a restraint of the immersion cooling market. While immersion cooling systems offer advantages such as reduced water usage and improved heat dissipation, they are not immune to leakage issues, which can affect their performance and reliability. This challenge is particularly notable in the case of fluorocarbon immersion coolants, which, despite being nonflammable and thermally stable, are still susceptible to leakage. The lack of knowledge on immersion cooling and fluid leakage issues is also estimated to hinder the market's growth.

Opportunity: Adoption of low-density data servers

The adoption of low-density data servers presents an opportunity for the immersion cooling market. As data center operators seek more compact and efficient cooling solutions, the use of low-density servers can complement the benefits of immersion cooling. By allowing for higher hardware density and reduced physical footprint in data centers, low-density servers align with the scalability and space-saving advantages offered by immersion cooling. This combination can lead to significant energy savings, reduced maintenance costs, and improved overall cost-effectiveness, making it an attractive proposition for data center operators looking to optimize their infrastructure. As the demand for data processing capabilities continues to rise, driven by technologies like IoT, AI, and blockchain, the synergy between low-density servers and immersion cooling is poised to play a key role in meeting the evolving needs of the data center industry.

Challenge: High investment in existing infrastructure

One of the challenges associated with immersion cooling technology is the high investment required for infrastructure and equipment. Immersion cooling systems require specialized equipment, such as tanks, pumps, and heat exchangers, which can be expensive to install and maintain. Additionally, installing immersion cooling systems may require significant modifications to existing data center infrastructure, which can further increase costs.

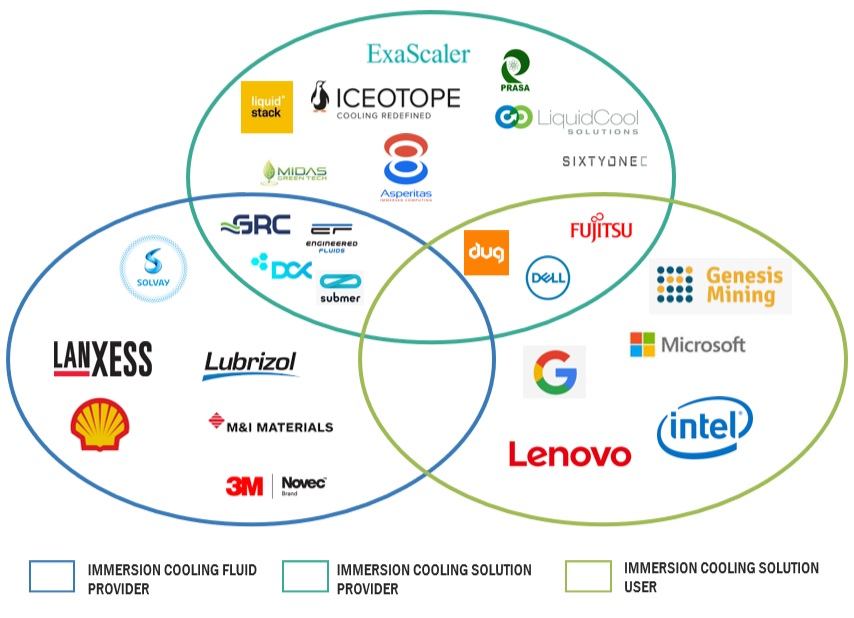
Immersion Cooling: Ecosystem
Immersion Cooling Market Ecosystem

Based on the type, the Single phase is projected to grow at the highest CAGR during the forecast period.

Single-phase is anticipated to grow at the highest CAGR based on the type. The growth of the single-phase immersion cooling market can be attributed to its simplicity, efficiency in heat dissipation, energy-saving capabilities, and scalability. As the demand for high-performance computing continues to rise across various sectors, the advantages of single-phase immersion cooling make it a compelling choice for organizations seeking effective and sustainable cooling solutions for their increasingly powerful and densely packed computing systems.

Based on Application, the Artificial Intelligence segment is projected to grow at the highest CAGR during the forecast period.

The increasing demand for high-performance computing (HPC) in AI applications is a key driver. AI models, such as intense learning models, are becoming more complex and computationally intensive, leading to higher power densities and increased heat generation. Immersion cooling provides an efficient solution for managing the heat produced by powerful GPUs and TPUs used in AI model training, allowing optimal performance without the risk of thermal throttling.

Based on cooling fluids, the synthetic fuels segment is projected to grow at the highest CAGR during the forecast period.

The versatility of synthetic fluids in immersion cooling systems is another factor fueling market expansion. These fluids can be customized to suit different cooling requirements and hardware configurations, providing a flexible and adaptable solution for various industries. As technology advances, developing synthetic fluids with improved properties, such as higher thermal conductivity and excellent stability, further enhances their applicability in diverse immersion cooling settings.

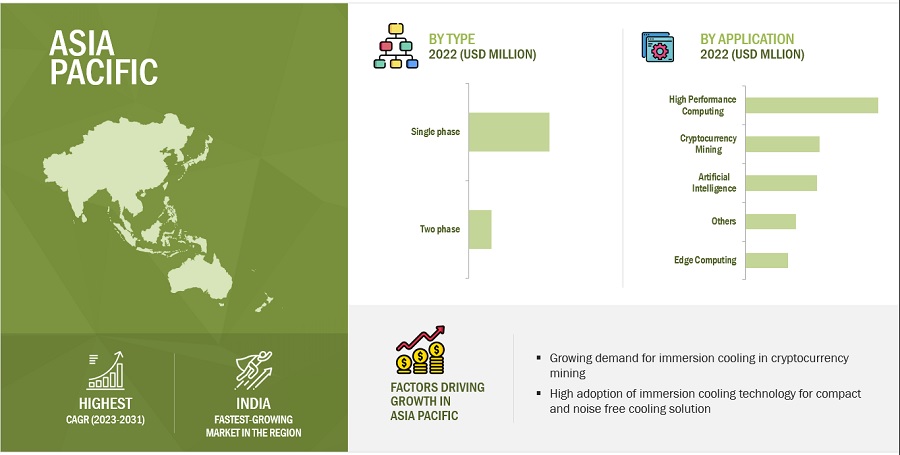
Asia Pacific is projected to grow at the highest CAGR during the forecast period.

The rapid expansion of data center infrastructure in APAC is a significant driver for the growth of immersion cooling. As businesses and governments in the region invest heavily in digital transformation, cloud services, and AI-driven applications, the demand for efficient cooling solutions that can handle the heat generated by advanced computing systems is on the rise. Immersion cooling, with its ability to provide adequate heat dissipation and energy efficiency, is well-suited to meet the evolving needs of data centers in APAC.
Immersion Cooling Market by Region

Source: Expert Interviews, Secondary Research, Whitepapers, Journals, Magazines, and MarketsandMarkets Analysis

To know about the assumptions considered for the study, download the pdf brochure

Key Market Players

Some of the key players in the market include LiquidStack (Netherlands), Fujitsu (Japan), Green Revolution Cooling Inc (US), Submer (Spain), Asperitas (Netherlands), Midas Green Technologies (US), Iceotope Technologies Ltd (US), LiquidCool Solutions (US), and DUG Technology (Australia).

Get online access to the report on the World's First Market Intelligence Cloud

  • Easy to Download Historical Data & Forecast Numbers
  • Company Analysis Dashboard for high growth potential opportunities
  • Research Analyst Access for customization & queries
  • Competitor Analysis with Interactive dashboard
  • Latest News, Updates & Trend analysis
Request Sample

Scope of the Report

Report Metric

Details

Market Size Available for Years

2017–2031

Base Year Considered

2022

Forecast Period

2023–2031

Forecast Units

Value (USD Million and USD Billion)

Segments Covered

 Type, Cooling Fluid, Application, and Region

Geographies Covered

Asia Pacific, North America, Europe, Middle East, South America, and Africa

Companies Covered

The major market players include LiquidStack (Netherlands), Fujitsu (Japan), Green Revolution Cooling Inc (US), Submer (Spain), Asperitas (Netherlands), Midas Green Technologies (US), Iceotope Technologies Ltd (US), LiquidCool Solutions (US), DUG Technology (Australia), DCX - The Liquid Cooling Company (Poland), Engineered Fluids (US), TIEMMERS (Netherlands), TMGcore, Inc. (US), GIGA-BYTE Technology Co., Ltd. and so on.

This research report categorizes the immersion cooling market based on type, cooling fluid, application, and region.

Based on application, the immersion cooling market has been segmented into:
  • High-performance Computing
  • Artificial Intelligence
  • Edge Computing
  • Cryptocurrency Mining
  • Others (Cloud Computing, Enterprise Computing)
Based on type, the immersion cooling market has been segmented into:
  • Single-Phase Immersion Cooling
  • Two-Phase Immersion Cooling
Based on the cooling fluid, the immersion cooling market has been segmented into:
  • Mineral Oil
  • Synthetic Fluids
  • Fluorocarbon-based Fluids
  • Other (Vegetable Oil, Bio-Oil, Silicone Oil, Deionized Water)
Based on the components, the immersion cooling market has been segmented into:
  • Solutions
  • Services
Based on the region, the immersion cooling market has been segmented into:
  • Asia Pacific
  • North America
  • Europe
  • Middle East & Africa
  • South America

Recent Developments

  • In October 2023, GRC (Green Revolution Cooling) Inc., the leader in single-phase immersion cooling for data centers, announced the launch of a new data center solution, Next-Gen Immersion Cooled Data Centers in Middle East & Africa, with the collaboration of Dell Technologies, and DCV Industries.
  • In October 2023, Submer and Intel collaborated to enhance single-phase immersion technology through a Forced Convection Heat Sink (FCHS) package. It reduces the quantity and cost of components required for comprehensive heat capture and the dissipation of chips with Thermal Design Power (TDP) exceeding 1000W.
  • In May 2020, Asperitas partnered with European data center owner/operator, Maincubes. The two companies planned to offer immersion cooling solutions in dedicated immersion cooling colocation suites in the Maincubes Amsterdam AMS01 data center. AMS01 is also home to the European Open Compute Project (OCP) Experience Center, while Asperitas is a leading OCP standards contributor in immersion cooling.

Frequently Asked Questions (FAQ):

To speak to our analyst for a discussion on the above findings, click Speak to Analyst

TABLE OF CONTENTS
 
1 INTRODUCTION (Page No. - 31)
    1.1 STUDY OBJECTIVES 
    1.2 MARKET DEFINITION 
    1.3 INCLUSIONS AND EXCLUSIONS 
          TABLE 1 IMMERSION COOLING MARKET, BY TYPE: INCLUSIONS AND EXCLUSIONS
          TABLE 2 IMMERSION COOLING MARKET, BY COOLING FLUID: INCLUSIONS AND EXCLUSIONS
          TABLE 3 IMMERSION COOLING MARKET, BY COMPONENT: INCLUSIONS AND EXCLUSIONS
          TABLE 4 IMMERSION COOLING MARKET, BY APPLICATION: INCLUSIONS AND EXCLUSIONS
          TABLE 5 IMMERSION COOLING MARKET, BY REGION: INCLUSIONS AND EXCLUSIONS
    1.4 MARKET SCOPE 
           1.4.1 IMMERSION COOLING MARKET SEGMENTATION
           1.4.2 REGIONS COVERED
           1.4.3 YEARS CONSIDERED
    1.5 CURRENCY 
    1.6 STAKEHOLDERS 
    1.7 SUMMARY OF CHANGES 
 
2 RESEARCH METHODOLOGY (Page No. - 36)
    2.1 RESEARCH DATA 
          FIGURE 1 IMMERSION COOLING MARKET: RESEARCH DESIGN
           2.1.1 SECONDARY DATA
                    2.1.1.1 Key data from secondary sources
           2.1.2 PRIMARY DATA
                    2.1.2.1 Key data from primary sources
                    2.1.2.2 Key industry insights
                    2.1.2.3 Breakdown of primary interviews
                    2.1.2.4 Primary participants
    2.2 MARKET SIZE ESTIMATION 
           2.2.1 BOTTOM-UP APPROACH
                    FIGURE 2 MARKET SIZE ESTIMATION: BOTTOM-UP APPROACH
           2.2.2 TOP-DOWN APPROACH
                    FIGURE 3 MARKET SIZE ESTIMATION: TOP-DOWN APPROACH
    2.3 CALCULATION OF BASE MARKET SIZE 
           2.3.1 SUPPLY-SIDE APPROACH
                    FIGURE 4 MARKET SIZE ESTIMATION METHODOLOGY: APPROACH 1 (SUPPLY SIDE)
           2.3.2 DEMAND-SIDE APPROACH
                    FIGURE 5 MARKET SIZE ESTIMATION METHODOLOGY: APPROACH 2—BOTTOM-UP (DEMAND SIDE)
    2.4 DATA TRIANGULATION 
          FIGURE 6 IMMERSION COOLING MARKET: DATA TRIANGULATION
    2.5 GROWTH RATE ASSUMPTIONS/GROWTH FORECAST 
          TABLE 6 FACTOR ANALYSIS
    2.6 ASSUMPTIONS 
    2.7 RISK ASSESSMENT 
          TABLE 7 LIMITATIONS AND ASSOCIATED RISKS
 
3 EXECUTIVE SUMMARY (Page No. - 46)
    FIGURE 7 HIGH-PERFORMANCE COMPUTING TO ACCOUNT FOR LARGEST SHARE OF IMMERSION COOLING MARKET
    FIGURE 8 SYNTHETIC FLUIDS SEGMENT TO DOMINATE IMMERSION COOLING MARKET DURING FORECAST PERIOD
    FIGURE 9 SINGLE-PHASE IMMERSION COOLING SEGMENT TO LEAD IMMERSION COOLING MARKET
    FIGURE 10 SOLUTIONS SEGMENT TO ACCOUNT FOR LARGER SHARE OF OVERALL IMMERSION COOLING MARKET
    FIGURE 11 NORTH AMERICA TO ACCOUNT FOR LARGEST SHARE OF IMMERSION COOLING MARKET
 
4 PREMIUM INSIGHTS (Page No. - 51)
    4.1 ATTRACTIVE OPPORTUNITIES FOR PLAYERS IN IMMERSION COOLING MARKET 
          FIGURE 12 ADOPTION IN CRYPTOCURRENCY MINING AND GROWING SERVER DENSITY DRIVING GROWTH
    4.2 IMMERSION COOLING MARKET, BY REGION 
          FIGURE 13 ASIA PACIFIC IMMERSION COOLING MARKET PROJECTED TO WITNESS HIGHEST CAGR FROM 2023 TO 2031
    4.3 NORTH AMERICA IMMERSION COOLING MARKET, BY APPLICATION AND COUNTRY 
          FIGURE 14 CRYPTOCURRENCY MINING ACCOUNTED FOR LARGEST SHARE OF NORTH AMERICA IMMERSION COOLING MARKET
    4.4 IMMERSION COOLING MARKET, BY MAJOR COUNTRIES 
          FIGURE 15 IMMERSION COOLING MARKET IN CHINA PROJECTED TO WITNESS HIGHEST CAGR FROM 2023 TO 2031
 
5 MARKET OVERVIEW (Page No. - 54)
    5.1 INTRODUCTION 
          FIGURE 16 IMMERSION COOLING MARKET: DRIVERS, RESTRAINTS, OPPORTUNITIES, AND CHALLENGES
           5.1.1 DRIVERS
                    5.1.1.1 Adoption in cryptocurrency mining & blockchain
                    5.1.1.2 Growing density of servers
                                FIGURE 17 AVERAGE SERVER RACK DENSITY, 2016–2020
                    5.1.1.3 Growing need for eco-friendly data center cooling solutions
                                TABLE 8 CARBON FOOTPRINT OF AIR-COOLING VERSUS IMMERSION-COOLING FOR DATA CENTERS
                    5.1.1.4 Rising need for cost-effective cooling solutions
                                TABLE 9 AIR-COOLING VERSUS IMMERSION-COOLING FOR DATA CENTERS
                    5.1.1.5 Increasing demand for compact and noise-free solutions
                                TABLE 10 COMPARATIVE NOISE LEVEL
           5.1.2 RESTRAINTS
                    5.1.2.1 Susceptibility to leakage
                    5.1.2.2 Dominance of air cooling technology
           5.1.3 OPPORTUNITIES
                    5.1.3.1 Adoption in low-density data centers
                    5.1.3.2 Emergence of AI, high-performance electronics, telecom, and other technologies
                    5.1.3.3 Development of cooling solutions for deployment in harsh environments
                                TABLE 11 WATER CONSUMPTION IN AIR-COOLING VERSUS IMMERSION-COOLING FOR DATA CENTERS
                    5.1.3.4 High-density cooling requirements
           5.1.4 CHALLENGES
                    5.1.4.1 High investments in existing infrastructure
                    5.1.4.2 Retrofitting immersion cooling solutions in large and medium-scale data centers
    5.2 PORTER'S FIVE FORCES ANALYSIS 
          FIGURE 18 IMMERSION COOLING MARKET: PORTER’S FIVE FORCES ANALYSIS
          TABLE 12 IMMERSION COOLING MARKET: PORTER'S FIVE FORCES ANALYSIS
           5.2.1 BARGAINING POWER OF SUPPLIERS
           5.2.2 BARGAINING POWER OF BUYERS
           5.2.3 THREAT OF SUBSTITUTES
           5.2.4 THREAT OF NEW ENTRANTS
           5.2.5 INTENSITY OF COMPETITIVE RIVALRY
    5.3 TRENDS/DISRUPTIONS IMPACTING CUSTOMERS’ BUSINESSES 
          FIGURE 19 REVENUE SHIFTS AND NEW REVENUE POCKETS IN IMMERSION COOLING MARKET
    5.4 PRICING ANALYSIS 
           5.4.1 AVERAGE SELLING PRICE TREND OF KEY PLAYERS, BY TYPE
                    FIGURE 20 AVERAGE SELLING PRICE TREND OF KEY PLAYERS, BY TYPE
                    TABLE 13 AVERAGE SELLING PRICE TREND OF KEY PLAYERS, BY TYPE (USD/L)
           5.4.2 AVERAGE SELLING PRICE TREND, BY REGION
                    FIGURE 21 AVERAGE SELLING PRICE OF IMMERSION COOLING FLUIDS, BY REGION
                    TABLE 14 AVERAGE SELLING PRICE TREND OF IMMERSION COOLING FLUIDS, BY REGION (USD/L)
    5.5 SUPPLY CHAIN ANALYSIS 
          FIGURE 22 IMMERSION COOLING MARKET: SUPPLY CHAIN ANALYSIS
    5.6 ECOSYSTEM/MARKET MAP 
          FIGURE 23 IMMERSION COOLING MARKET: ECOSYSTEM MAPPING
          TABLE 15 IMMERSION COOLING MARKET: ROLE IN ECOSYSTEM
    5.7 TECHNOLOGY ANALYSIS 
          FIGURE 24 TYPES OF IMMERSION COOLING SOLUTIONS
           5.7.1 SINGLE-PHASE
                    5.7.1.1 IT chassis
                    5.7.1.2 Tub/Open bath
           5.7.2 TWO-PHASE
                    5.7.2.1 Tub/Open bath
           5.7.3 HYBRID
    5.8 PATENTS ANALYSIS 
           5.8.1 INTRODUCTION
           5.8.2 METHODOLOGY
           5.8.3 DOCUMENT TYPE
                    FIGURE 25 NUMBER OF GRANTED PATENTS, PATENT APPLICATIONS, AND LIMITED PATENTS
                    FIGURE 26 PATENT PUBLICATION TRENDS (2011–2022)
           5.8.4 INSIGHTS
                    FIGURE 27 TOP JURISDICTIONS FOR IMMERSION COOLING SOLUTION PATENTS
                    FIGURE 28 COMPANIES/APPLICANTS WITH HIGHEST NUMBER OF PATENTS
                    TABLE 16 LIST OF PATENTS PERTAINING TO IMMERSION COOLING MARKET, 2017–2021
                    TABLE 17 TOP 10 PATENT OWNERS IN LAST 10 YEARS
    5.9 TRADE DATA 
           5.9.1 IMPORT SCENARIO
                    FIGURE 29 IMMERSION COOLING FLUIDS IMPORT, BY KEY COUNTRIES, 2018–2022 (USD BILLION)
           5.9.2 EXPORT SCENARIO
                    FIGURE 30 IMMERSION COOLING FLUIDS EXPORT, BY KEY COUNTRIES, 2018–2022 (USD BILLION)
    5.10 KEY CONFERENCES & EVENTS 
           TABLE 18 IMMERSION COOLING MARKET: CONFERENCES & EVENTS (2022 & 2023)
    5.11 TARIFF & REGULATORY LANDSCAPE 
           5.11.1 OPEN COMPUTE PROJECT (OCP) - QUALITY & SAFETY REQUIREMENTS FOR IMMERSION COOLING TECHNOLOGY
           5.11.2 OPEN COMPUTE PROJECT (OCP) - DIELECTRIC COOLING FLUID REQUIREMENTS FOR DATA CENTER APPLICATIONS
                     TABLE 19 DIELECTRIC COOLING FLUID SPECIFICATIONS
                     TABLE 20 DIELECTRIC COOLING FLUID MINIMUM REQUIREMENTS
                     TABLE 21 HYDROCARBON FLUIDS QUALITY MANAGEMENT TABLE
                     TABLE 22 FLUOROCARBON FLUIDS QUALITY MANAGEMENT TABLE
           5.11.3 IMMERSION COOLING TECHNOLOGY - COUNTRY/REGIONAL REGULATIONS
                    5.11.3.1 US
                    5.11.3.2 Europe
                    5.11.3.3 China
                    5.11.3.4 Japan
                    5.11.3.5 India
                                 TABLE 23 APPROACHES IN INDIAN CONTEXT
           5.11.4 REGULATORY BODIES, GOVERNMENT AGENCIES, AND OTHER ORGANIZATIONS
                     TABLE 24 NORTH AMERICA: LIST OF REGULATORY BODIES, GOVERNMENT AGENCIES, AND OTHER ORGANIZATIONS
                     TABLE 25 EUROPE: LIST OF REGULATORY BODIES, GOVERNMENT AGENCIES, AND OTHER ORGANIZATIONS
    5.12 KEY STAKEHOLDERS & BUYING CRITERIA 
           5.12.1 KEY STAKEHOLDERS IN BUYING PROCESS
                     FIGURE 31 INFLUENCE OF STAKEHOLDERS IN BUYING PROCESS FOR TOP THREE APPLICATIONS
                    5.12.1.1 Buying criteria for cryptocurrency mining
           5.12.2 BUYING CRITERIA
                     TABLE 26 KEY BUYING CRITERIA
                     FIGURE 32 KEY BUYING CRITERIA FOR TOP THREE APPLICATIONS
    5.13 MARKETING CHANNELS USED BY IMMERSION COOLING SOLUTION PROVIDERS: COMPARATIVE ANALYSIS 
           5.13.1 B2B MARKETING CHANNELS - COMPARATIVE ANALYSIS
                     TABLE 27 DETAILS OF DIFFERENT DISTRIBUTION CHANNELS
    5.14 PARTNERS OF IMMERSION COOLING COMPANIES 
           5.14.1 PARTNERSHIPS
                     TABLE 28 LIST OF PARTNER COMPANIES OF MAJOR IMMERSION COOLING SOLUTION PROVIDERS
    5.15 TOTAL COST OF OWNERSHIP 
           TABLE 29 AVERAGE PRICE OF COOLING FLUID (USD/LITER)
    5.16 CASE STUDY ANALYSIS 
           5.16.1 ASPERITAS AND ITRENEW PARTNER TO BRING SUSTAINABLE, PLUG-AND-PLAY DATA CENTER SOLUTION FULL CIRCLE
           5.16.2 DUG REDUCED ENERGY SPENDING IN DATA CENTER BY ADOPTING GRC'S IMMERSION COOLING TECHNOLOGY
           5.16.3 MICROSOFT CHOSE IMMERSION COOLING TECHNOLOGY BY LIQUIDSTACK FOR ITS CLOUD SERVERS
           5.16.4 BITFURY GROUP ENHANCES DATA CENTER COOLING EFFICIENCY USING 3M'S ENGINEERED FLUIDS
           5.16.5 MACQUARIE TELECOM GROUP TO DEPLOY SUBMER'S IMMERSION COOLING SOLUTIONS AT ITS DATA CENTERS
           5.16.6 NTT DATA CORPORATION TO ADOPT LIQUIDSTACK'S TWO-PHASE IMMERSION COOLING SOLUTIONS AT ITS DATA CENTERS
 
6 IMMERSION COOLING MARKET, BY TYPE (Page No. - 102)
    6.1 INTRODUCTION 
          FIGURE 33 IMMERSION COOLING MARKET, BY TYPE, 2023 & 2031 (USD MILLION)
          TABLE 30 IMMERSION COOLING MARKET, BY TYPE, 2017–2022 (USD MILLION)
          TABLE 31 IMMERSION COOLING MARKET, BY TYPE, 2023–2031 (USD MILLION)
    6.2 SINGLE-PHASE IMMERSION COOLING 
           6.2.1 OFFERS EFFICIENT COOLING AND LOW MAINTENANCE
                    TABLE 32 SINGLE-PHASE IMMERSION COOLING MARKET, BY REGION, 2017–2022 (USD MILLION)
                    TABLE 33 SINGLE-PHASE IMMERSION COOLING MARKET, BY REGION, 2023–2031 (USD MILLION)
    6.3 TWO-PHASE IMMERSION COOLING 
           6.3.1 FLUID LOSS REMAINS PRIMARY CONCERN IN TWO-PHASE IMMERSION COOLING SYSTEMS
                    TABLE 34 TWO-PHASE IMMERSION COOLING MARKET, BY REGION, 2017–2022 (USD MILLION)
                    TABLE 35 TWO-PHASE IMMERSION COOLING MARKET, BY REGION, 2023–2031 (USD MILLION)
 
7 IMMERSION COOLING MARKET, BY APPLICATION (Page No. - 107)
    7.1 INTRODUCTION 
          FIGURE 34 IMMERSION COOLING MARKET, BY APPLICATION, 2023 & 2031 (USD MILLION)
          TABLE 36 IMMERSION COOLING MARKET, BY APPLICATION, 2017–2022 (USD MILLION)
          TABLE 37 IMMERSION COOLING MARKET, BY APPLICATION, 2023–2031 (USD MILLION)
    7.2 HIGH-PERFORMANCE COMPUTING 
           7.2.1 NEED FOR HIGH-EFFICIENCY COOLING TO DRIVE MARKET
                    TABLE 38 IMMERSION COOLING MARKET IN HIGH-PERFORMANCE COMPUTING, BY REGION, 2017–2022 (USD MILLION)
                    TABLE 39 IMMERSION COOLING MARKET IN HIGH-PERFORMANCE COMPUTING, BY REGION, 2023–2031 (USD MILLION)
    7.3 EDGE COMPUTING 
           7.3.1 EDGE COMPUTING GAINING TRACTION IN OIL & GAS, DEFENSE, AND TELECOM INDUSTRIES
                    TABLE 40 IMMERSION COOLING MARKET IN EDGE COMPUTING, BY REGION, 2017–2022 (USD MILLION)
                    TABLE 41 IMMERSION COOLING MARKET IN EDGE COMPUTING, BY REGION, 2023–2031 (USD MILLION)
    7.4 ARTIFICIAL INTELLIGENCE 
           7.4.1 DIGITAL TRANSFORMATION OF COMPANIES EXPECTED TO DRIVE MARKET IN AI APPLICATION SEGMENT
                    TABLE 42 IMMERSION COOLING MARKET IN ARTIFICIAL INTELLIGENCE, BY REGION, 2017–2022 (USD MILLION)
                    TABLE 43 IMMERSION COOLING MARKET IN ARTIFICIAL INTELLIGENCE, BY REGION, 2023–2031 (USD MILLION)
    7.5 CRYPTOCURRENCY MINING 
           7.5.1 IMMERSION COOLING MARKET TO WITNESS HIGHEST GROWTH IN CRYPTOCURRENCY MINING APPLICATION
                    TABLE 44 IMMERSION COOLING MARKET IN CRYPTOCURRENCY MINING, BY REGION, 2017–2022 (USD MILLION)
                    TABLE 45 IMMERSION COOLING MARKET IN CRYPTOCURRENCY MINING, BY REGION, 2023–2031 (USD MILLION)
    7.6 OTHERS 
          TABLE 46 IMMERSION COOLING MARKET IN OTHER APPLICATIONS, BY REGION, 2017–2022 (USD MILLION)
          TABLE 47 IMMERSION COOLING MARKET IN OTHER APPLICATIONS, BY REGION, 2023–2031 (USD MILLION)
 
8 IMMERSION COOLING MARKET, BY COMPONENT (Page No. - 116)
    8.1 INTRODUCTION 
          FIGURE 35 IMMERSION COOLING MARKET, BY COMPONENT, 2023 & 2031 (USD MILLION)
          TABLE 48 IMMERSION COOLING MARKET, BY COMPONENT, 2017–2022 (USD MILLION)
          TABLE 49 IMMERSION COOLING MARKET, BY COMPONENT, 2023–2031 (USD MILLION)
    8.2 SOLUTIONS 
           8.2.1 GROWING DEMAND FOR HIGH-DENSITY SERVER COOLING TO DRIVE MARKET
                    TABLE 50 SOLUTIONS: IMMERSION COOLING MARKET, BY REGION, 2017–2022 (USD MILLION)
                    TABLE 51 SOLUTIONS: IMMERSION COOLING MARKET, BY REGION, 2023–2031 (USD MILLION)
    8.3 SERVICES 
           8.3.1 ASIA PACIFIC TO WITNESS HIGHEST GROWTH IN SERVICES SEGMENT
                    TABLE 52 SERVICES: IMMERSION COOLING MARKET, BY REGION, 2017–2022 (USD MILLION)
                    TABLE 53 SERVICES: IMMERSION COOLING MARKET, BY REGION, 2023–2031 (USD MILLION)
 
9 IMMERSION COOLING MARKET, BY COOLING FLUID (Page No. - 120)
    9.1 INTRODUCTION 
          FIGURE 36 IMMERSION COOLING MARKET, BY COOLING FLUID, 2023 & 2031 (USD MILLION)
          TABLE 54 IMMERSION COOLING MARKET, BY COOLING FLUID, 2017–2022 (USD MILLION)
          TABLE 55 IMMERSION COOLING MARKET, BY COOLING FLUID, 2023–2031 (USD MILLION)
    9.2 MINERAL OIL 
           9.2.1 ASIA PACIFIC TO BE FASTEST-GROWING MARKET FOR MINERAL OIL SEGMENT
                    TABLE 56 MINERAL OIL: IMMERSION COOLING MARKET, BY REGION, 2017–2022 (USD MILLION)
                    TABLE 57 MINERAL OIL: IMMERSION COOLING MARKET, BY REGION, 2023–2031 (USD MILLION)
    9.3 FLUOROCARBON-BASED FLUIDS 
           9.3.1 FLUOROCARBON-BASED FLUIDS INCREASINGLY USED IN HIGH-PERFORMANCE LIQUID COOLING APPLICATIONS
                    TABLE 58 FLUOROCARBON-BASED FLUIDS: IMMERSION COOLING MARKET, BY REGION, 2017–2022 (USD MILLION)
                    TABLE 59 FLUOROCARBON-BASED FLUIDS: IMMERSION COOLING MARKET, BY REGION, 2023–2031 (USD MILLION)
    9.4 SYNTHETIC FLUIDS 
           9.4.1 LOW CORROSION & LOW FLAMMABILITY FUELING DEMAND
                    TABLE 60 SYNTHETIC FLUIDS: IMMERSION COOLING MARKET, BY REGION, 2017–2022 (USD MILLION)
                    TABLE 61 SYNTHETIC FLUIDS: IMMERSION COOLING MARKET, BY REGION, 2023–2031 (USD MILLION)
    9.5 OTHERS 
          TABLE 62 OTHER FLUIDS: IMMERSION COOLING MARKET, BY REGION, 2017–2022 (USD MILLION)
          TABLE 63 OTHER FLUIDS: IMMERSION COOLING MARKET, BY REGION, 2023–2031 (USD MILLION)
 
10 IMMERSION COOLING MARKET, BY REGION (Page No. - 127)
     10.1 INTRODUCTION 
             FIGURE 37 IMMERSION COOLING MARKET IN CHINA TO WITNESS HIGHEST CAGR DURING FORECAST PERIOD
             TABLE 64 IMMERSION COOLING MARKET, BY REGION, 2017–2022 (USD MILLION)
             TABLE 65 IMMERSION COOLING MARKET, BY REGION, 2023–2031 (USD MILLION)
     10.2 ASIA PACIFIC 
             FIGURE 38 ASIA PACIFIC: IMMERSION COOLING MARKET SNAPSHOT
             TABLE 66 ASIA PACIFIC: IMMERSION COOLING MARKET, BY COUNTRY, 2017–2022 (USD MILLION)
             TABLE 67 ASIA PACIFIC: IMMERSION COOLING MARKET, BY COUNTRY, 2023–2031 (USD MILLION)
             TABLE 68 ASIA PACIFIC: IMMERSION COOLING MARKET, BY APPLICATION, 2017–2022 (USD MILLION)
             TABLE 69 ASIA PACIFIC: IMMERSION COOLING MARKET, BY APPLICATION, 2023–2031 (USD MILLION)
             TABLE 70 ASIA PACIFIC: IMMERSION COOLING MARKET, BY TYPE, 2017–2022 (USD MILLION)
             TABLE 71 ASIA PACIFIC: IMMERSION COOLING MARKET, BY TYPE, 2023–2031 (USD MILLION)
             TABLE 72 ASIA PACIFIC: IMMERSION COOLING MARKET, BY COOLING FLUID, 2017–2022 (USD MILLION)
             TABLE 73 ASIA PACIFIC: IMMERSION COOLING MARKET, BY COOLING FLUID, 2023–2031 (USD MILLION)
             TABLE 74 ASIA PACIFIC: IMMERSION COOLING MARKET, BY COMPONENT, 2017–2022 (USD MILLION)
             TABLE 75 ASIA PACIFIC: IMMERSION COOLING MARKET, BY COMPONENT, 2023–2031 (USD MILLION)
             10.2.1 CHINA
                        10.2.1.1 Rise in number of data centers to drive market
                                      TABLE 76 CHINA: IMMERSION COOLING MARKET, BY APPLICATION, 2017–2022 (USD MILLION)
                                      TABLE 77 CHINA: IMMERSION COOLING MARKET, BY APPLICATION, 2023–2031 (USD MILLION)
             10.2.2 INDIA
                        10.2.2.1 Surging demand from data centers to boost market
                                      TABLE 78 INDIA: IMMERSION COOLING MARKET, BY APPLICATION, 2017–2022 (USD MILLION)
                                      TABLE 79 INDIA: IMMERSION COOLING MARKET, BY APPLICATION, 2023–2031 (USD MILLION)
             10.2.3 JAPAN
                        10.2.3.1 Redesigning of existing data center facilities to drive market
                                      TABLE 80 JAPAN: IMMERSION COOLING MARKET, BY APPLICATION, 2017–2022 (USD MILLION)
                                      TABLE 81 JAPAN: IMMERSION COOLING MARKET, BY APPLICATION, 2023–2031 (USD MILLION)
             10.2.4 SOUTH KOREA
                        10.2.4.1 Advancements in AI and cryptocurrency mining to drive market
                                      TABLE 82 SOUTH KOREA: IMMERSION COOLING MARKET, BY APPLICATION, 2017–2022 (USD MILLION)
                                      TABLE 83 SOUTH KOREA: IMMERSION COOLING MARKET, BY APPLICATION, 2023–2031 (USD MILLION)
             10.2.5 THAILAND
                        10.2.5.1 Expansion of digital hardware infrastructure to fuel market
                                      TABLE 84 THAILAND: IMMERSION COOLING MARKET, BY APPLICATION, 2017–2022 (USD MILLION)
                                      TABLE 85 THAILAND: IMMERSION COOLING MARKET, BY APPLICATION, 2023–2031 (USD MILLION)
             10.2.6 MALAYSIA
                        10.2.6.1 Rapid cloud service adoption to fuel market
                                      TABLE 86 MALAYSIA: IMMERSION COOLING MARKET, BY APPLICATION, 2017–2022 (USD MILLION)
                                      TABLE 87 MALAYSIA: IMMERSION COOLING MARKET, BY APPLICATION, 2023–2031 (USD MILLION)
             10.2.7 REST OF ASIA PACIFIC
                        TABLE 88 REST OF ASIA PACIFIC: IMMERSION COOLING MARKET, BY APPLICATION, 2017–2022 (USD MILLION)
                        TABLE 89 REST OF ASIA PACIFIC: IMMERSION COOLING MARKET, BY APPLICATION, 2023–2031 (USD MILLION)
     10.3 EUROPE 
             FIGURE 39 EUROPE: IMMERSION COOLING MARKET SNAPSHOT
             TABLE 90 EUROPE: IMMERSION COOLING MARKET, BY COUNTRY, 2017–2022 (USD MILLION)
             TABLE 91 EUROPE: IMMERSION COOLING MARKET, BY COUNTRY, 2023–2031 (USD MILLION)
             TABLE 92 EUROPE: IMMERSION COOLING MARKET, BY APPLICATION, 2017–2022 (USD MILLION)
             TABLE 93 EUROPE: IMMERSION COOLING MARKET, BY APPLICATION, 2023–2031 (USD MILLION)
             TABLE 94 EUROPE: IMMERSION COOLING MARKET, BY TYPE, 2017–2022 (USD MILLION)
             TABLE 95 EUROPE: IMMERSION COOLING MARKET, BY TYPE, 2023–2031 (USD MILLION)
             TABLE 96 EUROPE: IMMERSION COOLING MARKET, BY COOLING FLUID, 2017–2022 (USD MILLION)
             TABLE 97 EUROPE: IMMERSION COOLING MARKET, BY COOLING FLUID, 2023–2031 (USD MILLION)
             TABLE 98 EUROPE: IMMERSION COOLING MARKET, BY COMPONENT, 2017–2022 (USD MILLION)
             TABLE 99 EUROPE: IMMERSION COOLING MARKET, BY COMPONENT, 2023–2031 (USD MILLION)
             10.3.1 GERMANY
                        10.3.1.1 Attractive investments and growth of data centers to boost market
                                      TABLE 100 GERMANY: IMMERSION COOLING MARKET, BY APPLICATION, 2017–2022 (USD MILLION)
                                      TABLE 101 GERMANY: IMMERSION COOLING MARKET, BY APPLICATION, 2023–2031 (USD MILLION)
             10.3.2 FRANCE
                        10.3.2.1 Rising demand for immersion cooling from cloud providers to drive market
                                      TABLE 102 FRANCE: IMMERSION COOLING MARKET, BY APPLICATION, 2017–2022 (USD MILLION)
                                      TABLE 103 FRANCE: IMMERSION COOLING MARKET, BY APPLICATION, 2023–2031 (USD MILLION)
             10.3.3 NETHERLANDS
                        10.3.3.1 Use of green energy for data centers to propel market
                                      TABLE 104 NETHERLANDS: IMMERSION COOLING MARKET, BY APPLICATION, 2017–2022 (USD MILLION)
                                      TABLE 105 NETHERLANDS: IMMERSION COOLING MARKET, BY APPLICATION, 2023–2031 (USD MILLION)
             10.3.4 UK
                        10.3.4.1 New eco-design requirements set by European parliament for servers and data centers to drive market
                                      TABLE 106 UK: IMMERSION COOLING MARKET, BY APPLICATION, 2017–2022 (USD MILLION)
                                      TABLE 107 UK: IMMERSION COOLING MARKET, BY APPLICATION, 2023–2031 (USD MILLION)
             10.3.5 RUSSIA
                        10.3.5.1 Growing demand for computing resources and data storage systems to drive market
                                      TABLE 108 RUSSIA: IMMERSION COOLING MARKET, BY APPLICATION, 2017–2022 (USD MILLION)
                                      TABLE 109 RUSSIA: IMMERSION COOLING MARKET, BY APPLICATION, 2023–2031 (USD MILLION)
             10.3.6 SPAIN
                        10.3.6.1 Innovations in cloud computing to boost demand for data center solutions
                                      TABLE 110 SPAIN: IMMERSION COOLING MARKET, BY APPLICATION, 2017–2022 (USD MILLION)
                                      TABLE 111 SPAIN: IMMERSION COOLING MARKET, BY APPLICATION, 2023–2031 (USD MILLION)
             10.3.7 REST OF EUROPE
                        TABLE 112 REST OF EUROPE: IMMERSION COOLING MARKET, BY APPLICATION, 2017–2022 (USD MILLION)
                        TABLE 113 REST OF EUROPE: IMMERSION COOLING MARKET, BY APPLICATION, 2023–2031 (USD MILLION)
     10.4 NORTH AMERICA 
             FIGURE 40 NORTH AMERICA: IMMERSION COOLING MARKET SNAPSHOT
             TABLE 114 NORTH AMERICA: IMMERSION COOLING MARKET, BY COUNTRY, 2017–2022 (USD MILLION)
             TABLE 115 NORTH AMERICA: IMMERSION COOLING MARKET, BY COUNTRY, 2023–2031 (USD MILLION)
             TABLE 116 NORTH AMERICA: IMMERSION COOLING MARKET, BY APPLICATION, 2017–2022 (USD MILLION)
             TABLE 117 NORTH AMERICA: IMMERSION COOLING MARKET, BY APPLICATION, 2023–2031 (USD MILLION)
             TABLE 118 NORTH AMERICA: IMMERSION COOLING MARKET, BY TYPE, 2017–2022 (USD MILLION)
             TABLE 119 NORTH AMERICA: IMMERSION COOLING MARKET, BY TYPE, 2023–2031 (USD MILLION)
             TABLE 120 NORTH AMERICA: IMMERSION COOLING MARKET, BY COOLING FLUID, 2017–2022 (USD MILLION)
             TABLE 121 NORTH AMERICA: IMMERSION COOLING MARKET, BY COOLING FLUID, 2023–2031 (USD MILLION)
             TABLE 122 NORTH AMERICA: IMMERSION COOLING MARKET, BY COMPONENT, 2017–2022 (USD MILLION)
             TABLE 123 NORTH AMERICA: IMMERSION COOLING MARKET, BY COMPONENT, 2023–2031 (USD MILLION)
             10.4.1 US
                        10.4.1.1 Surging demand from cryptocurrency providers to drive market
                                      TABLE 124 US: IMMERSION COOLING MARKET, BY APPLICATION, 2017–2022 (USD MILLION)
                                      TABLE 125 US: IMMERSION COOLING MARKET, BY APPLICATION, 2023–2031 (USD MILLION)
             10.4.2 CANADA
                        10.4.2.1 Increasing digitalization and massive data generation to drive market
                                      TABLE 126 CANADA: IMMERSION COOLING MARKET, BY APPLICATION, 2017–2022 (USD MILLION)
                                      TABLE 127 CANADA: IMMERSION COOLING MARKET, BY APPLICATION, 2023–2031 (USD MILLION)
             10.4.3 MEXICO
                        10.4.3.1 Big data and automation technologies to drive market
                                      TABLE 128 MEXICO: IMMERSION COOLING MARKET, BY APPLICATION, 2017–2022 (USD MILLION)
                                      TABLE 129 MEXICO: IMMERSION COOLING MARKET, BY APPLICATION, 2023–2031 (USD MILLION)
     10.5 MIDDLE EAST & AFRICA 
             TABLE 130 MIDDLE EAST & AFRICA: IMMERSION COOLING MARKET, BY APPLICATION, 2017–2022 (USD MILLION)
             TABLE 131 MIDDLE EAST & AFRICA: IMMERSION COOLING MARKET, BY APPLICATION, 2023–2031 (USD MILLION)
             TABLE 132 MIDDLE EAST & AFRICA: IMMERSION COOLING MARKET, BY TYPE, 2017–2022 (USD MILLION)
             TABLE 133 MIDDLE EAST & AFRICA: IMMERSION COOLING MARKET, BY TYPE, 2023–2031 (USD MILLION)
             TABLE 134 MIDDLE EAST & AFRICA: IMMERSION COOLING MARKET, BY COOLING FLUID, 2017–2022 (USD MILLION)
             TABLE 135 MIDDLE EAST & AFRICA: IMMERSION COOLING MARKET, BY COOLING FLUID, 2023–2031 (USD MILLION)
             TABLE 136 MIDDLE EAST & AFRICA: IMMERSION COOLING MARKET, BY COMPONENT, 2017–2022 (USD MILLION)
             TABLE 137 MIDDLE EAST & AFRICA: IMMERSION COOLING MARKET, BY COMPONENT, 2023–2031 (USD MILLION)
     10.6 SOUTH AMERICA 
             TABLE 138 SOUTH AMERICA: IMMERSION COOLING MARKET, BY APPLICATION, 2017–2022 (USD MILLION)
             TABLE 139 SOUTH AMERICA: IMMERSION COOLING MARKET, BY APPLICATION, 2023–2031 (USD MILLION)
             TABLE 140 SOUTH AMERICA: IMMERSION COOLING MARKET, BY TYPE, 2017–2022 (USD MILLION)
             TABLE 141 SOUTH AMERICA: IMMERSION COOLING MARKET, BY TYPE, 2023–2031 (USD MILLION)
             TABLE 142 SOUTH AMERICA: IMMERSION COOLING MARKET, BY COOLING FLUID, 2017–2022 (USD MILLION)
             TABLE 143 SOUTH AMERICA: IMMERSION COOLING MARKET, BY COOLING FLUID, 2023–2031 (USD MILLION)
             TABLE 144 SOUTH AMERICA: IMMERSION COOLING MARKET, BY COMPONENT, 2017–2022 (USD MILLION)
             TABLE 145 SOUTH AMERICA: IMMERSION COOLING MARKET, BY COMPONENT, 2023–2031 (USD MILLION)
 
11 COMPETITIVE LANDSCAPE (Page No. - 167)
     11.1 INTRODUCTION 
     11.2 STRATEGIES ADOPTED BY KEY MARKET PLAYERS 
             11.2.1 STRATEGIES ADOPTED BY KEY IMMERSION COOLING TECHNOLOGY PROVIDERS
     11.3 MARKET SHARE ANALYSIS 
             11.3.1 RANKING OF KEY MARKET PLAYERS, 2022
                        FIGURE 41 RANKING OF TOP FIVE PLAYERS IN IMMERSION COOLING MARKET, 2022
             11.3.2 MARKET SHARE OF KEY PLAYERS
                        TABLE 146 IMMERSION COOLING MARKET: DEGREE OF COMPETITION
                        FIGURE 42 LEADING PLAYERS ACCOUNTED FOR 60% TO 70% OF GLOBAL MARKET IN 2022
     11.4 COMPANY EVALUATION MATRIX 
             11.4.1 STARS
             11.4.2 EMERGING LEADERS
             11.4.3 PERVASIVE PLAYERS
             11.4.4 PARTICIPANTS
                        FIGURE 43 IMMERSION COOLING MARKET: COMPANY EVALUATION MATRIX, 2022
             11.4.5 COMPANY FOOTPRINT
                        FIGURE 44 IMMERSION COOLING MARKET: COMPANY PRODUCT FOOTPRINT
             11.4.6 COMPANY PRODUCT TYPE FOOTPRINT
             11.4.7 COMPANY APPLICATION FOOTPRINT
             11.4.8 COMPANY REGION FOOTPRINT
             11.4.9 COMPANY OVERALL FOOTPRINT
     11.5 STARTUP/SME EVALUATION MATRIX 
             11.5.1 PROGRESSIVE COMPANIES
             11.5.2 RESPONSIVE COMPANIES
             11.5.3 DYNAMIC COMPANIES
             11.5.4 STARTING BLOCKS
                        FIGURE 45 IMMERSION COOLING MARKET: STARTUP/SME EVALUATION MATRIX, 2022
             11.5.5 COMPETITIVE BENCHMARKING
                        TABLE 147 IMMERSION COOLING MARKET: DETAILED LIST OF KEY START-UPS/SMES
                        TABLE 148 IMMERSION COOLING MARKET: COMPETITIVE BENCHMARKING OF KEY STARTUPS/SMES
     11.6 COMPETITIVE SCENARIO AND TRENDS 
             TABLE 149 IMMERSION COOLING MARKET: PRODUCT LAUNCHES, 2018–2022
             TABLE 150 IMMERSION COOLING MARKET: DEALS, 2018–2022
             TABLE 151 IMMERSION COOLING MARKET: OTHERS, 2018–2022
 
12 COMPANY PROFILES (Page No. - 185)
     12.1 KEY COMPANIES 
(Business Overview, Products Offered, Recent Developments, and MnM View (Key strengths/Right to Win, Strategic Choices Made, and Weaknesses and Competitive Threats))*
             12.1.1 GREEN REVOLUTION COOLING INC.
                        TABLE 152 GREEN REVOLUTION COOLING INC.: COMPANY OVERVIEW
             12.1.2 SUBMER
                        TABLE 153 SUBMER: COMPANY OVERVIEW
             12.1.3 ASPERITAS
                        TABLE 154 ASPERITAS: COMPANY OVERVIEW
             12.1.4 LIQUIDSTACK
                        TABLE 155 LIQUIDSTACK: COMPANY OVERVIEW
             12.1.5 MIDAS IMMERSION COOLING
                        TABLE 156 MIDAS IMMERSION COOLING: COMPANY OVERVIEW
             12.1.6 FUJITSU
                        TABLE 157 FUJITSU: COMPANY OVERVIEW
                        FIGURE 46 FUJITSU: COMPANY SNAPSHOT
             12.1.7 ICEOTOPE TECHNOLOGIES LIMITED
                        TABLE 158 ICEOTOPE TECHNOLOGIES LIMITED: COMPANY OVERVIEW
             12.1.8 LIQUIDCOOL SOLUTIONS
                        TABLE 159 LIQUIDCOOL SOLUTIONS: COMPANY OVERVIEW
             12.1.9 DUG TECHNOLOGY
                        TABLE 160 DUG TECHNOLOGY: COMPANY OVERVIEW
                        FIGURE 47 DUG TECHNOLOGY: COMPANY SNAPSHOT
             12.1.10 DCX- THE LIQUID COOLING COMPANY
                        TABLE 161 DCX -THE LIQUID COOLING COMPANY: COMPANY OVERVIEW
             12.1.11 BITFURY GROUP LIMITED
                        TABLE 162 BITFURY GROUP LIMITED: COMPANY OVERVIEW
             12.1.12 3M
                        TABLE 163 3M: COMPANY OVERVIEW
             12.1.13 ENGINEERED FLUIDS
                        TABLE 164 ENGINEERED FLUIDS: COMPANY OVERVIEW
             12.1.14 TEIMMERS
                        TABLE 165 TEIMMERS: COMPANY OVERVIEW
             12.1.15 TMGCORE, INC.
                        TABLE 166 TMGCORE, INC.: COMPANY OVERVIEW
             12.1.16 GIGA-BYTE TECHNOLOGY CO., LTD.
                        TABLE 167 GIGA-BYTE TECHNOLOGY CO., LTD.: COMPANY OVERVIEW
                        FIGURE 48 GIGA-BYTE TECHNOLOGY CO., LTD.: COMPANY SNAPSHOT
             12.1.17 WIWYNN
                        TABLE 168 WIWYNN: COMPANY OVERVIEW
                        FIGURE 49 WIWYNN: COMPANY SNAPSHOT
             12.1.18 HYPERTEC
                        TABLE 169 HYPERTEC: COMPANY OVERVIEW
             12.1.19 PEZY COMPUTING
                        TABLE 170 PEZY COMPUTING: COMPANY OVERVIEW
             12.1.20 PRASA
                        TABLE 171 PRASA: COMPANY OVERVIEW
             12.1.21 2CRSI GROUP
                        TABLE 172 2CRSI GROUP: COMPANY OVERVIEW
             12.1.22 KAORI HEAT TREATMENT CO., LTD.
                        TABLE 173 KAORI HEAT TREATMENT CO., LTD.: COMPANY OVERVIEW
             12.1.23 TAS
                        TABLE 174 TAS: COMPANY OVERVIEW
             12.1.24 DELTA POWER SOLUTIONS
                        TABLE 175 DELTA POWER SOLUTIONS: COMPANY OVERVIEW
                        FIGURE 50 DELTA POWER SOLUTIONS: COMPANY SNAPSHOT
             12.1.25 BOYD
                        TABLE 176 BOYD: COMPANY OVERVIEW
             12.1.26 RSI K.K.
                        TABLE 177 RSI K.K.: COMPANY OVERVIEW
 
*Details on Business Overview, Products Offered, Recent Developments, and MnM View (Key strengths/Right to Win, Strategic Choices Made, and Weaknesses and Competitive Threats) might not be captured in case of unlisted companies.
 
13 ADJACENT AND RELATED MARKETS (Page No. - 237)
     13.1 INTRODUCTION 
     13.2 LIMITATIONS 
     13.3 IMMERSION COOLING INTERCONNECTED MARKETS 
             13.3.1 DATA CENTER LIQUID COOLING MARKET
                        13.3.1.1 Market definition
                        13.3.1.2 Market overview
                        13.3.1.3 Data center liquid cooling market, by type of cooling
     13.4 COLD PLATE LIQUID COOLING 
             13.4.1 HIGH-DENSITY DATA CENTER INSTALLATION TO DRIVE DEMAND
     13.5 IMMERSED LIQUID COOLING 
             13.5.1 LOW CARBON FOOTPRINT THROUGH IMMERSION LIQUID COOLING TO DRIVE SEGMENT
                        TABLE 178 DATA CENTER LIQUID COOLING MARKET, BY TYPE OF COOLING, 2017–2022 (USD MILLION)
                        TABLE 179 DATA CENTER LIQUID COOLING MARKET, BY TYPE OF COOLING, 2023–2028 (USD MILLION)
 
14 APPENDIX (Page No. - 240)
     14.1 DISCUSSION GUIDE 
     14.2 KNOWLEDGESTORE: MARKETSANDMARKETS’ SUBSCRIPTION PORTAL 
     14.3 CUSTOMIZATION OPTIONS 
     14.4 RELATED REPORTS 
     14.5 AUTHOR DETAILS 

The study involved four major activities in estimating the current Immersion Cooling market size—exhaustive secondary research collected information on the market, peer, and parent markets. The next step was to validate these findings, assumptions, and measures with industry experts across the value chain of immersion cooling technology through primary research. Both top-down and bottom-up approaches were employed to estimate the total market size. After that, market breakdown and data triangulation were used to estimate the size of the segments and sub-segments of the market.

Secondary Research

The research methodology used to estimate and forecast the access control market begins with capturing data on the revenues of key vendors in the market through secondary research. In the secondary research process, various secondary sources, such as Hoovers, Bloomberg BusinessWeek, Factiva, and Industry Journals, were referred to for identifying and collecting information for this study. These secondary sources included annual reports, press releases & investor presentations of companies, white papers, certified publications, articles by recognized authors, notifications by regulatory bodies, trade directories, and databases. Vendor offerings have also been taken into consideration to determine market segmentation.

Primary Research

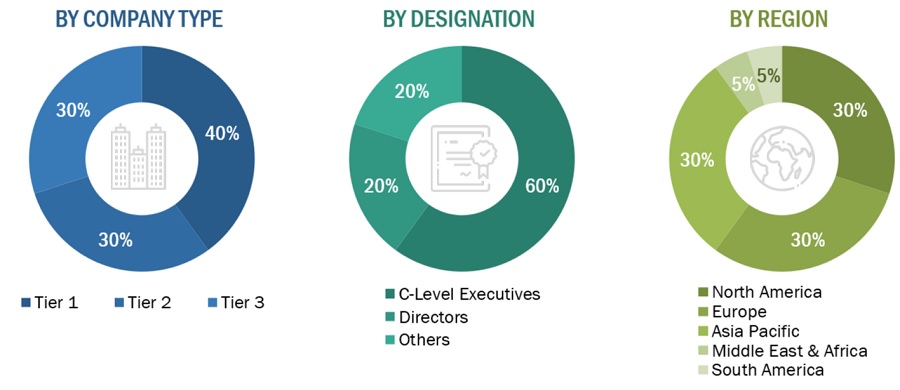
The immersion cooling market comprises several stakeholders in the supply chain, such as immersion cooling fluid providers, technology manufacturers, data centers manufacurures, traders, associations, and regulatory organizations. The demand side of this market is characterized by the development of high performance computing, edge computing, artificial intelligence, cryptocurrency mining, and other applications industries. Various primary sources from the supply and demand sides of the market were interviewed to obtain qualitative and quantitative information. Following is the breakdown of the primary respondents:
Immersion Cooling Market Size, and Share

Note: “Others” includes sales, marketing, and product managers

To know about the assumptions considered for the study, download the pdf brochure

Market Size Estimation

The top-down and bottom-up approaches were used to estimate and validate the total size of the immersion cooling market. These methods were also used extensively to determine the market size of various segments. The research methodology used to estimate the market size included the following:

  • The key players were identified through extensive primary and secondary research.
  • The value chain and market size of the immersion cooling market, in terms of value, were determined through primary and secondary research.
  • All percentage shares, splits, and breakdowns were determined using secondary sources and verified through primary sources.
  • All possible parameters that affect the market covered in this research study were accounted for, viewed in extensive detail, verified through primary research, and analyzed to obtain the final quantitative and qualitative data.
  • The research included the study of reports, reviews, and newsletters of top market players, along with extensive interviews for opinions from key leaders, such as CEOs, directors, and marketing executives.

Global Immersion Cooling Market Size: Bottom-Up Approach

Immersion Cooling Market Size, and Share

To know about the assumptions considered for the study, Request for Free Sample Report

Global Immersion Cooling Market Size: Top-Down Approach

Immersion Cooling Market Size, and Share

Data Triangulation

The market was split into several segments and sub-segments after arriving at the overall market size using the market size estimation processes as explained above. Data triangulation and market breakdown procedures were employed to complete the overall market engineering process and arrive at the exact statistics of each market segment and subsegment. The market size was calculated globally by summing up the country-level and regional-level data.

Market Definition

The global immersion cooling market refers to the industry involved in providing advanced cooling solutions for electronic components, particularly in data centers and high-performance computing environments. In immersion cooling, electronic hardware is submerged in dielectric fluids, which efficiently absorb and dissipate heat generated during operation. This innovative cooling method is gaining traction worldwide due to its ability to enhance energy efficiency, reduce operational costs, and optimize overall system performance. As the demand for high-density computing continues to rise, the global immersion cooling market plays a crucial role in addressing the challenges associated with heat dissipation and supporting the evolution of more sustainable and efficient data center infrastructure on a global scale.

Key Stakeholder

  • Data center Manufacturers
  • Crypto Miners.
  • Manufacturers of immersion cooling fluids.
  • Associations and Industrial Bodies such as The American National Standards Institute (ANSI), The American Society of Heating, Refrigerating, and Air-Conditioning Engineers (ASHRAE), The National Electrical Manufacturers Association (NEMA), The Telecommunication Industry Association (TIA), The Canadian Standards Association Group (CSA Group), and Others
  • NGOs, Governments, Investment Banks, Venture Capitalists, and Private Equity Firms

Report Objectives:

  • To define, describe, and forecast the size of the global immersion cooling market in terms of value
  • To provide detailed information regarding the key factors, such as drivers, restraints, opportunities, and industry-specific challenges, influencing the growth of the immersion cooling market
  • To analyze and forecast the size of various segments (type, application and cooling fluid) of the immersion cooling market based on five major regions—North America, Europe, Asia Pacific, South America, Middle East, and Africa—along with key countries in each of these regions
  • To analyze recent developments and competitive strategies, such as expansions, new product developments, collaborations, and acquisitions, to draw the competitive landscape of the market
  • To strategically profile the key players in the market and comprehensively analyze their core competencies

Available Customizations

MarketsandMarkets offers the following customizations for this market report:

  • Further breakdown of the Middle East & African, and South American immersion cooling markets
  • Product matrix, which gives a detailed comparison of the product portfolio of each company
  • Detailed analysis and profiles of additional market players (up to 3)
Custom Market Research Services

We will customize the research for you, in case the report listed above does not meet with your exact requirements. Our custom research will comprehensively cover the business information you require to help you arrive at strategic and profitable business decisions.

Request Customization

Instant Answers with GPT - Ask Now!

Ask real questions. Get complete answers !
Report Code
CH 7299
Published ON
Dec, 2023
Choose License Type
BUY NOW
  • SHARE
X
Request Customization
Speak to Analyst
Speak to Analyst
OR FACE-TO-FACE MEETING
PERSONALIZE THIS RESEARCH
  • Triangulate with your Own Data
  • Get Data as per your Format and Definition
  • Gain a Deeper Dive on a Specific Application, Geography, Customer or Competitor
  • Any level of Personalization
REQUEST A FREE CUSTOMIZATION
LET US HELP YOU!
  • What are the Known and Unknown Adjacencies Impacting the Immersion Cooling Market
  • What will your New Revenue Sources be?
  • Who will be your Top Customer; what will make them switch?
  • Defend your Market Share or Win Competitors
  • Get a Scorecard for Target Partners
CUSTOMIZED WORKSHOP REQUEST
+1-888-600-6441
  • Call Us
  • +1-888-600-6441 (Corporate office hours)
  • +1-888-600-6441 (US/Can toll free)
  • +44-800-368-9399 (UK office hours)
CONNECT WITH US
ABOUT TRUST ONLINE
©2024 MarketsandMarkets Research Private Ltd. All rights reserved
DMCA.com Protection Status Website Feedback