
Industrial Oils Market by Source (Soybean, Rapeseed, Sunflower, Cottonseed, Corn, Palm), Type (Grade I, Grade II, Grade III), End Use (Biofuel, Paints and Coatings, Cosmetics and Personal Care Products, Pharmaceuticals), Region - Global Forecast to 2025
Market Segmentation
| Report Metrics | Details |
|
Market size available for years |
2019 - 2025 |
|
CAGR % |
5 |
Top 10 companies in Industrial Oils Market
Industrial Oils Market News


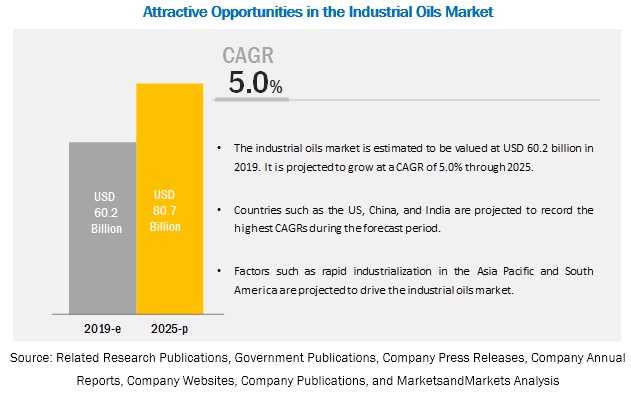
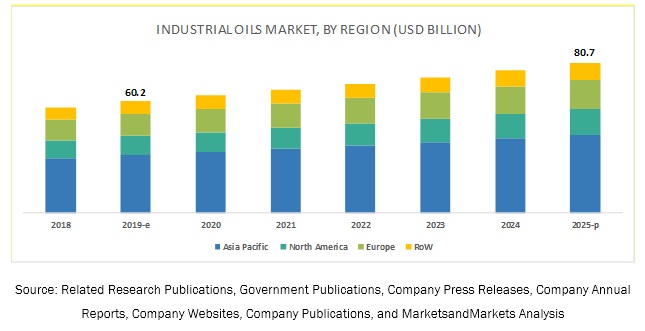
[142 Pages Report] The industrial oils market was estimated to account for a value of USD 60.2 billion in 2019 and is projected to grow at a CAGR of 5.0% from 2019, to reach a value of USD 80.7 billion by 2025. The biodiesel industry is projected to be a major revenue generator for industrial oils manufacturers in the coming years due to its reduced environmental impact. In addition, the industrial sector in the emerging countries of the Asia Pacific region is growing with countries such as China and India, which are the hub of industrial oils, due to the expanding chemical, biodiesel, and cosmetics industries.
The palm segment is projected to dominate the industrial oils market during the forecast period.
The industrial oil market, on the basis of source, is segmented into soybean, corn, sunflower, cottonseed, rapeseed, palm, and others (olive, safflower, copra, groundnut, linseed/flaxseed, and grape seed). The palm segment is estimated to account for the largest share in the global market in 2019. The market in the Asia Pacific region witnesses high growth in Indonesia and Malaysia, which supply over 85% of the global palm oil. This offers growth opportunities to palm oil manufacturers in these countries as they can export as well as utilize for domestic usage in industries such as biofuels.
The grade I (light) segment is projected to dominate the industrial oils market during the forecast period.
The grade I (light) segment is estimated to account for the largest share in the industrial oils market in 2019. The cosmetics & personal care and pharmaceutical industries utilize grade I (light) industrial oil. The cosmetics & personal care industry is witnessing significant growth in countries such as Brazil and China. This is projected to create lucrative opportunities for industrial oil manufacturers in the coming years. In Europe, the cosmetics industry include leading players such as Louis Dreyfus Company (Netherlands), A&A Fratelli Parodi Spa (Italy), Soya Mills SA (Greece), and Henry Lamotte Oils GmbH (Germany), offering industrial oils that find applications in the cosmetics & personal care industry. These include cosmetics & personal care products include shampoos, soaps, and sunscreens. The region is also projected to be a major revenue generator for industrial oil manufacturers in the coming years.
Increasing demand from the biodiesel sector is projected to drive the industrial oils market in the Asia Pacific
Biodiesel is used as an alternative fuel for diesel engines. It attracts the attention of the users due to its renewability, purity, and low exhaust pollution. Biodiesel is produced from a variety of oilseeds. In the European region, rapeseed oil is mainly used for the production of biodiesel, whereas in the US, soybeans are dominant biodiesel feedstock.
Biodiesel has significantly lower emission levels than petroleum-based diesel when it is burned, whether used in its pure form or blended with petroleum diesel. It does not contribute to a net rise in the level of carbon dioxide in the atmosphere and also minimizes the intensity of greenhouse effects. In developing countries, the demand for biodiesel is increasing due to the higher availability of land, favorable climatic conditions for agriculture, and lower labor costs. In addition, in these countries, there is a growing trend of adopting modern technologies and efficient bioenergy conversion using a range of biofuels, which are provided at affordable prices than fossil fuels.
Key Market Players
Key players in global industrial oils market include Cargill (US), Bunge Limited (Netherlands), Wilmar International (Singapore), Louis Dreyfus Company B.V. (Netherlands), Archer Daniels Midland (ADM) (US), Buhler Group (Switzerland), CHS Inc. (US), Ag Processing Inc (US), A&A Fratelli Parodi Spa (Italy), Gemtek Products (US), AAK Kamani (India), and Soya Mills SA (Greece). These companies have undertaken expansions as one of the key strategies to expand their presence in this market.
Scope of the Industrial Oils Market Report
|
Report Metric |
Details |
|
Market size available for years |
2017-2025 |
|
Base year considered |
2018 |
|
Forecast period |
2019-2025 |
|
Forecast units |
Value (USD and Tons) |
|
Segments covered |
Source, Type, End Use, and Region |
|
Geographies covered |
North America, Europe, Asia Pacific, and Rest of the World (RoW) |
|
Companies covered |
Cargill (US), Bunge Limited (Netherlands), Wilmar International (Singapore), Louis Dreyfus Company B.V. (Netherlands), Archer Daniels Midland (ADM) (US), Buhler Group (Switzerland), CHS Inc. (US), Ag Processing Inc (US), A&A Fratelli Parodi Spa (Italy), Gemtek Products (US), AAK Kamani (India), and Soya Mills SA (Greece). |
This research report categorizes the industrial oils market based on source, product, type, and region.
On the basis of source, the market has been segmented as follows:
- Soybean
- Corn
- Sunflower
- Cottonseed
- Rapeseed
- Palm
- Others (Olive, Safflower, Copra, Groundnut, Linseed/Flaxseed, and Grape Seed)
On the basis of type, the market has been segmented as follows
- Grade I (Light)
- Grade II (Medium)
- Grade III (Heavy)
On the basis of end-use, the market has been segmented as follows
- Biofuel
- Paints & coatings
- Cosmetics & personal care
- Pharmaceuticals
- Others (Polymers, thermal, rubbers, agriculture, fillers, adhesives, and chemicals)
On the basis of region, the market has been segmented as follows:
- North America
- Europe
- Asia Pacific
- Rest of World (RoW)
Key questions addressed by the report
- What are the new product areas for industrial oils that the companies are exploring?
- Which are the key players in the industrial oils market and how intense is the competition?
- What kind of competitors and stakeholders would industrial oils companies be interested in? What will be their go-to-market strategy for this market, and which emerging market will be of significant interest?
- How are the current R&D activities and M&A�s in the industrial oils market projected to create a disrupting environment in the coming years?
- What will be the level of impact on the revenues of stakeholders due to the benefits of industrial oils compared to different stakeholders, in terms of, rising revenue, environmental regulatory compliance, and sustainable profits for the suppliers?
Frequently Asked Questions (FAQ):
Can you provide the profiles of companies falling under emerging players category. Is it already covered in the report?
No, It is not covered however we can provide the same subjected to the details available for those companies, following details could be shares
- Business overview
- SWOT analysis
- Product offerings
- Recent developments
- Right to win
I want the customized report for European market. What all countries could be covered.
Following countries could be covered in Europe:
- Spain
- UK
- Germany
- Russia
- France
- Rest of Europe*
*Countries are added during the course if the study
I want to understand the research methodology undertaken to derive the market. How can you assist me with that?
We can surely assist you with the research methodology of the report. Our analyst could call and explain you the complete methodology undertaken. Following pointers will be covered:
- Approaches undertaken
- Data triangulation
- Assumptions
- Limitations
Is Ground nut oil covered in the market scope?
Yes ground nut oil is covered under the other sources segment of the report. The other segment consists of following sources:
- Olive
- Safflower
- Copra
- Groundnut
- Linseed/ flaxseed
- Grapeseed
In case exclusive data for ground nut oil is required, it could be provided as a customization.
To speak to our analyst for a discussion on the above findings, click Speak to Analyst
Table of Contents
1 Introduction (Page No. - 15)
1.1 Objectives of the Study
1.2 Market Definition
1.3 Study Scope
1.4 Periodization Considered
1.5 Currency Considered
1.6 Unit Considered
1.7 Stakeholders
2 Research Methodology (Page No. - 19)
2.1 Research Data
2.1.1 Secondary Data
2.1.2 Primary Data
2.1.2.1 Breakdown of Primary Interviews
2.2 Market Size Estimation
2.3 Data Triangulation
2.4 Research Assumptions & Limitations
2.4.1 Assumptions
2.4.2 Limitations
3 Executive Summary (Page No. - 26)
4 Premium Insights (Page No. - 30)
4.1 Attractive Opportunities in this Market
4.2 Industrial Oils Market, By Region, 2019 Vs. 2025
4.3 Market, By Source, 2019 Vs. 2025
4.4 Market, By Type, 2019 Vs. 2025 (USD Billion)
4.5 Asia Pacific: Industrial Oils Market, By Source and Country, 2018
4.6 Market Share, By End Use, 2019 Vs. 2025
5 Market Overview (Page No. - 34)
5.1 Introduction
5.2 Market Dynamics
5.2.1 Drivers
5.2.1.1 Increasing Demand From the Biodiesel Sector
5.2.1.2 Massive Industrial Growth in Asia Pacific and the Middle East & Africa
5.2.2 Restraints
5.2.2.1 Price Fluctuations of Raw Materials
5.2.2.2 High Capital Investments in Extractions
5.2.3 Opportunities
5.2.3.1 Rising Trends of Bio-Based Industrial Oil Usage
5.2.3.2 Rapid Adoption of Vegetable Oils in Various Industrial Applications
5.2.4 Challenges
5.2.4.1 New Entrants in the Market
5.2.4.2 High Dependence on Oil Imports, Leading to the High Cost of End Products
6 Industry Trends (Page No. - 41)
6.1 Introduction
6.2 Supply Chain Analysis
6.3 Porter�s Five Forces
6.4 Patent Analysis
7 Market for Industrial Oils, By Source (Page No. - 45)
7.1 Introduction
7.2 Soybean
7.2.1 The Usage of Soybean Oil is Increasing in the Paints Industry Due to Volatile Organic Compounds and Lower Raw Material Costs
7.3 Palm
7.3.1 Palm Oil is Replacing Coconut Oil in Various Applications Due to Its Low Production Costs
7.4 Rapeseed
7.4.1 Increasing Demand for High-Oleic Oils is Projected to Drive the Market for Rapeseed
7.5 Sunflower
7.5.1 Sunflower Oil Helps in Protecting the Cardiovascular, Nervous, and Reproductive Systems of the Human Body
7.6 Corn
7.6.1 With 85% Unsaturated Fatty Acids Content, Corn Oil Finds Diverse Applications in the Cosmetics Industry
7.7 Cottonseed
7.7.1 Cottonseed Oil Contains High Concentrations of Vitamin E, Fatty Acids, and Antioxidants, Which are Ideal for Skincare Products
7.8 Others
7.8.1 The Antioxidant Properties of Olive Oil are Projected to Drive Its Demand in the Cosmetics Industry
8 Market for Industrial Oils, By Type (Page No. - 61)
8.1 Introduction
8.2 Grade I (Light)
8.2.1 Booming Cosmetics & Personal Care Industry in the Emerging Asia Pacific Countries
8.3 Grade II (Medium)
8.3.1 Demand From the Biofuels Industry Owing to Environment Concerns
8.4 Grade III (Heavy)
8.4.1 Expansion of the Paints & Coatings Industry in the Emerging Countries
9 Market for Industrial Oils, By End Use (Page No. - 67)
9.1 Introduction
9.2 Biofuel
9.2.1 in North America Region Soybean is Used for the Production of Biofuel
9.3 Paints & Coating
9.3.1 Due to Developments in the Construction and Automobile Sectors in Asia Pacific Region the Markey for Paints & Coating is More
9.4 Cosmetics & Personal Care
9.4.1 Increasing Consumer Demand for Eco-Friendly Personal Care Products has Prompted the Plant Based Industrial Oil
9.5 Pharmaceuticals
9.5.1 US Witnesses an Increasing Presence of Key Players in the Pharmaceutical Industry
9.6 Others
9.6.1 in The Asia Pacific, the Expansion of the Industrial Sector is Projected to Drive the Industrial Oils Market
10 Market for Industrial Oils, By Region (Page No. - 75)
10.1 Introduction
10.2 North America
10.2.1 US
10.2.1.1 Increased Demand for Industrial Oil in the Biofuels Industry
10.2.2 Canada
10.2.2.1 Increased Demand for Cosmetics & Personal Care Products
10.2.3 Mexico
10.2.3.1 Increasing Demand for Meat and Pork Products in the Country
10.3 Europe
10.3.1 Germany
10.3.1.1 Rising Demand for High-Protein Sunflower Meals to Drive the Global Market in Germany
10.3.2 Russia
10.3.2.1 The Country Faces A High Domestic Demand for Industrial Oils Extracted From Sunflower and Cottonseed
10.3.3 Spain
10.3.3.1 High Demand for Biodiesel Fuels to Drive the Demand for Palm Oil in the Country
10.3.4 UK
10.3.4.1 Increasing Demand for Sunflower Oil in the Food Industry to Drive the Growth in the Country
10.3.5 France
10.3.5.1 Growing Demand for Palm Oil in the Food Industry Due to Relatively Affordable Prices and Non-Genetically Engineered Content
10.3.6 Rest of Europe
10.3.6.1 Canola Oils Offered at Affordable Prices are Replacing Other Oils in Australia
10.4 Asia Pacific
10.4.1 China
10.4.1.1 Cost-Effectiveness of Rapeseed Oil Drives Its Demand in China�s Vegetable Oil Industry
10.4.2 India
10.4.2.1 High Demand for Vegetable Oil-Based Products in the Country is Driving the Market for Industrial Oils
10.4.3 Japan
10.4.3.1 The High Cost Associated With Soybean has Led to an Increase in the Consumption of Rapeseed and Palm Oils
10.4.4 Australia & New Zealand
10.4.4.1 Canola Oils Offered at Affordable Prices are Replacing Other Oils in Australia
10.4.5 Rest of Asia Pacific
10.4.5.1 The Favorable Climatic Conditions Support the Production of Palm in Indonesia and Malaysia
10.5 RoW
10.5.1 South America
10.5.1.1 The High Growth in the Biodiesel Industry Also Increases the Sales of Industrial Oils in the South America Region.
10.5.2 Middle East & Africa
10.5.2.1 The Warm and Dry Climatic Conditions of the African Region is Favorable for the Cultivation of Raw Material of Industrial Oils.
11 Competitive Landscape (Page No. - 106)
11.1 Overview
11.2 Competitive Leadership Mapping (Overall Market)
11.2.1 Terminology/Nomenclature
11.2.1.1 Visionary Leaders
11.2.1.2 Innovators
11.2.1.3 Dynamic Differentiators
11.2.1.4 Emerging Companies
11.3 Ranking of Key Players, 2018
11.3.1 New Product Launches
11.3.2 Expansions
11.3.3 Agreements & Joint Ventures
12 Company Profiles (Page No. - 111)
(Business Overview, Products Offered, Recent Developments, SWOT Analysis & MnM View)*
12.1 Cargill
12.2 Bunge Limited
12.3 Wilmar International
12.4 Louis Dreyfus Company
12.5 Archer Daniels Midland
12.6 B�hler Group
12.7 CHS Inc.
12.8 AG Processing Inc
12.9 A&A Fratelli Parodi Spa
12.10 Gemtek Products
12.11 AAK Kamani Private Limited
12.12 Soya Mills S.A.
*Details on Business Overview, Products Offered, Recent Developments, SWOT Analysis & MnM View Might Not Be Captured in Case of Unlisted Companies.
The Companies are Listed in No Particular Order, But as A Representation of the Market�s Ecosystem.
13 Appendix (Page No. - 134)
13.1 Discussion Guide
13.2 Knowledge Store: Marketsandmarkets� Subscription Portal
13.3 Available Customizations
13.4 Related Reports
13.5 Author Details
List of Tables (78 Tables)
Table 1 USD Exchange Rates Considered, 2014�2018
Table 2 Oilseeds Used in the Production of Biodiesel
Table 3 Annual GDP and Industrial Production Growth Rates of Countries in Asia Pacific, 2016
Table 4 List of Patent
Table 5 Industrial Oils Market Size, By Source, 2017�2025 (Mmt)
Table 6 Market Size, By Source, 2017�2025 (USD Billion)
Table 7 Soybean: Market Size for Industrial Oils, By Region, 2017�2025 (Mmt)
Table 8 Soybean: By Market Size, By Region, 2017�2025 (USD Billion)
Table 9 Palm: Market Size for Industrial Oils, By Region, 2017�2025 (Mmt)
Table 10 Palm: By Market Size, By Region, 2017�2025 (USD Million)
Table 11 Rapeseed: Market Size for Industrial Oils, By Region, 2017�2025 (Kt)
Table 12 Rapeseed: By Market Size, By Region, 2017�2025 (USD Million)
Table 13 Sunflower: Market Size for Industrial Oils, By Region, 2017�2025 (Mmt)
Table 14 Sunflower: Market Size for Industrial Oils, By Region, 2017�2025 (USD Million)
Table 15 Corn: Industrial Oils Market Size, By Region, 2017�2025 (Kt)
Table 16 Corn: Market Size, By Region, 2017�2025 (USD Million)
Table 17 Cottonseed: Market Size for Industrial Oils, By Region, 2017�2025 (Kt)
Table 18 Cottonseed: Market Size, By Region, 2017�2025 (USD Million)
Table 19 Functionality and Chemical Composition of Peanut By-Products
Table 20 Others: Market Size for Industrial Oils, By Region, 2017�2025 (Kt)
Table 21 Others: Market Size, By Region, 2017�2025 (USD Million)
Table 22 Market Size for Industrial Oils, By Type, 2017�2025 (USD Billion)
Table 23 Market Size, By Type, 2017�2025 (Mmt)
Table 24 Grade I (Light): Market Size for Industrial Oils, By Region, 2017�2025 (Mmt)
Table 25 Grade I (Light): By Market Size, By Region, 2017�2025 (USD Billion)
Table 26 Grade II (Medium): Market Size for Industrial Oils, By Region, 2017�2025 (Mmt)
Table 27 Grade II (Medium): Market Size, By Region, 2017�2025 (USD Billion)
Table 28 Grade III (Heavy): Market Size for Industrial Oils, By Region, 2017�2025 (Mmt)
Table 29 Grade III (Heavy): Market Size, By Region, 2017�2025 (USD Billion)
Table 30 Industrial Oils Market Size, By End Use, 2017�2025 (USD Billion)
Table 31 Market Size, By End Use, 2017�2025 (Mmt)
Table 32 Biofuel: Market Size for Industrial Oils, By Region, 2017�2025 (USD Billion)
Table 33 Biofuel: Market Size, By Region, 2017�2025 (Mmt)
Table 34 Paints & Coatings: Market Size for Industrial Oils, By Region, 2017�2025 (USD Million)
Table 35 Paints & Coating: Market Size, By Region, 2017�2025 (Mmt)
Table 36 Cosmetics & Personal Care: Market Size for Industrial Oils, By Region, 2017�2025 (USD Billion)
Table 37 Cosmetics & Personal Care: Market Size, By Region, 2017�2025 (Mmt)
Table 38 Pharmaceuticals: Market Size for Industrial Oils, By Region, 2017�2025 (USD Million)
Table 39 Pharmaceuticals: Market Size, By Region, 2017�2025 (Kt)
Table 40 Others: Market Size for Industrial Oils, By Region, 2017�2025 (USD Billion)
Table 41 Others: Market Size, By Region, 2017�2025 (Mmt)
Table 42 Industrial Oils Market Size, By Region, 2017�2025 (Mmt)
Table 43 Market Size, By Region, 2017�2025 (USD Billion)
Table 44 North America: Market Size for Industrial Oils, By Country, 2017�2025 (Mmt)
Table 45 North America: Market Size, By Country, 2017�2025 (USD Billion)
Table 46 North America: Market Size, By Source, 2017�2025 (Kt)
Table 47 North America: Market Size, By Source, 2017�2025 (USD Million)
Table 48 North America: Market Size, By Type, 2017�2025 (Mmt)
Table 49 North America: Market Size, By Type, 2017�2025 (USD Billion)
Table 50 North America: Market Size, By End Use, 2017�2025 (Mmt)
Table 51 North America: Market Size for Industrial Oils, By End Use, 2017�2025 (USD Million)
Table 52 Europe: Industrial Oils Market Size, By Region, 2017�2025 (Mmt)
Table 53 Europe: Market Size, By Region, 2017�2025 (USD Million)
Table 54 Europe: Market Size, By Source, 2017�2025 (Kt)
Table 55 Europe: Market Size, By Source, 2017�2025 (USD Million)
Table 56 Europe: Market Size, By Type, 2017�2025 (Mmt)
Table 57 Europe: Market Size for Industrial Oils, By Type, 2017�2025 (USD Million)
Table 58 Europe: Market Size, By End Use, 2017�2025 (Mmt)
Table 59 Europe: Market Size, By End Use, 2017�2025 (USD Billion)
Table 60 Asia Pacific: Industrial Oils Market Size, By Region, 2017�2025 (Mmt)
Table 61 Asia Pacific: Market Size, By Region, 2017�2025 (USD Billion)
Table 62 Asia Pacific: Market Size for Industrial Oils, By Source, 2017�2025 (Mmt)
Table 63 Asia Pacific: Market Size, By Source, 2017�2025 (USD Million)
Table 64 Asia Pacific: Market Size, By Type, 2017�2025 (Mmt)
Table 65 Asia Pacific: Market Size, By Type, 2017�2025 (USD Billion)
Table 66 Asia Pacific: Market Size for Industrial Oils, By End Use, 2017�2025 (Mmt)
Table 67 Asia Pacific: Market Size, By End Use, 2017�2025 (USD Billion)
Table 68 RoW: Industrial Oils Market Size, By Country, 2017�2025 (Mmt)
Table 69 RoW: By Market Size, By Country, 2017�2025 (USD Billion)
Table 70 RoW: Market Size for Industrial Oils, By Source, 2017�2025 (Kt)
Table 71 RoW: Market Size, By Source, 2017�2025 (USD Million)
Table 72 RoW: Market Size, By End Use, 2017�2025 (Kt)
Table 73 RoW: Market Size, By End Use, 2017�2025 (USD Million)
Table 74 RoW: Market Size for Industrial Oils, By Type, 2017�2025 (Mmt)
Table 75 RoW: Market Size, By Type, 2017�2025 (USD Million)
Table 76 New Product Launches, 2016
Table 77 Expansions, 2015 - 2018
Table 78 Agreements & Joint Ventures, 2016 - 2017
List of Figures (59 Figures)
Figure 1 Market Segmentation
Figure 2 Regional Segmentation
Figure 3 Industrial Oils Market: Research Design
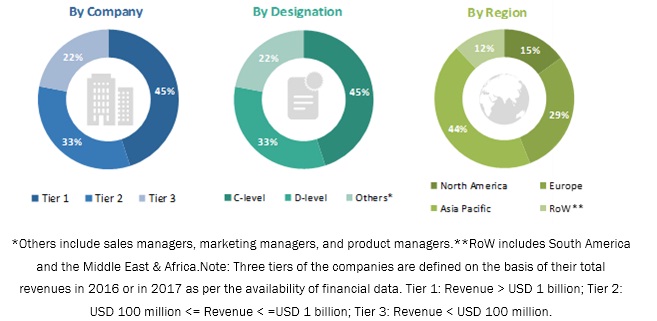
Figure 4 Breakdown of Primary Interviews: By Company Type, Designation, and Region
Figure 5 Market Size Estimation Methodology: Bottom-Up Approach
Figure 6 Market Size Estimation Methodology: Top-Down Approach
Figure 7 Research Methodology Steps
Figure 8 Data Triangulation Methodology
Figure 9 Increasing Production of Palm Oil for Various Industrial Applications to Drive the Market
Figure 10 Grade I (Light) Industrial Oils Used in the Cosmetics and Pharmaceutical Applications to Account for the Dominant Share
Figure 11 Growing Demand From the Biofuel Industry to Drive the Market for Industrial Oils
Figure 12 North America to Be the Fastest-Growing Region in the Industrial Oils Market During the Forecast Period
Figure 13 Industrial Oils: an Emerging Market With Promising Growth Potential
Figure 14 Asia Pacific to Dominate the Global Market From 2019 to 2025
Figure 15 The Palm Segment is Projected to Hold the Largest Share in the Market From 2019 to 2025
Figure 16 The Grade I (Light) Segment is Projected to Hold A Larger Share in this Market Throughout 2025
Figure 17 The Palm Segment, By Source, Accounted for the Largest Share of the Asia Pacific Industrial Oils Market
Figure 18 The Biofuel Segment Estimated to Dominate the Market in 2019
Figure 19 US, China, and India Projected to Grow at Higher CAGRs Duringthe Forecast Period (By Value)
Figure 20 Industrial Oils Market: Drivers, Restraints, Opportunities, and Challenges
Figure 21 US Market Share of Commercial Vehicle Registrations, 2016�2020
Figure 22 Us Biodiesel Production, 2017 Vs. 2018 (Million Gallon)
Figure 23 Oilseed Prices, 2007�2017 (USD)
Figure 24 The Processing Phase Plays A Vital Role in the Supply Chain
Figure 25 Porter�s Five Forces: Market Fragmentation and Launch of Several New Products Intensifying Industrial Rivalry
Figure 26 Industrial Oils Market, By Source, 2019 Vs. 2025 (Mmt)
Figure 27 Market, By Source, 2019 Vs. 2025 (USD Billion)
Figure 28 Major Soybean Oil Production Countries in 2018
Figure 29 Major Palm Oil Production Countries in 2018
Figure 30 Major Rapeseed Oil Production Countries in 2018
Figure 31 Major Sunflower Oil Exporting Countries in 2018
Figure 32 Major Sunflower Oil Importing Countries in 2018
Figure 33 Major Copra Producing Countries, 2018
Figure 34 Grade I (Light) Segment Dominated the Market From 2019 to 2025 (USD Billion)
Figure 35 Market Size for Industrial Oils, By End Use, 2019�2025 (USD Billion)
Figure 36 China Held the Largest Market Share in the Market During the Forecast Period
Figure 37 North America: Industrial Oils Snapshot
Figure 38 Europe: Industrial Oils Market Snapshot, 2018
Figure 39 Asia Pacific: Industrial Oils Market Snapshot, 2018
Figure 40 Vegetable Oils Consumption in China, 2018
Figure 41 Vegetable Oils Consumption in India, 2018
Figure 42 Australian Export of Canola, 2013�2017 (Thousand Metric Ton)
Figure 43 Vegetable Oil Consumption in China, 2018
Figure 44 Key Developments of the Leading Players in the Industrial Oils Market, 2014�2018
Figure 45 Global Industrial Oils Market Competitive Leadership Mapping, 2018
Figure 46 Cargill Led the Industrial Oils Market In, 2018
Figure 47 Cargill: Company Snapshot
Figure 48 Cargill: SWOT Analysis
Figure 49 Bunge Limited: Company Snapshot
Figure 50 Bunge Limited: SWOT Analysis
Figure 51 Wilmar International: Company Snapshot
Figure 52 Wilmar International: SWOT Analysis
Figure 53 Louis Dreyfus Company: Company Snapshot
Figure 54 Louis Dreyfus Company: SWOT Analysis
Figure 55 Archer Daniels Midland: Company Snapshot
Figure 56 Archer Daniels Midland: SWOT Analysis
Figure 57 B�hler Group: Company Snapshot
Figure 58 CHS Inc: Company Snapshot
Figure 59 AG Processing Inc: Company Snapshot
The study involves four major activities to estimate the current market size for industrial oils. Exhaustive secondary research was conducted to collect information on the market, peer market, and parent market. These findings, assumptions, and market size were validated with industry experts across the value chain through primary research. Both top-down and bottom-up approaches were employed to estimate the complete market size. Thereafter, the market breakdown and data triangulation were used to estimate the market size of segments and subsegments.
Secondary Research
In the secondary research process, various secondary sources such as Hoovers, Bloomberg BusinessWeek, and Dun & Bradstreet were referred to, in order to identify and collect information for this study. These secondary sources included annual reports, press releases & investor presentations of companies, white papers, certified publications, articles by recognized authors, gold standard & silver standard websites, food safety organizations, regulatory bodies, trade directories, and databases.
Primary Research
The industrial oils market comprises several stakeholders, such as industrial manufacturers and suppliers, government & research organizations, associations, and industry bodies. The demand-side of this market is characterized by the rising demand for sustainable sources. The supply-side is characterized by advancements in technology and diverse application industries. Various primary sources from both the supply and demand sides of the market were interviewed to obtain qualitative and quantitative information.
Following is the breakdown of primary respondents
To know about the assumptions considered for the study, download the pdf brochure
Market Size Estimation
Both top-down and bottom-up approaches were used to estimate and validate the total size of the industrial oils market. These methods were also used extensively to estimate the size of various subsegments in the market. The research methodology used to estimate the market size includes the following:
The key players in the industry and markets were identified through extensive secondary research.
- The industry�s supply chain and market size, in terms of value and volume, were determined through primary and secondary research processes.
- All percentage shares, splits, and breakdowns were determined using secondary sources and verified through primary respondents
Data Triangulation
After arriving at the overall market size-using the market size estimation processes as explained above�the market was split into several segments and subsegments. In order to complete the overall market engineering process and arrive at the exact statistics of each market segment and subsegment, the data triangulation and market breakdown procedures were employed. The data was triangulated by studying various factors and trends from both the demand and supply sides in the industrial oils industry.
Report Objectives
- To define, segment, and project the global market size for industrial oils market
- To understand the structure of the industrial oils market by identifying its various subsegments
- To provide detailed information about the key factors influencing the growth of the market (drivers, restraints, opportunities, and industry-specific challenges)
- To analyze the micromarkets with respect to individual growth trends, future prospects, and their contribution to the total industrial oils market
- To project the size of the market and its submarkets, in terms of value and volume, with respect to the regions (along with their respective key countries)
- To profile key players and comprehensively analyze their core competencies
- To understand the competitive landscape and identify major growth strategies adopted by players across key regions
- To analyze the competitive developments such as expansions & investments, mergers & acquisitions, new product launches, partnerships, joint ventures, and agreements
Available Customizations
Based on the given market data, MarketsandMarkets offers customizations in the reports as per the client�s specific requirements. The available customization options are as follows:
Regional Analysis
- Further breakdown of the Rest of Asia Pacific industrial oils market, by country
- Further breakdown of other Rest of Europe industrial oils market, by country
- Further breakdown of other Rest of the World industrial oils market, by country
Company Information
- Detailed analysis and profiling of additional market players (up to five)


Growth opportunities and latent adjacency in Industrial Oils Market