Sourdough Market

Sourdough Market by Type (Type I, Type II and Type III), Application (Bread & Buns, Cookies, Cakes, Pizza), Ingredients (Wheat, Barley, and Oats), and Region (North America, Europe, APAC, South America, RoW) - Global Forecast to 2028

Report Code: FB 8726 Jul, 2023, by marketsandmarkets.com

Sourdough Market Size & Trends Overview

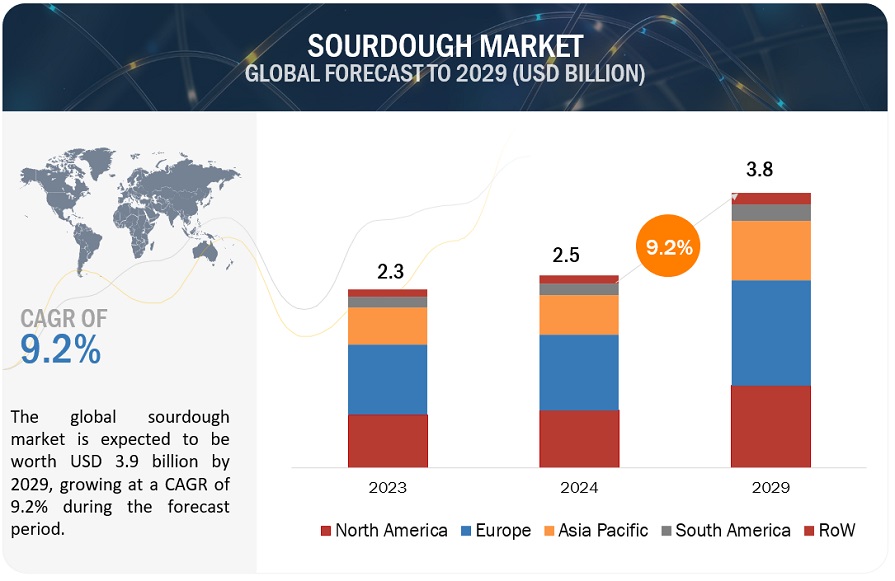
The sourdough market size is predicted to grow at a CAGR of 9.0% between 2023 and 2028, reaching a value of $3.5 billion by 2028 from a projection of $2.3 billion in 2023.

The significant shift in consumer preferences towards healthier and natural food options and sourdough bread aligns perfectly with this trend. The market is driven by the expanding product offerings by manufacturers who are introducing a wide range of sourdough-based products like baguettes, rolls, and even pastries. The increasing availability of artisanal and premium baked goods in supermarkets and specialty stores also contributes to market growth.

The expanding business has offered lucrative business opportunities to the players who are operating in the market segments. For instance, in January 2021,  Puratos acquired Ruskhleb, a baking ingredient company based in Saint Petersburg (Russia), to expand its range of local sourdoughs in Russia and enable more Russian bakers to capitalize on the growing market demand for sourdough bread. Puratos planned to strengthen its local bakery leadership position with this acquisition and localize sourdough manufacturing utilizing regional ingredients. Other key players like Ernst Böcker GmbH & Co. KG. launched new products offering a versatile solution for global baking needs. The overall market is classified as a competitive market, with the top 5 key players, namely Puratos (Belgium), IREKS GMBH (Germany), Lallemand Inc. (Canada), Lesaffre (France), Goodmills (Austria), occupying 25-50% of the market share.
Sourdough Market Overview

To know about the assumptions considered for the study, Request for Free Sample Report

Sourdough Market Growth Insights

Driver: Increasing Consumer Demand for Healthier and Natural Options

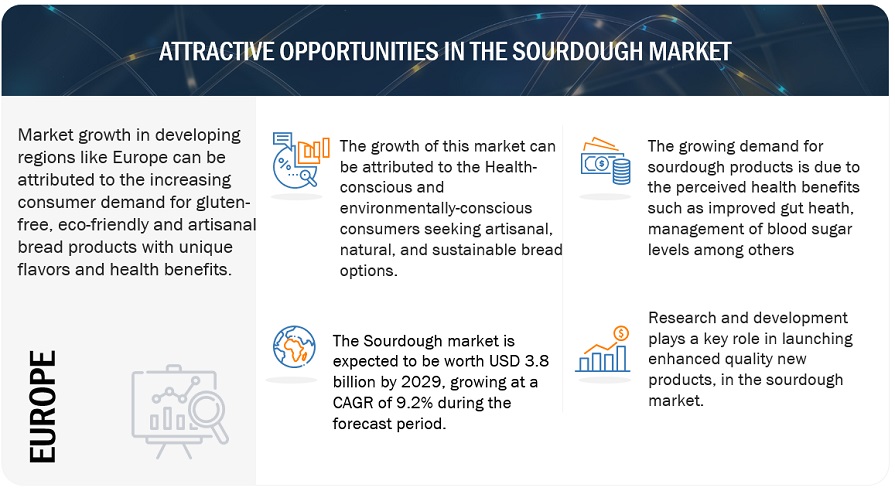
Sourdough bread aligns with this trend as it is perceived as a healthier alternative to traditional bread due to its natural fermentation process and potential digestive benefits. The rising consumer awareness about the advantages of sourdough, such as improved digestion and potentially lower glycemic index, further drives its popularity. Additionally, the growing availability of artisanal and premium sourdough products in supermarkets and specialty stores boosts market growth.

Restraint: Longer Production Time and Potential Higher Costs

The sourdough market is a longer production process compared to conventional bread. The fermentation process for sourdough can take several hours or even days, which may pose challenges for large-scale production and distribution. Moreover, sourdough requires specialized knowledge and skills, making it difficult for some manufacturers to maintain consistent quality. Another restraint is the potentially higher cost associated with sourdough due to its premium positioning and the use of quality ingredients.

Opportunity: Growing Trend of Artisanal and Premium Baked Goods

By introducing new flavors, variants, and formats of sourdough bread, as well as expanding into other sourdough-based products like pastries and snacks. Moreover, with increasing consumer interest in sustainability and locally sourced products, there is an opportunity to highlight the regional and cultural aspects of sourdough, promoting traditional baking techniques and local ingredients. Additionally, the online retail channel provides an avenue for reaching a wider consumer base and expanding sourdough market presence.
Sourdough Market Attractive Opportunities

To know about the assumptions considered for the study, download the pdf brochure

Challenge: Competition from Alternative Bread Options and Cheaper Production Methods

As gluten-free diets gain popularity, consumers may opt for gluten-free bread options, which could affect the demand for sourdough. Additionally, the traditional bread market remains a strong competitor, as it still holds a significant market share. Regulatory challenges and food safety standards could pose threats to sourdough manufacturers, especially when it comes to maintaining consistency and quality in large-scale production.

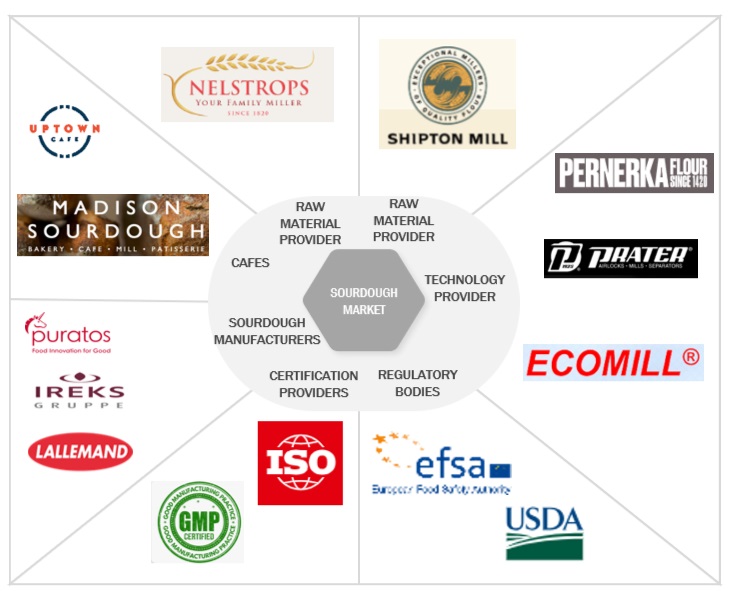
Sourdough Market Ecosystem
Sourdough Market Ecosystem

Sourdough Market by Type Insights

Based on Type, Type II is anticipated to grow at a significant CAGR in the market.

Type II market is expected to witness significant growth in the market due to the increasing demand for sourdough with added ingredients, or variations drives the growth of Type II sourdough. It offers a wider range of flavors and taste experiences compared to basic Type I sourdough, satisfying consumers' desire for diversity and indulgence. Moreover, Type II sourdough allows for product differentiation and innovation, enabling bakers and manufacturers to create unique and specialized sourdough products tailored to specific consumer preferences. The trend towards premium and artisanal bakery products further supports the demand for Type II sourdough as consumers seek high-quality and unique offerings. Overall, the growth of Type II sourdough is fueled by its ability to cater to consumer preferences for variety, customization, and premium bakery experiences.

Sourdough Market by Ingredients Insights

The Oats segment is projected to grow at the highest rate during the forecast period.

Increasing consumer awareness of the health benefits of oats, such as high fiber content and gluten-free properties, is driving the demand for oat-based products. The shift towards healthier dietary preferences, including vegan and plant-based diets, is also contributing to the popularity of oats. Manufacturers are innovating and introducing a variety of oat-based products to cater to evolving consumer preferences. The sustainability aspect of oats, with lower water and land requirements, aligns with the growing focus on environmentally friendly food choices. These factors collectively propel the growth of the oats segment and make it a lucrative market opportunity.

Sourdough Market by Application Insights

Based on Application, the Cakes segment is projected to occupy a significant sourdough market share rate during the forecast period.

Sourdough cakes provide a healthier alternative to traditional cakes, appealing to health-conscious consumers. The unique tangy flavor and moist texture offered by sourdough enhance the taste experience, attracting consumers seeking new and distinct flavors. The association of sourdough cakes with artisanal and gourmet offerings adds to their appeal, as consumers increasingly value high-quality, handcrafted products. The growing variety of sourdough-based cakes from manufacturers provides consumers with more choices, driving market share. Increasing consumer awareness about the health benefits and unique characteristics of sourdough contributes to the demand for sourdough cakes.

Sourdough Market by Regional Insights
Sourdough Market by Region

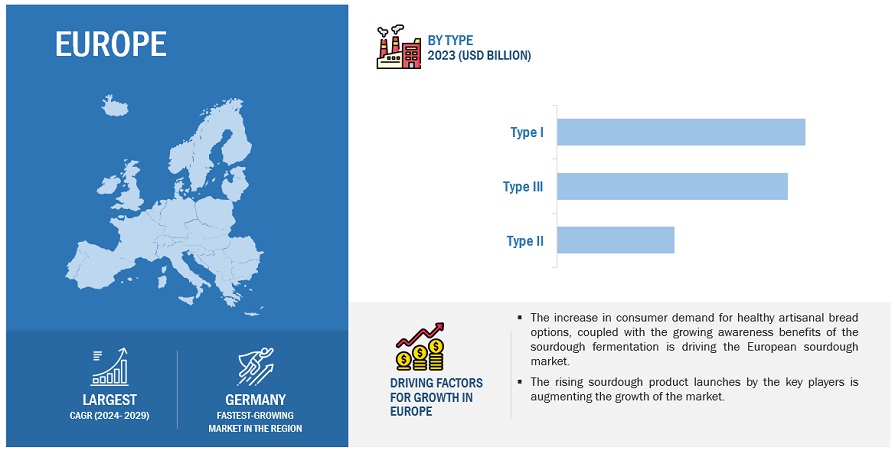
Europe holds the highest market share during the forecast period.

Europe accounted for the largest market share in the food & beverage metal cans market in 2022. Europe holds the highest market share during the forecast period in the sourdough market due to several key factors. Europe has a deep-rooted tradition and cultural connection to bread, making it an integral part of European diets. The region's familiarity and preference for bread contribute to the higher market share of sourdough in Europe. Europe values artisanal and traditional food products, aligning with the characteristics of sourdough. The demand for sourdough is driven by European consumers' appreciation for authenticity, high-quality ingredients, and unique flavors. Europe's advanced bakery industry, encompassing artisanal bakeries and commercial manufacturers, ensures the widespread availability and accessibility of sourdough products. The combination of cultural heritage, preference for artisanal foods, and a well-developed bakery industry establish Europe's dominant market share in the market.

Key Players in the Sourdough Industry

Key players in this market include Puratos (Belgium), IREKS GMBH (Germany), Lallemand Inc. (Canada), Lesaffre (France),  BOUDIN BAKERY (US), Goodmills (Austria), and Bake With Brolite (US).

Sourdough Market Report Scope

Report Metric

Details

Market Valuation in 2023

US $2.3 Billion

Revenue Forecast in 2028

US $3.5 Billion

Progress Rate

CAGR of 9.0%

Companies studied

  • Puratos (Belgium)
  • IREKS GMBH (Germany)
  • Lallemand Inc. (Canada)
  • Lesaffre (France)
  • Goodmills (Austria)
  • GOLD COAST BAKING COMPANY (US)
  • BOUDIN BAKERY (US)
  • Philibert Savours (France)
  • Ernst BÖCKER GmbH & Co. KG (Germany)
  • Bake With Brolite (US)

Market Drivers

  • Rising health awareness among consumers
  • Popularity of authentic and artisanal food trends
  • Increasing demand for gluten-free products

Market Opportunities

  • Demand for innovation and product diversification
  • Culinary exploration and changing taste preferences

Sourdough Market Segmentation:

Segment

Subsegment

Market By Type

  • Type I
  • Type II
  • Type III

Market By Application

  • Breads & Buns
  • Cookies
  • Cakes
  • Pizza
  • Others

Market By Ingredients

  • Wheat
  • Barley
  • Oats

Sourdough Market By Region

  • North America
  • Europe
  • Asia Pacific
  • South America
  • RoW

Recent Developments in Sourdough Market

  • In January 2021,  Puratos acquired Ruskhleb, a baking ingredient company based in Saint Petersburg (Russia), to expand its range of local sourdoughs in Russia and enable more Russian bakers to capitalize on the growing market demand for sourdough bread. Puratos planned to strengthen its local bakery leadership position with this acquisition and localize sourdough manufacturing utilizing regional ingredients.
  • In November 2022, Ernst Böcker GmbH & Co. KG. (Germany)  launched BÖCKER Mondial Vario sourdough starter, which offers a versatile solution for global baking needs. With a shelf life of three months and adaptable to various climates and raw materials, it guarantees consistent, high-quality results. Its mild flavor is perfect for wheat and mixed wheat pastries, including fine baked goods, and organic and gluten-free options.
  • In November 2022, Ernst Böcker GmbH & Co. KG. (Germany), the sourdough specialist, introduced ActiVivo, a range of active, liquid sourdoughs, ensuring reliable processes and high-quality baked goods.

Frequently Asked Questions (FAQ):

To speak to our analyst for a discussion on the above findings, click Speak to Analyst

TABLE OF CONTENTS
 
1 INTRODUCTION OF SOURDOUGH MARKET(Page No. - 29)
    1.1 STUDY OBJECTIVES 
    1.2 MARKET DEFINITION 
    1.3 STUDY SCOPE 
           1.3.1 MARKET SEGMENTATION
           1.3.2 REGIONS COVERED
           1.3.3 INCLUSIONS & EXCLUSIONS
    1.4 YEARS CONSIDERED 
    1.5 CURRENCY CONSIDERED 
           TABLE 1 USD EXCHANGE RATES, 2019–2022
    1.6 UNITS CONSIDERED 
    1.7 STAKEHOLDERS 
    1.8 SUMMARY OF CHANGES 
           1.8.1 RECESSION IMPACT
 
2 RESEARCH METHODOLOGY (Page No. - 34)
    2.1 RESEARCH DATA 
           FIGURE 1 RESEARCH DESIGN
           2.1.1 SECONDARY DATA
                    2.1.1.1 Key data from secondary sources
           2.1.2 PRIMARY DATA
                    2.1.2.1 Key data from primary sources
                    2.1.2.2 Key industry insights
                    2.1.2.3 Breakdown of primary interviews
                               FIGURE 2 BREAKDOWN OF PRIMARY INTERVIEWS: BY VALUE CHAIN, DESIGNATION, AND REGION
    2.2 FACTOR ANALYSIS 
           2.2.1 INTRODUCTION: SOURDOUGH MARKET
           2.2.2 DEMAND-SIDE ANALYSIS
                    FIGURE 3 KEY ECONOMIES BASED ON GROSS DOMESTIC PRODUCT,  2019–2021 (USD TRILLION)
           2.2.3 SUPPLY-SIDE ANALYSIS
    2.3 MARKET SIZE ESTIMATION 
           2.3.1 APPROACH ONE (BASED ON APPLICATION, BY REGION)
           2.3.2 APPROACH TWO (BASED ON GLOBAL MARKET)
    2.4 DATA TRIANGULATION 
           FIGURE 4 DATA TRIANGULATION AND MARKET BREAKDOWN
    2.5 RESEARCH ASSUMPTIONS 
    2.6 LIMITATIONS AND RISK ASSESSMENT 
    2.7 RECESSION IMPACT ANALYSIS 
           2.7.1 RECESSION MACROINDICATORS
                    FIGURE 5 RECESSION MACROINDICATORS
                    FIGURE 6 GLOBAL INFLATION RATE, 2011–2021
                    FIGURE 7 GLOBAL GROSS DOMESTIC PRODUCT, 2011–2021 (USD TRILLION)
                    FIGURE 8 RECESSION INDICATORS AND THEIR IMPACT ON MARKET
                    FIGURE 9 GLOBAL MARKET: CURRENT FORECAST VS. RECESSION FORECAST
 
3 EXECUTIVE SUMMARY (Page No. - 48)
    TABLE 2 MARKET SNAPSHOT, 2023 VS. 2028 
    FIGURE 10 MARKET, BY TYPE, 2023 VS. 2028 (USD MILLION) 
    FIGURE 11 MARKET, BY INGREDIENT, 2023 VS. 2028 (USD MILLION) 
    FIGURE 12 MARKET, BY APPLICATION, 2023 VS. 2028 (USD MILLION) 
    FIGURE 13 MARKET SHARE AND GROWTH RATE, BY REGION 
 
4 PREMIUM INSIGHTS (Page No. - 54)
    4.1 ATTRACTIVE OPPORTUNITIES FOR PLAYERS IN MARKET 
           FIGURE 14 POPULARITY OF ARTISANAL BAKING TRENDS AND RISING HEALTH AWARENESS AMONG CONSUMERS TO DRIVE GROWTH
    4.2 MARKET: SHARE OF MAJOR REGIONAL SUBMARKETS 
           FIGURE 15 CHINA TO ACHIEVE FASTEST GROWTH DURING FORECAST PERIOD
    4.3 EUROPE: MARKET, BY TYPE AND KEY COUNTRY 
           FIGURE 16 TYPE I SEGMENT AND GERMANY TO ACCOUNT FOR SIGNIFICANT SHARE IN 2023
    4.4 SOURDOUGH MARKET, BY APPLICATION AND REGION 
           FIGURE 17 BREAD & BUNS SEGMENT AND EUROPE TO ACCOUNT FOR SIGNIFICANT SHARE BY 2028
    4.5 MARKET, BY TYPE 
           FIGURE 18 TYPE I SEGMENT TO LEAD MARKET DURING FORECAST PERIOD
    4.6 MARKET, BY APPLICATION 
           FIGURE 19 BREAD & BUNS SEGMENT TO ACCOUNT FOR LARGEST SHARE BY 2028
    4.7 MARKET, BY INGREDIENT 
           FIGURE 20 WHEAT SEGMENT TO LEAD MARKET BY 2028
 
5 MARKET OVERVIEW (Page No. - 59)
    5.1 INTRODUCTION 
           FIGURE 21 REVENUE SHARE OF US BAKERY PRODUCTS, 2021
    5.2 MARKET DYNAMICS 
           FIGURE 22 MARKET: DRIVERS, RESTRAINTS, OPPORTUNITIES, AND CHALLENGES
           5.2.1 DRIVERS
                    5.2.1.1 Rising health awareness among consumers
                    5.2.1.2 Popularity of authentic and artisanal food trends
                    5.2.1.3 Increasing demand for gluten-free products
           5.2.2 RESTRAINTS
                    5.2.2.1 Limited shelf life and product inconsistency
           5.2.3 OPPORTUNITIES
                    5.2.3.1 Demand for innovation and product diversification
                    5.2.3.2 Culinary exploration and changing taste preferences
           5.2.4 CHALLENGES
                    5.2.4.1 Rising price sensitivity and market penetration
                    5.2.4.2 Intricate and time-consuming sourdough fermentation
 
6 SOURDOUGH MARKET TRENDS (Page No. - 65)
    6.1 INTRODUCTION 
    6.2 VALUE CHAIN ANALYSIS 
           FIGURE 23 VALUE CHAIN ANALYSIS
           6.2.1 RESEARCH AND PRODUCT DEVELOPMENT
           6.2.2 RAW MATERIAL SOURCING
           6.2.3 PRODUCTION AND PROCESSING
           6.2.4 BAKING
           6.2.5 PACKAGING
           6.2.6 MARKETING AND SALES
    6.3 TRENDS/DISRUPTIONS IMPACTING CUSTOMERS’ BUSINESSES 
           FIGURE 24 REVENUE SHIFT ANALYSIS
    6.4 TARIFF AND REGULATORY LANDSCAPE 
           TABLE 3 NORTH AMERICA: LIST OF REGULATORY BODIES, GOVERNMENT AGENCIES, AND OTHER ORGANIZATIONS
           TABLE 4 EUROPE: LIST OF REGULATORY BODIES, GOVERNMENT AGENCIES, AND OTHER ORGANIZATIONS
           TABLE 5 ASIA PACIFIC: LIST OF REGULATORY BODIES, GOVERNMENT AGENCIES,  AND OTHER ORGANIZATIONS
           TABLE 6 SOUTH AMERICA: LIST OF REGULATORY BODIES, GOVERNMENT AGENCIES, AND OTHER ORGANIZATIONS
           TABLE 7 ROW: LIST OF REGULATORY BODIES, GOVERNMENT AGENCIES, AND OTHER ORGANIZATIONS
    6.5 REGULATORY FRAMEWORK 
    6.6 NORTH AMERICA : SOURDOUGH MARKET
           6.6.1 US
                    6.6.1.1 Food and Drug Administration (FDA)
                    6.6.1.2 United States Department of Agriculture (USDA)
                    6.6.1.3 State and Local Health Departments
                    6.6.1.4 Occupational Safety and Health Administration (OSHA)
           6.6.2 CANADA
           6.6.3 MEXICO
    6.7 EUROPEAN UNION (EU) 
           6.7.1 GERMANY
           6.7.2 FRANCE
           6.7.3 UK
           6.7.4 ITALY
           6.7.5 SPAIN
    6.8 ASIA PACIFIC 
           6.8.1 CHINA
           6.8.2 INDIA
           6.8.3 JAPAN
           6.8.4 AUSTRALIA & NEW ZEALAND
    6.9 SOUTH AMERICA 
           6.9.1 BRAZIL
           6.9.2 ARGENTINA
    6.10 PATENT ANALYSIS 
           FIGURE 25 PATENTS GRANTED GLOBALLY, 2013–2022
           FIGURE 26 MAJOR PATENTS GRANTED, BY REGION
           TABLE 8 LIST OF MAJOR PATENTS PERTAINING TO SOURDOUGH MARKET, 2013–2022
    6.11 TRADE ANALYSIS 
                    TABLE 9 IMPORT VALUE OF SOURDOUGH FOR KEY COUNTRIES, 2022 (USD THOUSAND)
                    TABLE 10 EXPORT VALUE OF SOURDOUGH FOR KEY COUNTRIES, 2022 (USD THOUSAND)
    6.12 PRICING ANALYSIS 
           6.12.1 AVERAGE SELLING PRICE TRENDS
                    TABLE 11 WHEAT: MARKET, BY REGION, 2020–2022 (USD PER TON)
                    TABLE 12 BARLEY: MARKET, BY REGION, 2020–2022 (KILOTON)
                    TABLE 13 OATS: MARKET, BY REGION, 2020–2022 (KILOTON)
    6.13 ECOSYSTEM ANALYSIS 
           6.13.1 DEMAND SIDE
           6.13.2 SUPPLY SIDE
                    FIGURE 27 ECOSYSTEM MAP
                    TABLE 14 ROLE OF PLAYERS IN MARKET ECOSYSTEM
    6.14 TECHNOLOGY ANALYSIS: MARKET
           6.14.1 3D BREAD QUALITY X-RAYS
           6.14.2 DIGITAL HUMIDITY SENSORS
    6.15 PORTER’S FIVE FORCES ANALYSIS 
                    TABLE 15 PORTER’S FIVE FORCES ANALYSIS
           6.15.1 INTENSITY OF COMPETITIVE RIVALRY
           6.15.2 BARGAINING POWER OF SUPPLIERS
           6.15.3 BARGAINING POWER OF BUYERS
           6.15.4 THREAT OF SUBSTITUTES
           6.15.5 THREAT OF NEW ENTRANTS
    6.16 KEY STAKEHOLDERS AND BUYING CRITERIA 
           6.16.1 KEY STAKEHOLDERS IN BUYING PROCESS
                    FIGURE 28 INFLUENCE OF STAKEHOLDERS ON BUYING PROCESS FOR KEY APPLICATIONS
                    TABLE 16 INFLUENCE OF STAKEHOLDERS ON BUYING PROCESS FOR APPLICATIONS
           6.16.2 KEY CRITERIA FOR SELECTING SUPPLIERS/VENDORS
                    TABLE 17 KEY CRITERIA FOR SELECTING SUPPLIERS/VENDORS
                    FIGURE 29 KEY CRITERIA FOR SELECTING SUPPLIERS/VENDORS
    6.17 KEY CONFERENCES & EVENTS, 2023–2024 
                    TABLE 18 KEY CONFERENCES & EVENTS, 2023–2024
 
7 SOURDOUGH MARKET, BY INGREDIENT (Page No. - 93)
    7.1 INTRODUCTION 
           FIGURE 30 MARKET, BY INGREDIENT, 2023 VS. 2028 (USD MILLION)
           TABLE 19 MARKET, BY INGREDIENT, 2019–2022 (USD MILLION)
           TABLE 20 MARKET, BY INGREDIENT, 2023–2028 (USD MILLION)
           TABLE 21 MARKET, BY INGREDIENT, 2019–2022 (KT)
           TABLE 22 MARKET, BY INGREDIENT, 2023–2028 (KT)
    7.2 WHEAT 
           7.2.1 HEALTH BENEFITS OFFERED BY WHEAT TO DRIVE DEMAND FOR WHEAT SOURDOUGH
                    TABLE 23 WHEAT: MARKET, BY REGION, 2019–2022 (USD MILLION)
                    TABLE 24 WHEAT: MARKET, BY REGION, 2023–2028 (USD MILLION)
                    TABLE 25 WHEAT: MARKET, BY REGION, 2019–2022 (KT)
                    TABLE 26 WHEAT: MARKET, BY REGION, 2023–2028 (KT)
    7.3 BARLEY 
           7.3.1 ABILITY OF BARLEY SOURDOUGH TO RETARD STALING PROCESS AND INHIBIT MOLD GROWTH TO PROPEL DEMAND
                    TABLE 27 BARLEY: MARKET, BY REGION, 2019–2022 (USD MILLION)
                    TABLE 28 BARLEY: MARKET, BY REGION, 2023–2028 (USD MILLION)
                    TABLE 29 BARLEY: MARKET, BY REGION, 2019–2022 (KT)
                    TABLE 30 BARLEY: MARKET, BY REGION, 2023–2028 (KT)
    7.4 OATS 
           7.4.1 NUTRITIONAL ADVANTAGES AND EXCEPTIONAL NUTTY TASTE OF OATS SOURDOUGH TO BOOST MARKET
                    TABLE 31 OATS: SOURDOUGH MARKET, BY REGION, 2019–2022 (USD MILLION)
                    TABLE 32 OATS: MARKET, BY REGION, 2023–2028 (USD MILLION)
                    TABLE 33 OATS: MARKET, BY REGION, 2019–2022 (KT)
                    TABLE 34 OATS: MARKET, BY REGION, 2023–2028 (KT)
 
8 MARKET, BY TYPE (Page No. - 102)
    8.1 INTRODUCTION 
           FIGURE 31 MARKET, BY TYPE, 2023 VS. 2028 (USD MILLION)
           TABLE 35 MARKET, BY TYPE, 2019–2022 (USD MILLION)
           TABLE 36 MARKET, BY TYPE, 2023–2028 (USD MILLION)
    8.2 TYPE I 
           8.2.1 INCREASING APPLICATION OF TYPE I SOURDOUGH IN ARTISANAL BAKERIES TO DRIVE GROWTH
                    TABLE 37 TYPE I: MARKET, BY REGION, 2019–2022 (USD MILLION)
                    TABLE 38 TYPE I: MARKET, BY REGION, 2023–2028 (USD MILLION)
    8.3 TYPE II 
           8.3.1 UNIQUE ORGANOLEPTIC PROPERTIES OF TYPE II SOURDOUGH TO PROPEL MARKET
                    TABLE 39 TYPE II: MARKET, BY REGION, 2019–2022 (USD MILLION)
                    TABLE 40 TYPE II: MARKET, BY REGION, 2023–2028 (USD MILLION)
    8.4 TYPE III 
           8.4.1 EXTENDED SHELF-LIFE AND CONVENIENT HANDLING AND STORAGE OF TYPE III SOURDOUGH TO PROPEL GROWTH
                    TABLE 41 TYPE III: MARKET, BY REGION, 2019–2022 (USD MILLION)
                    TABLE 42 TYPE III: MARKET, BY REGION, 2023–2028 (USD MILLION)
 
9 MARKET, BY APPLICATION (Page No. - 108)
    9.1 INTRODUCTION 
           FIGURE 32 MARKET, BY APPLICATION, 2023 VS. 2028 (USD MILLION)
           TABLE 43 MARKET, BY APPLICATION, 2019–2022 (USD MILLION)
           TABLE 44 MARKET, BY APPLICATION, 2023–2028 (USD MILLION)
    9.2 BREAD & BUNS 
           9.2.1 CONSUMER PREFERENCE FOR CLEAN-LABEL NATURAL FOOD PRODUCTS TO DRIVE DEMAND
                    TABLE 45 BREAD & BUNS: SOURDOUGH MARKET, BY REGION, 2019–2022 (USD MILLION)
                    TABLE 46 BREAD & BUNS: MARKET, BY REGION, 2023–2028 (USD MILLION)
    9.3 COOKIES 
           9.3.1 RISING DEMAND FOR NUTRITIOUS COOKIES TO DRIVE MARKET
                    TABLE 47 COOKIES: MARKET, BY REGION, 2019–2022 (USD MILLION)
                    TABLE 48 COOKIES: MARKET, BY REGION, 2023–2028 (USD MILLION)
    9.4 CAKES 
           9.4.1 INCREASED PREFERENCE FOR FLAVORFUL, TENDER CAKES TO PROPEL MARKET
                    TABLE 49 CAKES: MARKET, BY REGION, 2019–2022 (USD MILLION)
                    TABLE 50 CAKES: MARKET, BY REGION, 2023–2028 (USD MILLION)
    9.5 PIZZAS 
           9.5.1 DEMAND FOR ARTISANAL AND PREMIUM PIZZA OPTIONS TO DRIVE MARKET EXPANSION
                    TABLE 51 PIZZAS: MARKET, BY REGION, 2019–2022 (USD MILLION)
                    TABLE 52 PIZZAS: MARKET, BY REGION, 2023–2028 (USD MILLION)
    9.6 OTHER APPLICATIONS 
           TABLE 53 OTHER APPLICATIONS: MARKET, BY REGION, 2019–2022 (USD MILLION)
           TABLE 54 OTHER APPLICATIONS: MARKET, BY REGION, 2023–2028 (USD MILLION)
 
10 SOURDOUGH MARKET, BY REGION (Page No. - 117)
     10.1 INTRODUCTION 
               FIGURE 33 NEW HOTSPOTS TO EMERGE IN ASIA PACIFIC MARKET DURING FORECAST PERIOD
               TABLE 55 MARKET, BY REGION, 2019–2022 (USD MILLION)
               TABLE 56 MARKET, BY REGION, 2023–2028 (USD MILLION)
               TABLE 57 MARKET, BY REGION, 2019–2022 (KT)
               TABLE 58 MARKET, BY REGION, 2023–2028 (KT)
     10.2 NORTH AMERICA 
               FIGURE 34 NORTH AMERICA: MARKET SNAPSHOT
             10.2.1 NORTH AMERICA: RECESSION IMPACT
                       FIGURE 35 NORTH AMERICAN MARKET: RECESSION IMPACT ANALYSIS
                       TABLE 59 NORTH AMERICA: MARKET, BY COUNTRY, 2019–2022 (USD MILLION)
                       TABLE 60 NORTH AMERICA: MARKET, BY COUNTRY, 2023–2028 (USD MILLION)
                       TABLE 61 NORTH AMERICA: MARKET, BY APPLICATION, 2019–2022 (USD MILLION)
                       TABLE 62 NORTH AMERICA: MARKET, BY APPLICATION, 2023–2028 (USD MILLION)
                       TABLE 63 NORTH AMERICA: MARKET, BY INGREDIENT, 2019–2022 (USD MILLION)
                       TABLE 64 NORTH AMERICA: SOURDOUGH MARKET, BY INGREDIENT, 2023–2028 (USD MILLION)
                       TABLE 65 NORTH AMERICA: MARKET, BY TYPE, 2019–2022 (USD MILLION)
                       TABLE 66 NORTH AMERICA: MARKET, BY TYPE, 2023–2028 (USD MILLION)
             10.2.2 US
                       10.2.2.1 Expanding bakery sector to encourage market growth
                                   TABLE 67 US: MARKET, BY INGREDIENT, 2019–2022 (USD MILLION)
                                   TABLE 68 US: MARKET, BY INGREDIENT, 2023–2028 (USD MILLION)
                                   TABLE 69 US: MARKET, BY INGREDIENT, 2019–2022 (KT)
                                   TABLE 70 US: MARKET, BY INGREDIENT, 2023–2028 (KT)
             10.2.3 CANADA
                       10.2.3.1 Increased prevalence of celiac diseases to drive growth
                                   TABLE 71 CANADA: MARKET, BY INGREDIENT, 2019–2022 (USD MILLION)
                                   TABLE 72 CANADA: MARKET, BY INGREDIENT, 2023–2028 (USD MILLION)
                                   TABLE 73 CANADA: MARKET, BY INGREDIENT, 2019–2022 (KT)
                                   TABLE 74 CANADA: MARKET, BY INGREDIENT, 2023–2028 (KT)
             10.2.4 MEXICO
                       10.2.4.1 Increase in demand for biodegradable plastics in various food packaging applications to drive growth
                                   TABLE 75 MEXICO: MARKET, BY INGREDIENT, 2019–2022 (USD MILLION)
                                   TABLE 76 MEXICO: MARKET, BY INGREDIENT, 2023–2028 (USD MILLION)
                                   TABLE 77 MEXICO: MARKET, BY INGREDIENT, 2019–2022 (KT)
                                   TABLE 78 MEXICO: MARKET, BY INGREDIENT, 2023–2028 (KT)
     10.3 EUROPE 
             10.3.1 EUROPE: RECESSION IMPACT
                       TABLE 79 EUROPE: SOURDOUGH MARKET, BY COUNTRY, 2019–2022 (USD MILLION)
                       TABLE 80 EUROPE: MARKET, BY COUNTRY, 2023–2028 (USD MILLION)
                       TABLE 81 EUROPE: MARKET, BY APPLICATION, 2019–2022 (USD MILLION)
                       TABLE 82 EUROPE: MARKET, BY APPLICATION, 2023–2028 (USD MILLION)
                       TABLE 83 EUROPE: MARKET, BY INGREDIENT, 2019–2022 (USD MILLION)
                       TABLE 84 EUROPE: MARKET, BY INGREDIENT, 2023–2028 (USD MILLION)
                       TABLE 85 EUROPE: MARKET, BY TYPE, 2019–2022 (USD MILLION)
                       TABLE 86 EUROPE: MARKET, BY TYPE, 2023–2028 (USD MILLION)
             10.3.2 GERMANY
                       10.3.2.1 Rising consumption of bread to boost market expansion
                                   TABLE 87 GERMANY: MARKET, BY INGREDIENT, 2019–2022 (USD MILLION)
                                   TABLE 88 GERMANY: MARKET, BY INGREDIENT, 2023–2028 (USD MILLION)
                                   TABLE 89 GERMANY: MARKET, BY INGREDIENT, 2019–2022 (KT)
                                   TABLE 90 GERMANY: MARKET, BY INGREDIENT, 2023–2028 (KT)
             10.3.3 FRANCE
                       10.3.3.1 Rapid growth of bakery sector to offer favorable market opportunities
                                   TABLE 91 FRANCE: MARKET, BY INGREDIENT, 2019–2022 (USD MILLION)
                                   TABLE 92 FRANCE: MARKET, BY INGREDIENT, 2023–2028 (USD MILLION)
                                   TABLE 93 FRANCE: MARKET, BY INGREDIENT, 2019–2022 (KT)
                                   TABLE 94 FRANCE: MARKET, BY INGREDIENT, 2023–2028 (KT)
             10.3.4 UK
                       10.3.4.1 Growing popularity of ready-to-eat food products to drive demand
                                   TABLE 95 UK: MARKET, BY INGREDIENT, 2019–2022 (USD MILLION)
                                   TABLE 96 UK: MARKET, BY INGREDIENT, 2023–2028 (USD MILLION)
                                   TABLE 97 UK: MARKET, BY INGREDIENT, 2019–2022 (KT)
                                   TABLE 98 UK: MARKET, BY INGREDIENT, 2023–2028 (KT)
             10.3.5 ITALY
                       10.3.5.1 Increasing number of artisanal bakeries to foster market growth
                                   TABLE 99 ITALY: MARKET, BY INGREDIENT, 2019–2022 (USD MILLION)
                                   TABLE 100 ITALY: MARKET, BY INGREDIENT, 2023–2028 (USD MILLION)
                                   TABLE 101 ITALY: SOURDOUGH MARKET, BY INGREDIENT, 2019–2022 (KT)
                                   TABLE 102 ITALY: MARKET, BY INGREDIENT, 2023–2028 (KT)
             10.3.6 SPAIN
                       10.3.6.1 Country’s culinary heritage and deeply rooted gastronomic culture to drive preference for sourdough
                                   TABLE 103 SPAIN: MARKET, BY INGREDIENT, 2019–2022 (USD MILLION)
                                   TABLE 104 SPAIN: MARKET, BY INGREDIENT, 2023–2028 (USD MILLION)
                                   TABLE 105 SPAIN: MARKET, BY INGREDIENT, 2019–2022 (KT)
                                   TABLE 106 SPAIN: MARKET, BY INGREDIENT, 2023–2028 (KT)
             10.3.7 REST OF EUROPE
                       TABLE 107 REST OF EUROPE: MARKET, BY INGREDIENT, 2019–2022 (USD MILLION)
                       TABLE 108 REST OF EUROPE: MARKET, BY INGREDIENT, 2023–2028 (USD MILLION)
                       TABLE 109 REST OF EUROPE: MARKET, BY INGREDIENT, 2019–2022 (KT)
                       TABLE 110 REST OF EUROPE: MARKET, BY INGREDIENT, 2023–2028 (KT)
     10.4 ASIA PACIFIC 
             10.4.1 ASIA PACIFIC: RECESSION IMPACT
                       TABLE 111 ASIA PACIFIC: MARKET, BY COUNTRY, 2019–2022 (USD MILLION)
                       TABLE 112 ASIA PACIFIC: MARKET, BY COUNTRY, 2023–2028 (USD MILLION)
                       TABLE 113 ASIA PACIFIC: MARKET, BY APPLICATION, 2019–2022 (USD MILLION)
                       TABLE 114 ASIA PACIFIC: MARKET, BY APPLICATION, 2023–2028 (USD MILLION)
                       TABLE 115 ASIA PACIFIC: MARKET, BY INGREDIENT, 2019–2022 (USD MILLION)
                       TABLE 116 ASIA PACIFIC: MARKET, BY INGREDIENT, 2023–2028 (USD MILLION)
                       TABLE 117 ASIA PACIFIC: MARKET, BY TYPE, 2019–2022 (USD MILLION)
                       TABLE 118 ASIA PACIFIC: MARKET, BY TYPE, 2023–2028 (USD MILLION)
             10.4.2 CHINA
                       10.4.2.1 High demand for convenient food options to drive growth
                                   TABLE 119 CHINA: MARKET, BY INGREDIENT, 2019–2022 (USD MILLION)
                                   TABLE 120 CHINA: MARKET, BY INGREDIENT, 2023–2028 (USD MILLION)
                                   TABLE 121 CHINA: MARKET, BY INGREDIENT, 2019–2022 (KT)
                                   TABLE 122 CHINA: MARKET, BY INGREDIENT, 2023–2028 (KT)
             10.4.3 INDIA
                       10.4.3.1 Presence of numerous small-scale and industrial bakeries to drive demand
                                   TABLE 123 INDIA: MARKET, BY INGREDIENT, 2019–2022 (USD MILLION)
                                   TABLE 124 INDIA: SOURDOUGH MARKET, BY INGREDIENT, 2023–2028 (USD MILLION)
                                   TABLE 125 INDIA: MARKET, BY INGREDIENT, 2019–2022 (KT)
                                   TABLE 126 INDIA: MARKET, BY INGREDIENT, 2023–2028 (KT)
             10.4.4 JAPAN
                       10.4.4.1 Remarkable surge in demand for bread to drive market
                                   TABLE 127 JAPAN: MARKET, BY INGREDIENT, 2019–2022 (USD MILLION)
                                   TABLE 128 JAPAN: MARKET, BY INGREDIENT, 2023–2028 (USD MILLION)
                                   TABLE 129 JAPAN: MARKET, BY INGREDIENT, 2019–2022 (KT)
                                   TABLE 130 JAPAN: MARKET, BY INGREDIENT, 2023–2028 (KT)
             10.4.5 AUSTRALIA & NEW ZEALAND
                       10.4.5.1 Increase in healthy and sustainable food choices among consumers to drive demand
                                   TABLE 131 AUSTRALIA & NEW ZEALAND: MARKET, BY INGREDIENT, 2019–2022 (USD MILLION)
                                   TABLE 132 AUSTRALIA & NEW ZEALAND: MARKET, BY INGREDIENT,  2023–2028 (USD MILLION)
                                   TABLE 133 AUSTRALIA & NEW ZEALAND: MARKET, BY INGREDIENT, 2019–2022 (KT)
                                   TABLE 134 AUSTRALIA & NEW ZEALAND: MARKET, BY INGREDIENT, 2023–2028 (KT)
             10.4.6 REST OF ASIA PACIFIC
                       TABLE 135 REST OF ASIA PACIFIC: MARKET, BY INGREDIENT,  2019–2022 (USD MILLION)
                       TABLE 136 REST OF ASIA PACIFIC: MARKET, BY INGREDIENT,  2023–2028 (USD MILLION)
                       TABLE 137 REST OF ASIA PACIFIC: MARKET, BY INGREDIENT, 2019–2022 (KT)
                       TABLE 138 REST OF ASIA PACIFIC: MARKET, BY INGREDIENT, 2023–2028 (KT)
     10.5 SOUTH AMERICA 
             10.5.1 SOUTH AMERICA: RECESSION IMPACT
                       TABLE 139 SOUTH AMERICA: MARKET, BY COUNTRY, 2019–2022 (USD MILLION)
                       TABLE 140 SOUTH AMERICA: MARKET, BY COUNTRY, 2023–2028 (USD MILLION)
                       TABLE 141 SOUTH AMERICA: MARKET, BY APPLICATION, 2019–2022 (USD MILLION)
                       TABLE 142 SOUTH AMERICA: MARKET, BY APPLICATION, 2023–2028 (USD MILLION)
                       TABLE 143 SOUTH AMERICA: MARKET, BY INGREDIENT, 2019–2022 (USD MILLION)
                       TABLE 144 SOUTH AMERICA: MARKET, BY INGREDIENT, 2023–2028 (USD MILLION)
                       TABLE 145 SOUTH AMERICA: MARKET, BY INGREDIENT, 2019–2022 (KT)
                       TABLE 146 SOUTH AMERICA: MARKET, BY INGREDIENT, 2023–2028 (KT)
                       TABLE 147 SOUTH AMERICA: MARKET, BY TYPE, 2019–2022 (USD MILLION)
                       TABLE 148 SOUTH AMERICA: MARKET, BY TYPE, 2023–2028 (USD MILLION)
             10.5.2 BRAZIL
                       10.5.2.1 Growth of bread and bakery market to spur market expansion
                                   TABLE 149 BRAZIL: MARKET, BY INGREDIENT, 2019–2022 (USD MILLION)
                                   TABLE 150 BRAZIL: SOURDOUGH MARKET, BY INGREDIENT, 2023–2028 (USD MILLION)
                                   TABLE 151 BRAZIL: MARKET, BY INGREDIENT, 2019–2022 (KT)
                                   TABLE 152 BRAZIL: MARKET, BY INGREDIENT, 2023–2028 (KT)
             10.5.3 ARGENTINA
                       10.5.3.1 Government initiatives to subsidize flour mills to boost demand
                                   TABLE 153 ARGENTINA: MARKET, BY INGREDIENT, 2019–2022 (USD MILLION)
                                   TABLE 154 ARGENTINA: MARKET, BY INGREDIENT, 2023–2028 (USD MILLION)
                                   TABLE 155 ARGENTINA: MARKET, BY INGREDIENT, 2019–2022 (KT)
                                   TABLE 156 ARGENTINA: MARKET, BY INGREDIENT, 2023–2028 (KT)
             10.5.4 REST OF SOUTH AMERICA
                       TABLE 157 REST OF SOUTH AMERICA: MARKET, BY INGREDIENT,  2019–2022 (USD MILLION)
                       TABLE 158 REST OF SOUTH AMERICA: MARKET, BY INGREDIENT,  2023–2028 (USD MILLION)
                       TABLE 159 REST OF SOUTH AMERICA: MARKET, BY INGREDIENT, 2019–2022 (KT)
                       TABLE 160 REST OF SOUTH AMERICA: MARKET, BY INGREDIENT, 2023–2028 (KT)
     10.6 REST OF THE WORLD (ROW) 
             10.6.1 ROW: RECESSION IMPACT
                       TABLE 161 ROW: MARKET, BY REGION, 2019–2022 (USD MILLION)
                       TABLE 162 ROW: MARKET, BY REGION, 2023–2028 (USD MILLION)
                       TABLE 163 ROW: MARKET, BY APPLICATION,  2019–2022 (USD MILLION)
                       TABLE 164 ROW: MARKET, BY APPLICATION, 2023–2028 (USD MILLION)
                       TABLE 165 ROW: MARKET, BY INGREDIENT, 2019–2022 (USD MILLION)
                       TABLE 166 ROW: MARKET, BY INGREDIENT, 2023–2028 (USD MILLION)
                       TABLE 167 ROW: MARKET, BY INGREDIENT, 2019–2022 (KT)
                       TABLE 168 ROW: MARKET, BY INGREDIENT, 2023–2028 (KT)
                       TABLE 169 ROW: MARKET, BY TYPE, 2019–2022 (USD MILLION)
                       TABLE 170 ROW: MARKET, BY TYPE, 2023–2028 (USD MILLION)
             10.6.2 MIDDLE EAST
                       10.6.2.1 Thriving bakery sector to drive growth
                                   TABLE 171 MIDDLE EAST: MARKET, BY INGREDIENT, 2019–2022 (USD MILLION)
                                   TABLE 172 MIDDLE EAST: MARKET, BY INGREDIENT, 2023–2028 (USD MILLION)
                                   TABLE 173 MIDDLE EAST: MARKET, BY INGREDIENT, 2019–2022 (KT)
                                   TABLE 174 MIDDLE EAST: MARKET, BY INGREDIENT, 2023–2028 (KT)
             10.6.3 AFRICA
                       10.6.3.1 Ability of sourdough bread to suit diverse regional tastes and flour preferences to drive growth
                                   TABLE 175 AFRICA: SOURDOUGH MARKET, BY INGREDIENT, 2019–2022 (USD MILLION)
                                   TABLE 176 AFRICA: MARKET, BY INGREDIENT, 2023–2028 (USD MILLION)
                                   TABLE 177 AFRICA: MARKET, BY INGREDIENT, 2019–2022 (KT)
                                   TABLE 178 AFRICA: MARKET, BY INGREDIENT, 2023–2028 (KT)
 
11 COMPETITIVE LANDSCAPE (Page No. - 174)
     11.1 OVERVIEW 
     11.2 HISTORICAL REVENUE ANALYSIS FOR KEY PLAYERS 
               TABLE 179 REVENUE ANALYSIS FOR KEY PLAYERS, 2020–2022 (USD BILLION)
     11.3 STRATEGIES ADOPTED BY KEY PLAYERS 
               TABLE 180 STRATEGIES ADOPTED BY KEY PLAYERS
     11.4 GLOBAL SNAPSHOT OF KEY MARKET PARTICIPANTS 
               FIGURE 36 GLOBAL SNAPSHOT OF KEY PARTICIPANTS, 2022
     11.5 MARKET SHARE ANALYSIS 
               TABLE 181 MARKET SHARE ANALYSIS OF KEY PLAYERS, 2022
     11.6 COMPANY EVALUATION MATRIX FOR KEY PLAYERS, 2022 
             11.6.1 STARS
             11.6.2 PERVASIVE PLAYERS
             11.6.3 EMERGING LEADERS
             11.6.4 PARTICIPANTS
                       FIGURE 37 COMPANY EVALUATION MATRIX FOR KEY PLAYERS, 2022
             11.6.5 PRODUCT FOOTPRINT FOR KEY PLAYERS
                       TABLE 182 SOURDOUGH MARKET: COMPANY FOOTPRINT FOR KEY PLAYERS, BY TYPE
                       TABLE 183 MARKET: COMPANY FOOTPRINT FOR KEY PLAYERS, BY APPLICATION
                       TABLE 184 MARKET: COMPANY FOOTPRINT FOR KEY PLAYERS, BY INGREDIENT
                       TABLE 185 MARKET: COMPANY FOOTPRINT FOR KEY PLAYERS, BY REGION
                       TABLE 186 MARKET: COMPETITIVE BENCHMARKING OF KEY PLAYERS
     11.7 COMPANY EVALUATION MATRIX FOR STARTUPS/SMES, 2022 
             11.7.1 PROGRESSIVE COMPANIES
             11.7.2 STARTING BLOCKS
             11.7.3 RESPONSIVE COMPANIES
             11.7.4 DYNAMIC COMPANIES
                       FIGURE 38 COMPANY EVALUATION MATRIX FOR STARTUPS/SMES, 2022
                       TABLE 187 MARKET: COMPETITIVE BENCHMARKING OF STARTUPS/SMES
     11.8 COMPETITIVE SCENARIO 
             11.8.1 PRODUCT LAUNCHES
                       TABLE 188 MARKET: PRODUCT LAUNCHES, 2022
                       TABLE 189 MARKET: DEALS, 2021
 
12 COMPANY PROFILES (Page No. - 185)
(Business overview, Products offered, Recent Developments, MNM view)*
     12.1 KEY PLAYERS 
             12.1.1 PURATOS
                       TABLE 190 PURATOS: BUSINESS OVERVIEW
                       TABLE 191 PURATOS: PRODUCTS OFFERED
                       TABLE 192 PURATOS: DEALS
             12.1.2 IREKS GMBH
                       TABLE 193 IREKS GMBH: BUSINESS OVERVIEW
                       TABLE 194 IREKS GMBH: PRODUCTS OFFERED
             12.1.3 LALLEMAND INC.
                       TABLE 195 LALLEMAND INC.: BUSINESS OVERVIEW
                       TABLE 196 LALLEMAND INC.: PRODUCTS OFFERED
             12.1.4 LESAFFRE
                       TABLE 197 LESAFFRE: BUSINESS OVERVIEW
                       TABLE 198 LESAFFRE: PRODUCTS OFFERED
             12.1.5 GOODMILLS
                       TABLE 199 GOODMILLS: SOURDOUGH MARKET BUSINESS OVERVIEW
                       TABLE 200 GOODMILLS: PRODUCTS OFFERED
             12.1.6 GOLD COAST BAKING COMPANY
                       TABLE 201 GOLD COAST BAKING COMPANY: BUSINESS OVERVIEW
                       TABLE 202 GOLD COAST BAKING COMPANY: PRODUCTS OFFERED
             12.1.7 BOUDIN BAKERY
                       TABLE 203 BOUDIN BAKERY: BUSINESS OVERVIEW
                       TABLE 204 BOUDIN BAKERY: PRODUCTS OFFERED
             12.1.8 PHILIBERT SAVOURS
                       TABLE 205 PHILIBERT SAVOURS: BUSINESS OVERVIEW
                       TABLE 206 PHILIBERT SAVOURS: PRODUCTS OFFERED
             12.1.9 ERNST BÖCKER GMBH & CO. KG
                       TABLE 207 ERNST BÖCKER GMBH & CO. KG: BUSINESS OVERVIEW
                       TABLE 208 ERNST BÖCKER GMBH & CO. KG: PRODUCTS OFFERED
                       TABLE 209 ERNST BÖCKER GMBH & CO. KG: PRODUCT LAUNCHES
             12.1.10 BAKE WITH BROLITE
                       TABLE 210 BAKE WITH BROLITE: BUSINESS OVERVIEW
                       TABLE 211 BAKE WITH BROLITE: PRODUCTS OFFERED
             12.1.11 SEMIFREDDI’S
                       TABLE 212 SEMIFREDDI’S: BUSINESS OVERVIEW
                       TABLE 213 SEMIFREDDI’S: PRODUCTS OFFERED
             12.1.12 KING ARTHUR BAKING COMPANY, INC.
                       TABLE 214 KING ARTHUR BAKING COMPANY, INC.: SOURDOUGH MARKET BUSINESS OVERVIEW
                       TABLE 215 KING ARTHUR BAKING COMPANY, INC.: PRODUCTS OFFERED
             12.1.13 DR. SUWELACK
                       TABLE 216 DR. SUWELACK: BUSINESS OVERVIEW
                       TABLE 217 DR. SUWELACK: PRODUCTS OFFERED
                       TABLE 218 DR. SUWELACK: PRODUCT LAUNCHES
             12.1.14 CULTURES FOR HEALTH
                       TABLE 219 CULTURES FOR HEALTH: BUSINESS OVERVIEW
                       TABLE 220 CULTURES FOR HEALTH: PRODUCTS OFFERED
             12.1.15 LA BREA BAKERY
                       TABLE 221 LA BREA BAKERY: BUSINESS OVERVIEW
                       TABLE 222 LA BREA BAKERY: PRODUCTS OFFERED
*Details on Business overview, Products offered, Recent Developments, MNM view might not be captured in case of unlisted companies.
     12.2 STARTUPS/SMES 
             12.2.1 ITALMILL
             12.2.2 POILÂNE
             12.2.3 THE ACME BREAD COMPANY
             12.2.4 THE SOURDOUGH COMPANY
             12.2.5 THEOBROMA
 
13 ADJACENT & RELATED MARKETS (Page No. - 217)
     13.1 INTRODUCTION 
     13.2 LIMITATIONS 
     13.3 STARTER CULTURES MARKET 
             13.3.1 MARKET DEFINITION
             13.3.2 SOURDOUGH MARKET OVERVIEW
             13.3.3 STARTER CULTURES MARKET, BY FORM
                       TABLE 223 STARTER CULTURES MARKET, BY FORM, 2017–2021 (USD MILLION)
                       TABLE 224 STARTER CULTURES MARKET, BY FORM, 2022–2027 (USD MILLION)
                       TABLE 225 STARTER CULTURES MARKET, BY FORM, 2017–2021 (KT)
                       TABLE 226 STARTER CULTURES MARKET, BY FORM, 2022–2027 (KT)
             13.3.4 STARTER CULTURES MARKET, BY REGION
                       TABLE 227 STARTER CULTURES MARKET, BY REGION, 2017–2021 (USD MILLION)
                       TABLE 228 STARTER CULTURES MARKET, BY REGION, 2022–2027 (USD MILLION)
     13.4 BAKERY PREMIXES MARKET 
             13.4.1 MARKET DEFINITION
             13.4.2 MARKET OVERVIEW
             13.4.3 BAKERY PREMIXES MARKET, BY TYPE
                       TABLE 229 BAKERY PREMIXES MARKET, BY TYPE, 2017–2025 (USD THOUSAND)
                       TABLE 230 BAKERY PREMIXES MARKET, BY TYPE, 2017–2025 (KT)
             13.4.4 BAKERY PREMIXES MARKET, BY REGION
                       TABLE 231 BAKERY PREMIXES MARKET, BY REGION, 2017–2025 (USD THOUSAND)
                       TABLE 232 BAKERY PREMIXES MARKET, BY REGION, 2017–2025 (KT)
 
14 APPENDIX (Page No. - 225)
     14.1 DISCUSSION GUIDE 
     14.2 KNOWLEDGESTORE: MARKETSANDMARKETS’ SUBSCRIPTION PORTAL 
     14.3 CUSTOMIZATION OPTIONS 
     14.4 RELATED REPORTS 
     14.5 AUTHOR DETAILS 

This research involves the extensive use of secondary sources; directories; and databases (Bloomberg and Factiva) to identify and collect information useful for a technical, market-oriented, and commercial study of the Sourdough market. In-depth interviews were conducted with various primary respondents, such as key industry participants, Subject Matter Experts (SMEs), C-level executives of key market players, and industry consultants, to obtain and verify critical qualitative and quantitative information and to assess prospects.

Secondary Research

In the secondary research process, various sources, such as the Food and Agricultural Organization (FAO), United States Department of Agriculture (USDA), U.S. Food and Drug Administration (FDA) U.S. Food and Drug Administration (FDA), European Food Safety Authority (EFSA), World Health Organization (WHO), Consumer Healthcare Products Association (CHPA), European Federation of Associations of Health Product Manufacturers (EHPM), Canadian Health Food Association (CHFA), and Health Food Manufacturers' Association (HFMA), associations were referred to identify and collect information for this study. The secondary sources also include journals, press releases, investor presentations of companies, whitepapers, certified publications, articles by recognized authors and regulatory bodies, trade directories, and paid databases.

Primary Research

The Sourdough market encompasses various stakeholders involved in the supply chain, raw material manufacturers, raw material suppliers, regulatory organizations, and research institutions. To gather comprehensive information, primary sources from both the supply and demand sides were engaged. Primary interviewees from the supply side consisted of manufacturers, distributors, importers, and technology providers involved in the production and distribution of sourdough. On the demand side, key opinion leaders, executives, and CEOs of companies in the Sourdough industry were approached through questionnaires, emails, and telephonic interviews. This approach ensured a comprehensive and well-rounded understanding of the Sourdough market from various perspectives.
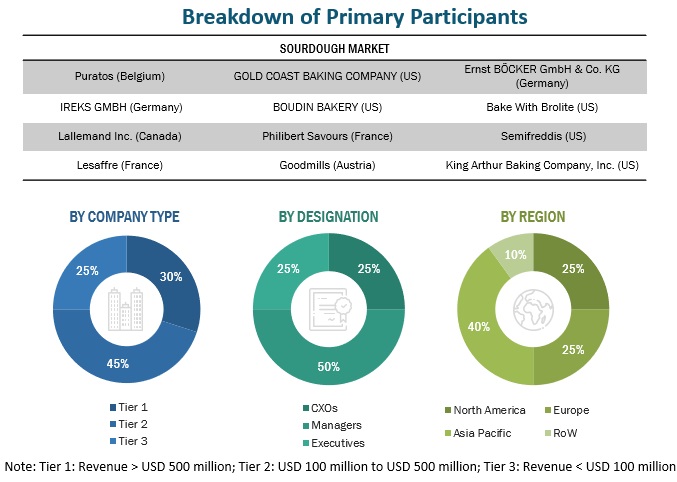
Sourdough Market Primary Participants

To know about the assumptions considered for the study, download the pdf brochure

Sourdough Market Size Estimation

The top-down and bottom-up approaches were used to estimate and validate the market’s and various dependent submarkets’ size. The research methodology used to estimate the market size includes extensive secondary research of key players, reports, reviews, and newsletters of top market players, along with extensive interviews from leaders, such as CEOs, directors, and marketing executives.

Global Sourdough market size: Bottom-Up Approach
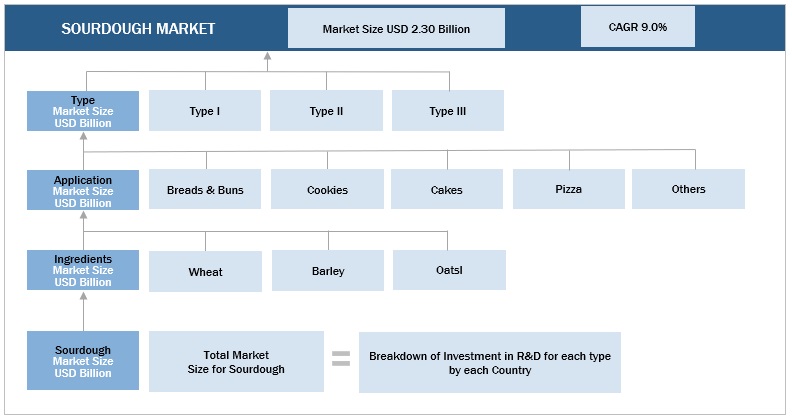
Sourdough Market Bottom-Up Approach

To know about the assumptions considered for the study, Request for Free Sample Report

Global Sourdough market size: Top-Down Approach

Sourdough Market Top-Down Approach

Data Triangulation

The data triangulation and market breakdown procedures explained above were implemented, wherever applicable, to complete the overall market engineering process and arrive at the exact statistics for various market segments and subsegments. The data was triangulated by studying various factors and trends from the demand and supply sides. Along with this, the market size was validated using both the top-down and bottom-up approaches.

Sourdough Market Definition

A sourdough is a form of dough fermented by yeast and lactic acid bacteria (LAB) that is used as sponge dough in bread production. The creation, maintenance, and usage of a complex and varied starter culture are essential components of the ancient technique of creating sourdough bread. Around the world, sourdough starter cultures are used to make bread on both a small-scale (artisanal) and large-scale (commercial) basis. While there is a lot of scientific research on sourdough, neither the scientific community nor the bread industry has standardized methods for using sourdough starters, and there aren't many suggestions for where sourdough research should go in the future.

Stakeholders

  • Raw material suppliers
  • Traders, distributors, and manufacturers & suppliers of bakery fillings
  • Bakery product manufacturers
  • Government and research organizations
  • Trade associations and industry bodies
  • Government authorities
    • American Bakers Association (ABA)
    • Specialty Food Association (SFA)
    • Baking Association of Canada (BAC)
    • International Dairy Deli Bakery Association (IDDBA)
    • Brazilian Manufacturers Association of Biscuits, Pasta and Industrialized Breads & Cakes (ABIMAPI)
    • Craft Bakers Association (CBA)
    • European Commission
    • European Food Safety Authority (EFSA)

Sourdough Market Report Objectives

  • To define, segment, and project the global market for Sourdough on the basis of type, application, ingredients, and region 
  • To provide detailed information regarding the key factors influencing the growth of the market (drivers, restraints, opportunities, and industry-specific challenges)
  • To strategically analyze the micro markets with respect to individual growth trends, future prospects, and their contribution to the total market
  • To analyze the opportunities in the market for stakeholders and provide a competitive landscape of the market leaders
  • To project the size of the market and its submarkets, in terms of value with respect to the regions (along with the key countries)
  • To strategically profile the key players and comprehensively analyze their market position and core competencies
  • To analyze competitive developments in the Sourdough market, including joint ventures, mergers & acquisitions, new product developments, and research & development activities

Available Customizations:

With the given market data, MarketsandMarkets offers customizations according to company-specific scientific needs.

The following customization options are available for the report:

Product Analysis

  • Product Matrix, which gives a detailed comparison of the product portfolio of each company

Geographic Analysis

  • Further breakdown of the Rest of the European Sourdough market, by key country
  • Further breakdown of the Rest of the Asia Pacific market, by key country
  • Further breakdown of the Rest of South America market, by key country

Company Information

  • Detailed analyses and profiling of additional market players
Custom Market Research Services

We will customize the research for you, in case the report listed above does not meet with your exact requirements. Our custom research will comprehensively cover the business information you require to help you arrive at strategic and profitable business decisions.

Request Customization
Report Code
FB 8726
Published ON
Jul, 2023
Choose License Type
BUY NOW
  • SHARE
X
Request Customization
Speak to Analyst
Speak to Analyst
OR FACE-TO-FACE MEETING
PERSONALIZE THIS RESEARCH
  • Triangulate with your Own Data
  • Get Data as per your Format and Definition
  • Gain a Deeper Dive on a Specific Application, Geography, Customer or Competitor
  • Any level of Personalization
REQUEST A FREE CUSTOMIZATION
LET US HELP YOU!
  • What are the Known and Unknown Adjacencies Impacting the Sourdough Market
  • What will your New Revenue Sources be?
  • Who will be your Top Customer; what will make them switch?
  • Defend your Market Share or Win Competitors
  • Get a Scorecard for Target Partners
CUSTOMIZED WORKSHOP REQUEST
+1-888-600-6441
  • Call Us
  • +1-888-600-6441 (Corporate office hours)
  • +1-888-600-6441 (US/Can toll free)
  • +44-800-368-9399 (UK office hours)
CONNECT WITH US
ABOUT TRUST ONLINE
©2024 MarketsandMarkets Research Private Ltd. All rights reserved
DMCA.com Protection Status Website Feedback