Innovation Management Market by Component (Solutions and Services), Function (Product Development and Business Processes), Deployment Mode, Organization Size, Vertical, and Region - Global Forecast to 2026
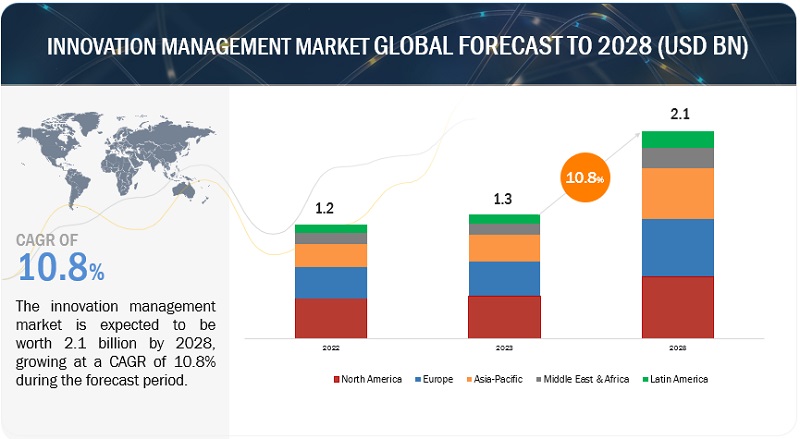
[233 Pages Report] The innovation management market size is expected to grow from USD 1.0 billion in 2021 to USD 1.7 billion by 2026, at a Compound Annual Growth Rate (CAGR) of 10.2% during the forecast period. Innovation management solutions are rapidly gaining acceptance worldwide by large enterprises and SMEs due to various benefits, including the rise in digitization and emerging trend of workplace transformation, reduced costs, efficient collaborations, and reduced time to market new products.
To know about the assumptions considered for the study, Request for Free Sample Report
COVID-19 Impact
Innovation management can be applied to new technologies, such as robots, rockets, self-driving cars, virtual reality, and AI. Innovation happens every day, at all levels, in all kinds of enterprises. It is the outcome of ideation that solves customer problems consistently. Though COVID-19 has impacted all the enterprises across industries, innovation in enterprises has not stopped. However, the COVID-19 pandemic has impacted the innovation management market for a short period.
Market Dynamics
Drivers: Increase in demand for crowdsourcing innovation across verticals
Open innovation involves the exchange of ideas or knowledge between stakeholders, such as business partners, employees of enterprises, the public, and customers, to advance products, services, and business processes for better customer experience and more revenue generation. Crowdsourcing innovation is similar to open innovation. It starts with ideas for the improvement of products and services and indicates innovation trends toward open business models. It creates a strong bond between stakeholders, such as enterprises, and their employees and customers. Based on the exchange of ideas, enterprise management teams can predict the ideas that would increase revenue and improve customer experience. This would also improve brand reliability and help stay competitive in the market. The ideas generated from crowdsourcing can either optimize the operational efficiency of enterprises or enable them to explore opportunities to drive new businesses.
Enterprises across the globe are resorting to crowdsourcing innovation, considering the potential and smartness of employees, partners, and customers. With the intense competition in the market, enterprises are looking for the first-mover advantage, thus increasing the demand for open innovation or crowdsourcing innovation. This is expected to fuel the growth of the innovation management market across the world.
Restraints: Inefficiency of enterprises to track reliable RoI from innovation management solutions
The deployment of innovation management solutions helps enterprises in boosting their business operations. However, it is observed that there are no calculable metrics to evaluate RoI resulting from the use of these innovation management solutions and services. Therefore, enterprises using innovation management solutions are unable to generate reliable RoI resulting from these solutions. Innovation management platforms need to be integrated with the implemented strategies of various enterprises to decide certain Key Performance Indicators (KPIs) that can be considered to track the level of participation of stakeholders, such as employees, customers, and partners, in innovations. Enterprises need to consider the right KPIs in line with top-level management to track and attribute business value generated by innovations. They should be aware of the value addition resulting from the implementation of selected ideas in their businesses. However, if decision-makers in enterprises are unable to relate ideas based on their business performance, then the innovation management platforms add no value to the existing processes of enterprises. Thus, the inefficiency of enterprises to track reliable RoI from innovation management solutions acts as a restraint for the growth of the innovation management market.
Challenges: Security and privacy concerns over enterprise information
Enterprise innovation-related information, especially projects, R&D activities, business processes, financial data, and business-generated transactional data, plays a crucial role in planning enterprise strategies. Therefore, enterprises are reluctant to move their confidential data as well as business processes to cloud and prefer on-premises or traditional information management methods, which inhibit the growth of the innovation management market. Though innovation management solutions have evolved in recent years, the information security capabilities of such solutions pose a major challenge for this market. Enterprises are extremely sensitive when it comes to their communication channels, such as emails, mobile communication, and instant messaging, as they directly affect the security and privacy of the enterprise data.
Opportunities: Increase in need to make informed decisions among enterprises
In the last 4 to 5 years, almost every business has transformed digitally. The tremendous growth in technologies leads to the generation of a large amount of data, and this increases the need for storing data and the speed of processing it. The development of innovation management solutions has evolved almost hand-in-hand with technological progress. Enterprises are utilizing the ideas generated from various innovation management solutions to make critical decisions. Initially, ideas were collected through forms, feedback boxes or opinions; however, with the use of innovation management solutions, enterprises have realized that new ideas increase productivity, improves profitability, and can be used to make better strategic decisions. The growing need to analyze relevant ideas from various sources has driven the need to find answers from the raw data for making critical decisions.
Based on component, services segment to be a larger contributor to the innovation management market growth during the forecast period
The innovation management market has been divided into two types: solutions and services. Innovation management solutions and services play a major role in the R&D of new and innovative products and business processes. The innovation management solution enables enterprises to exchange relevant ideas; these ideas can drive new business opportunities and growth of enterprises. The innovation management services have been divided into three types: consulting; system integration; and training, support, and maintenance. This chapter focuses on innovation management solutions and services. Innovation management consulting services consist of various services, including business consulting, business discovery, business value consulting, maturity value consulting, business alignment management, and business architecture management, which are pre-deployment needs of enterprises. These consulting services help companies implement new technologies to transform their conventional and existing infrastructure into smart infrastructure. Business consultants help clients in achieving strong business mechanisms and improving their decision-making. They also help enterprises in the development and implementation of various cost reduction programs, service delivery models, and optimized business processes.
Based on function, the business processes segment is to be a larger contributor to the innovation management market during the forecast period.
The generation of ideas through innovation management solutions for business processes would improve overall business performance, which, in turn, is expected to help enterprises increase their revenue. All ideas generated and processed on the basis of customers requirements are converted to products with the help of an innovation management solution. The idea platform leads toward more open business models and creates a strong bond between enterprises and their employees, partners, and customers. Based on ideas generated, moderators are able to predict product ideas that can give the highest returns to enterprises.
Based on deployment mode, the Cloud segment to grow at a higher rate during the forecast period
The cloud-based deployment of innovation management solutions is crucial as it offers a flexible and scalable infrastructure to handle multiple devices and analyze ideas from employees, customers, and partners. Though the implementation of innovation management solutions becomes easy due to cloud deployment, various significant challenges such as legal regulations, security and safety, performance, reliability, transformation complexity, operational control, content governance, and most essentially, promised Return on Investment (RoI) benefits exist in this type of deployment. This deployment mode is projected to gain little traction in the innovation management market, due to the challenges such as the requirement of high bandwidth, security issues, and slow processing speed.
Based on organization size, the Large Enterprises segment to be a larger contributor to the innovation management market growth during the forecast period
Based on organization size, the market is segmented into SMEs and large enterprises. The study of the innovation management market, in terms of organization size, is important as it has a direct impact on the adoption of innovation management solutions across the globe. The adoption of innovation management solutions in large enterprises is relatively higher as compared to SMEs. The rapid growth of cloud-based innovation management solutions has increased the adoption of innovation management solutions among SMEs globally. The ease of deployment, cost-effectiveness, and the presence of multiple innovation management solution providers are factors driving SMEs to adopt these solutions.
Based on verticals, the healthcare and pharmaceuticals segment to grow at a higher growth rate during the forecast period
The healthcare and pharmaceuticals vertical is undergoing transformation through the deployment of innovation management solutions. The landscape of the vertical has changed drastically over the last few years due to changes in consumer/patient demand and digitalization. These changes have challenged hospitals, chemical/pharmaceutical companies, biotechnological companies, and other healthcare businesses to think and act strategically about shaping their companies to meet the requirements of patients. Healthcare and pharmaceutical enterprises are focusing on changing their business plans to meet the needs and expectations of patients and consumers worldwide. The use of innovation management solutions is improving patient care and streamlining various medical processes in the healthcare and pharmaceuticals vertical.
To know about the assumptions considered for the study, download the pdf brochure
APAC to grow at the highest CAGR during the forecast period
APAC is geographically segmented on the basis of major contributing countries, such as China, Japan, and India. The other countries include Australia, Taiwan, Korea, Hong Kong, and Southeast Asian countries. Southeast Asian countries include Thailand, Indonesia, Burma, Malaysia, Vietnam, Cambodia, the Philippines, and Brunei. According to the Digital Trends report 2018, AI is one technology area where APAC could be the leading region globally within the next decade. In this region, the innovation management market is also forecasted to have the next big boom with regard to the ever-increasing adoption of innovation management solutions.
Key Market Players
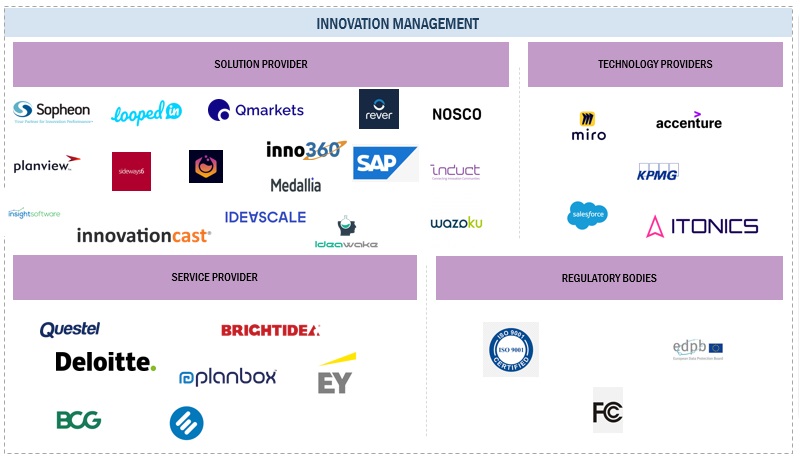
The innovation management market is dominated by companies such as Accenture (Ireland), SAP (Germany), Sopheon (US), Planview (US), Qmarkets (Israel), Brightidea (US), HYPE (Germany), Planbox (Canada), IdeaScale (US), innosabi (Germany), VIIMA (Germany), Exago (Portugal), KPMG (Netherlands), InnovationCast (Portugal), EY (Canada), Nosco (Denmark), Salesforce (US), InnoCentive (US), Medallia (US), Deloitte (UK), BCG (US), Inno360 (US), Idea Drop (UK), ITONICS (Germany), Rever (US), Induct (Norway), Sideways 6 (UK), Yambla (US), Ideawake (US), LoopedIn (UK), and Miro (US). These vendors have a large customer base and strong geographic footprint along with organized distribution channels, which helps them to increase revenues.
Get online access to the report on the World's First Market Intelligence Cloud
- Easy to Download Historical Data & Forecast Numbers
- Company Analysis Dashboard for high growth potential opportunities
- Research Analyst Access for customization & queries
- Competitor Analysis with Interactive dashboard
- Latest News, Updates & Trend analysis
Request Sample Scope of the Report
Get online access to the report on the World's First Market Intelligence Cloud
- Easy to Download Historical Data & Forecast Numbers
- Company Analysis Dashboard for high growth potential opportunities
- Research Analyst Access for customization & queries
- Competitor Analysis with Interactive dashboard
- Latest News, Updates & Trend analysis
Report Metrics |
Details |
Market size available for years |
2016-2026 |
Base year considered |
2020 |
Forecast period |
2021-2026 |
Forecast units |
Value (USD Million) |
Segments covered |
Component (Solution and Services), Deployment Mode, Organization Size, Verticals, and Regions |
Regions covered |
North America, Europe, APAC, MEA and Latin America |
Companies covered |
Accenture (Ireland), SAP (Germany), Sopheon (US), Planview (US), Qmarkets (Israel), Brightidea (US), HYPE (Germany), Planbox (Canada), IdeaScale (US), innosabi (Germany), VIIMA (Germany), Exago (Portugal), KPMG (Netherlands), InnovationCast (Portugal), EY (Canada), Nosco (Denmark), Salesforce (US), InnoCentive (US), Medallia (US), Deloitte (UK), BCG (US), Inno360 (US), Idea Drop (UK), ITONICS (Germany), Rever (US), Induct (Norway), Sideways 6 (UK), Yambla (US), Ideawake (US), LoopedIn (UK), and Miro (US). |
This research report categorizes the innovation management market to forecast revenue and analyze trends in each of the following submarkets:
Based on the Components:
- Solution
- Services
Based on the Function:
- Product Development
- Business Processes
Based on the services:
- Consulting
- System Integration
- Training, Support, and Maintenance
Based on the Deployment Mode:
- On-premises
- Cloud
Based on the Organization Size:
- Large Enterprises
- Small and Medium-Sized Enterprises (SMEs)
Based on the Vertical:
- BFSI
- Retail and eCommerce
- Healthcare and pharmaceuticals
- Manufacturing
- IT and telecommunications
- Transportation and logistics
- Others (Energy And Utilities, Manufacturing, Media and Entertainment, and Education).
Based on Regions:
- North America
- US
- Canada
- Europe
- UK
- Germany
- France
- Rest of Europe
- APAC
- China
- Japan
- India
- Rest of APAC
- MEA
- Isreal
- UAE
- Rest of MEA
- Latin America
- Brazil
- Mexico
- Rest of Latin America
Recent Developments
- In July 2020, Planview acquired Aptage, a pioneer in the application of artificial intelligence and machine learning in work and portfolio management. Through this acquisition, Planview aimed at integrating AI and ML within their work management and portfolio management offerings.
Frequently Asked Questions (FAQ):
What is the projected market value of the innovation management market?
The innovation management market size is expected to grow from USD 1.0 billion in 2021 to USD 1.7 billion by 2026, at a Compound Annual Growth Rate (CAGR) of 10.2% during the forecast period.
Which region has the highest market share in the innovation management market?
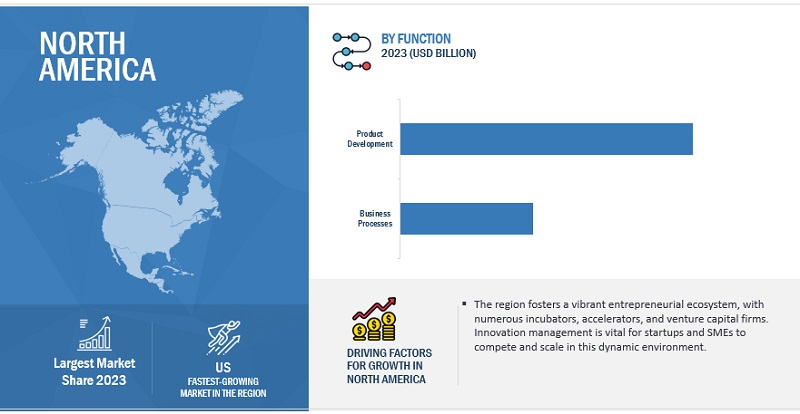
North America region has the higher market share in the innovation management market.
Which are the major vendors in the innovation management market?
Accenture (Ireland), SAP (Germany), Sopheon (US), Planview (US), Qmarkets (Israel) are major vendors in the innovation management market.
What are some of the drivers in the innovation management market?
COVID-19 pandemic has negatively impacted the adoption of cloud-based innovation management solutions across the globe. .
To speak to our analyst for a discussion on the above findings, click Speak to Analyst
TABLE OF CONTENTS
1 INTRODUCTION (Page No. - 25)
1.1 INTRODUCTION TO COVID-19
1.2 COVID-19 HEALTH ASSESSMENT
FIGURE 1 COVID-19: GLOBAL PROPAGATION
FIGURE 2 COVID-19 PROPAGATION: SELECT COUNTRIES
1.3 COVID-19 ECONOMIC ASSESSMENT
FIGURE 3 REVISED GROSS DOMESTIC PRODUCT FORECASTS FOR SELECT G20 COUNTRIES IN 2020
1.3.1 COVID-19 ECONOMIC IMPACTSCENARIO ASSESSMENT
FIGURE 4 CRITERIA IMPACTING THE GLOBAL ECONOMY
FIGURE 5 SCENARIOS IN TERMS OF RECOVERY OF THE GLOBAL ECONOMY
1.4 OBJECTIVES OF THE STUDY
1.5 MARKET DEFINITION
1.5.1 INCLUSIONS AND EXCLUSIONS
1.6 MARKET SCOPE
1.6.1 MARKET SEGMENTATION
1.6.2 REGIONS COVERED
1.6.3 PERIODIZATION CONSIDERED FOR THE STUDY
1.7 CURRENCY CONSIDERED
TABLE 1 USD EXCHANGE RATES, 20182020
1.8 STAKEHOLDERS
1.9 SUMMARY OF CHANGES
2 RESEARCH METHODOLOGY (Page No. - 35)
2.1 RESEARCH DATA
FIGURE 6 INNOVATION MANAGEMENT MARKET: RESEARCH DESIGN
2.1.1 SECONDARY DATA
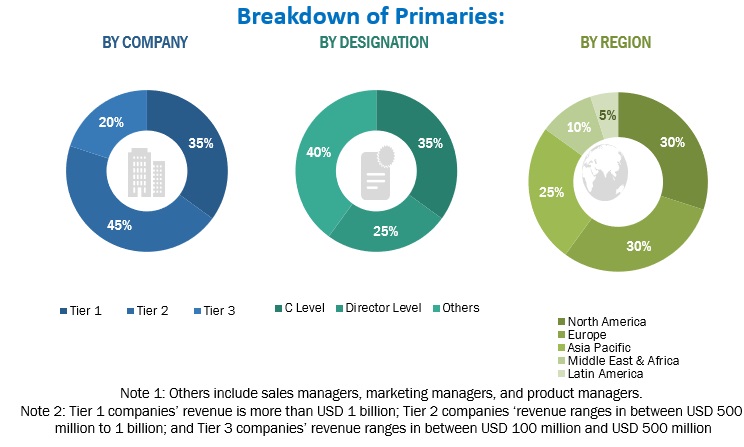
2.1.2 PRIMARY DATA
2.1.2.1 Breakup of primary profiles
FIGURE 7 BREAKUP OF PRIMARY INTERVIEWS: BY COMPANY TYPE, DESIGNATION, AND REGION
TABLE 2 PRIMARY RESPONDENTS: ENTERPRISE PERFORMANCE MANAGEMENT MARKET
2.1.2.2 Key industry insights
2.2 DATA TRIANGULATION
FIGURE 8 DATA TRIANGULATION
2.3 MARKET SIZE ESTIMATION
FIGURE 9 MARKET: TOP-DOWN AND BOTTOM-UP APPROACHES
FIGURE 10 MARKET SIZE ESTIMATION METHODOLOGY APPROACH 1 (SUPPLY SIDE): REVENUE OF INNOVATION MANAGEMENT FROM VENDORS
FIGURE 11 MARKET SIZE ESTIMATION METHODOLOGY: BOTTOM-UP APPROACH (SUPPLY SIDE): COLLECTIVE REVENUE OF INNOVATION MANAGEMENT VENDORS
FIGURE 12 MARKET SIZE ESTIMATION METHODOLOGY: APPROACH 2 (DEMAND SIDE): INNOVATION MANAGEMENT MARKET
FIGURE 13 MARKET SIZE ESTIMATION METHODOLOGY (SUPPLY SIDE): ILLUSTRATION OF VENDOR REVENUE ESTIMATION
FIGURE 14 MARKET SIZE ESTIMATION METHODOLOGY (SUPPLY SIDE): CAGR PROJECTIONS FROM THE SUPPLY SIDE
FIGURE 15 MARKET SIZE ESTIMATION METHODOLOGY: APPROACH 2 (DEMAND SIDE): REVENUE GENERATED FROM COMPONENT (1/2)
2.4 MARKET FORECAST
TABLE 3 FACTOR ANALYSIS
2.5 LIMITATIONS OF THE STUDY
3 EXECUTIVE SUMMARY (Page No. - 46)
FIGURE 16 INNOVATION MANAGEMENT MARKET: GLOBAL SNAPSHOT, 20192026
FIGURE 17 TOP-GROWING SEGMENTS IN THE MARKET
FIGURE 18 SERVICES SEGMENT TO ACCOUNT FOR THE LARGER MARKET SIZE DURING THE FORECAST PERIOD
FIGURE 19 CONSULTING SERVICES TO ACCOUNT FOR THE LARGEST MARKET SIZE DURING THE FORECAST PERIOD
FIGURE 20 BUSINESS PROCESSES SEGMENT TO BE THE LARGER MARKET DURING THE FORECAST PERIOD
FIGURE 21 CLOUD SEGMENT TO ACCOUNT FOR THE LARGER MARKET SIZE DURING THE FORECAST PERIOD
FIGURE 22 LARGE ENTERPRISES SEGMENT TO ACCOUNT FOR A LARGER MARKET SIZE DURING THE FORECAST PERIOD
FIGURE 23 NORTH AMERICA TO ACCOUNT FOR THE LARGEST MARKET SIZE DURING THE FORECAST PERIOD
4 PREMIUM INSIGHTS (Page No. - 53)
4.1 ATTRACTIVE GROWTH OPPORTUNITIES IN THE INNOVATION MANAGEMENT MARKET
FIGURE 24 DRASTIC DEMOGRAPHIC CHANGE AND TECHNOLOGICAL EVOLUTION TO DRIVE THE INNOVATION MANAGEMENT GROWTH
4.2 MARKET, BY COMPONENT
FIGURE 25 SERVICES SEGMENT TO BE THE LARGER MARKET DURING THE FORECAST PERIOD
4.3 MARKET, BY DEPLOYMENT MODE
FIGURE 26 CLOUD TO BECOME THE LARGER MARKET BY 2026
4.4 MARKET, BY VERTICAL
FIGURE 27 IT AND TELECOM VERTICAL TO ACCOUNT FOR THE LARGEST MARKET SHARE DURING THE FORECAST PERIOD
4.5 MARKET INVESTMENT SCENARIO
FIGURE 28 ASIA PACIFIC TO EMERGE AS THE BEST MARKET FOR INVESTMENTS IN THE NEXT FIVE YEARS
5 MARKET OVERVIEW AND INDUSTRY TRENDS (Page No. - 56)
5.1 INTRODUCTION
5.2 MARKET DYNAMICS
FIGURE 29 DRIVERS, RESTRAINTS, OPPORTUNITIES, AND CHALLENGES: INNOVATION MANAGEMENT MARKET
5.2.1 DRIVERS
5.2.1.1 Increase in demand for crowdsourcing innovation across verticals
5.2.1.2 Changing work culture in enterprises
5.2.1.3 Growing focus of enterprises on the development of new, innovative, and personalized products
5.2.1.4 Increasing adoption of cloud-based innovation management solutions
5.2.2 RESTRAINTS
5.2.2.1 Inefficiency of enterprises to track reliable RoI from innovation management solutions
5.2.2.2 Mindset of leaders toward traditional approaches
5.2.3 OPPORTUNITIES
5.2.3.1 Impact of disruptive technologies to increase the adoption of innovation management solutions
FIGURE 30 ENTERPRISE INFORMATION TECHNOLOGY SPENDING, 20182025 (USD BILLION)
5.2.3.2 Emerging potential markets to provide high-growth opportunities
5.2.3.3 Increase in need to make informed decisions among enterprises
5.2.3.4 Rise in adoption of innovation management solutions by SMEs
5.2.4 CHALLENGES
5.2.4.1 Security and privacy concerns over enterprise information
FIGURE 31 MALWARE INFECTION, 20092018 (MILLION)
5.3 DEVELOPMENT OF INNOVATION
FIGURE 32 STANDARD STEPS FOR INNOVATION
5.4 CASE STUDY ANALYSIS
5.4.1 USE CASE 1: AUTOMOBILE
5.4.2 USE CASE 2: HEALTHCARE
5.4.3 USE CASE 3: SEMICONDUCTORS
5.5 REGULATORY POLICIES
5.5.1 INTRODUCTION
5.5.2 NORTH AMERICA
5.5.3 EUROPE
5.5.4 ASIA PACIFIC
5.5.5 MIDDLE EAST AND AFRICA
5.5.6 LATIN AMERICA
5.6 SUPPLY CHAIN ANALYSIS
FIGURE 33 SUPPLY CHAIN: INNOVATION MANAGEMENT MARKET
5.7 TECHNOLOGY ANALYSIS
5.8 PATENT ANALYSIS
FIGURE 34 NUMBER OF PATENTS PUBLISHED, 20112020
FIGURE 35 TOP FIVE GLOBAL PATENT OWNERS, 20112020
TABLE 4 US: TOP TEN PATENT OWNERS
5.9 ECOSYSTEM
FIGURE 36 MARKET: ECOSYSTEM
5.10 PORTERS FIVE FORCES ANALYSIS
FIGURE 37 MARKET: PORTERS FIVE FORCES ANALYSIS
TABLE 5 INNOVATION MANAGEMENT MARKET: PORTERS FIVE FORCES ANALYSIS
5.10.1 THREAT OF NEW ENTRANTS
5.10.2 THREAT OF SUBSTITUTES
5.10.3 BARGAINING POWER OF SUPPLIERS
5.10.4 BARGAINING POWER OF BUYERS
5.10.5 DEGREE OF COMPETITION
5.11 IMPACT OF COVID-19 ON THE INNOVATION MANAGEMENT MARKET
5.11.1 COVID-19-DRIVEN MARKET DYNAMICS DRIVERS AND OPPORTUNITIES
5.11.2 RESTRAINTS AND CHALLENGES
5.12 PRICING ANALYSIS
TABLE 6 PRICING ANALYSIS: MARKET
5.13 TRENDS/DISRUPTIONS IMPACTING BUYERS
FIGURE 38 MARKET: TRENDS/ DISRUPTIONS IMPACTING BUYERS
6 INNOVATION MANAGEMENT MARKET, BY COMPONENT (Page No. - 77)
6.1 INTRODUCTION
FIGURE 39 THE SERVICES SEGMENT TO GROW AT A HIGHER CAGR DURING THE FORECAST PERIOD
6.1.1 COMPONENT: MARKET DRIVERS
6.1.2 COMPONENT: COVID-19 IMPACT
TABLE 7 MARKET SIZE, BY COMPONENT, 20162020 (USD MILLION)
TABLE 8 MARKET SIZE, BY COMPONENT, 20212026 (USD MILLION)
TABLE 9 COMPONENT: MARKET SIZE, BY REGION, 20162020 (USD MILLION)
TABLE 10 COMPONENT: MARKET SIZE, BY REGION, 20212026 (USD MILLION)
6.2 SOLUTIONS
TABLE 11 SOLUTIONS: MARKET SIZE, BY REGION, 20162020 (USD MILLION)
TABLE 12 SOLUTIONS: MARKET SIZE, BY REGION, 20212026 (USD MILLION)
6.3 SERVICES
TABLE 13 SERVICES: MARKET SIZE, BY TYPE, 20162020 (USD MILLION)
TABLE 14 SERVICES: MARKET SIZE, BY TYPE, 20212026 (USD MILLION)
TABLE 15 SERVICES: MARKET SIZE, BY REGION, 20162020 (USD MILLION)
TABLE 16 SERVICES: INNOVATION MANAGEMENT MARKET SIZE, BY REGION, 20212026 (USD MILLION)
6.4 CONSULTING
TABLE 17 CONSULTING SERVICES: MARKET SIZE, BY REGION, 20162020 (USD MILLION)
TABLE 18 CONSULTING SERVICES: MARKET SIZE, BY REGION, 20212026 (USD MILLION)
6.5 SYSTEM INTEGRATION
TABLE 19 SYSTEM INTEGRATION SERVICES: MARKET SIZE, BY REGION, 20162020 (USD MILLION)
TABLE 20 SYSTEM INTEGRATION SERVICES: MARKET SIZE, BY REGION, 20212026 (USD MILLION)
6.6 TRAINING, SUPPORT, AND MAINTENANCE
TABLE 21 TRAINING, SUPPORT, AND MAINTENANCE SERVICES: MARKET SIZE, BY REGION, 20162020 (USD MILLION)
TABLE 22 TRAINING, SUPPORT, AND MAINTENANCE SERVICES: MARKET SIZE, BY REGION, 20212026 (USD MILLION)
7 INNOVATION MANAGEMENT MARKET, BY FUNCTION (Page No. - 86)
7.1 INTRODUCTION
FIGURE 40 BUSINESS PROCESSES TO GROW AT A HIGHER CAGR DURING THE FORECAST PERIOD
7.1.1 FUNCTION: MARKET DRIVERS
7.1.2 FUNCTION: COVID-19 IMPACT
TABLE 23 MARKET SIZE, BY FUNCTION, 20162020 (USD MILLION)
TABLE 24 MARKET SIZE, BY FUNCTION, 20212026 (USD MILLION)
7.2 PRODUCT DEVELOPMENT
TABLE 25 PRODUCT DEVELOPMENT: MARKET SIZE, BY REGION, 20162020 (USD MILLION)
TABLE 26 PRODUCT DEVELOPMENT: MARKET SIZE, BY REGION, 20212026 (USD MILLION)
7.3 BUSINESS PROCESSES
TABLE 27 BUSINESS PROCESSES: MARKET SIZE, BY REGION, 20162020 (USD MILLION)
TABLE 28 BUSINESS PROCESSES: MARKET SIZE, BY REGION, 20212026 (USD MILLION)
8 INNOVATION MANAGEMENT MARKET, BY DEPLOYMENT MODE (Page No. - 91)
8.1 INTRODUCTION
FIGURE 41 CLOUD DEPLOYMENT TO GROW AT A HIGHER CAGR DURING THE FORECAST PERIOD
8.1.1 DEPLOYMENT MODE: MARKET DRIVERS
8.1.2 DEPLOYMENT MODE: COVID-19 IMPACT
TABLE 29 MARKET SIZE, BY DEPLOYMENT MODE, 20162020 (USD MILLION)
TABLE 30 MARKET SIZE, BY DEPLOYMENT MODE, 20212026 (USD MILLION)
8.2 ON-PREMISES
TABLE 31 ON-PREMISES: MARKET SIZE, BY REGION, 20162020 (USD MILLION)
TABLE 32 ON-PREMISES: MARKET SIZE, BY REGION, 20212026 (USD MILLION)
8.3 CLOUD
TABLE 33 CLOUD: MARKET SIZE, BY REGION, 20162020 (USD MILLION)
TABLE 34 CLOUD: MARKET SIZE, BY REGION, 20212026 (USD MILLION)
9 INNOVATION MANAGEMENT MARKET, BY ORGANIZATION SIZE (Page No. - 96)
9.1 INTRODUCTION
FIGURE 42 LARGE ENTERPRISES SEGMENT TO GROW AT A HIGHER CAGR DURING THE FORECAST PERIOD
9.1.1 ORGANIZATION SIZE: MARKET DRIVERS
9.1.2 ORGANIZATION SIZE: COVID-19 IMPACT
TABLE 35 MARKET SIZE, BY ORGANIZATION SIZE, 20162020 (USD MILLION)
TABLE 36 MARKET SIZE, BY ORGANIZATION SIZE, 20212026 (USD MILLION)
9.2 LARGE ENTERPRISES
TABLE 37 LARGE ENTERPRISES: MARKET SIZE, BY REGION, 20162020 (USD MILLION)
TABLE 38 LARGE ENTERPRISES: MARKET SIZE, BY REGION, 20212026 (USD MILLION)
9.3 SMALL AND MEDIUM ENTERPRISES
TABLE 39 SMALL AND MEDIUM-SIZED ENTERPRISES: MARKET SIZE, BY REGION, 20162020 (USD MILLION)
TABLE 40 SMALL AND MEDIUM-SIZED ENTERPRISES: MARKET SIZE, BY REGION, 20212026 (USD MILLION)
10 INNOVATION MANAGEMENT MARKET, BY VERTICAL (Page No. - 101)
10.1 INTRODUCTION
FIGURE 43 INFORMATION TECHNOLOGY AND TELECOMMUNICATIONS SEGMENT TO ACCOUNT FOR THE HIGHEST MARKET SHARE DURING THE FORECAST PERIOD
10.1.1 VERTICAL: MARKET DRIVERS
10.1.2 VERTICALS: COVID-19 IMPACT
TABLE 41 MARKET SIZE, BY VERTICAL, 20162020 (USD MILLION)
TABLE 42 MARKET SIZE, BY VERTICAL, 20212026 (USD MILLION)
10.2 BANKING, FINANCIAL SERVICES, AND INSURANCE
TABLE 43 BANKING, FINANCIAL SERVICES, AND INSURANCE: MARKET SIZE, BY REGION, 20162020 (USD MILLION)
TABLE 44 BANKING, FINANCIAL SERVICES, AND INSURANCE: MARKET SIZE, BY REGION, 20212026 (USD MILLION)
10.3 AEROSPACE AND DEFENSE
TABLE 45 AEROSPACE AND DEFENSE: INNOVATION MANAGEMENT MARKET SIZE, BY REGION, 20162020 (USD MILLION)
TABLE 46 AEROSPACE AND DEFENSE: MARKET SIZE, BY REGION, 20212026 (USD MILLION)
10.4 HEALTHCARE AND PHARMACEUTICALS
TABLE 47 HEALTHCARE AND PHARMACEUTICALS: MARKET SIZE, BY REGION, 20162020 (USD MILLION)
TABLE 48 HEALTHCARE AND PHARMACEUTICALS: MARKET SIZE, BY REGION, 20212026 (USD MILLION)
10.5 RETAIL AND ECOMMERCE
TABLE 49 RETAIL AND ECOMMERCE: MARKET SIZE, BY REGION, 20162020 (USD MILLION)
TABLE 50 RETAIL AND ECOMMERCE: MARKET SIZE, BY REGION, 20212026 (USD MILLION)
10.6 INFORMATION TECHNOLOGY AND TELECOMMUNICATIONS
TABLE 51 INFORMATION TECHNOLOGY AND TELECOMMUNICATIONS: MARKET SIZE, BY REGION, 20162020 (USD MILLION)
TABLE 52 INFORMATION TECHNOLOGY AND TELECOMMUNICATIONS: MARKET SIZE, BY REGION, 20212026 (USD MILLION)
10.7 GOVERNMENT
TABLE 53 GOVERNMENT: INNOVATION MANAGEMENT MARKET SIZE, BY REGION, 20162020 (USD MILLION)
TABLE 54 GOVERNMENT: MARKET SIZE, BY REGION, 20212026 (USD MILLION)
10.8 MANUFACTURING
TABLE 55 MANUFACTURING: MARKET SIZE, BY REGION, 20162020 (USD MILLION)
TABLE 56 MANUFACTURING: MARKET SIZE, BY REGION, 20212026 (USD MILLION)
10.9 TRANSPORTATION AND LOGISTICS
TABLE 57 TRANSPORTATION AND LOGISTICS: MARKET SIZE, BY REGION, 20162020 (USD MILLION)
TABLE 58 TRANSPORTATION AND LOGISTICS: MARKET SIZE, BY REGION, 20212026 (USD MILLION)
10.10 OTHER VERTICALS
TABLE 59 OTHER VERTICALS: MARKET SIZE, BY REGION, 20162020 (USD MILLION)
TABLE 60 OTHER VERTICALS: MARKET SIZE, BY REGION, 20212026 (USD MILLION)
11 INNOVATION MANAGEMENT MARKET, BY REGION (Page No. - 114)
11.1 INTRODUCTION
FIGURE 44 NORTH AMERICA TO ACCOUNT FOR THE LARGEST MARKET SIZE DURING THE FORECAST PERIOD
TABLE 61 MARKET SIZE, BY REGION, 20162020 (USD MILLION)
TABLE 62 MARKET SIZE, BY REGION, 20212026 (USD MILLION)
11.2 NORTH AMERICA
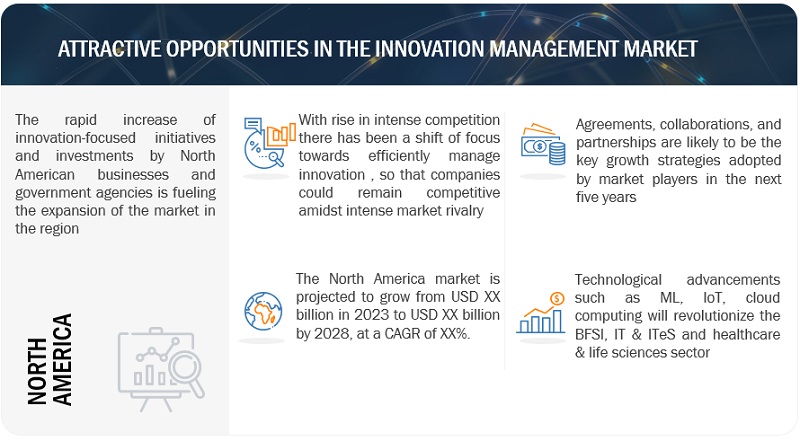
11.2.1 NORTH AMERICA: MARKET DRIVERS
11.2.2 NORTH AMERICA: COVID-19 IMPACT
FIGURE 45 NORTH AMERICA: MARKET SNAPSHOT
TABLE 63 NORTH AMERICA: INNOVATION MANAGEMENT MARKET SIZE, BY COMPONENT, 20162020 (USD MILLION)
TABLE 64 NORTH AMERICA: MARKET SIZE, BY COMPONENT, 20212026 (USD MILLION)
TABLE 65 NORTH AMERICA: MARKET SIZE, BY SERVICE, 20162020 (USD MILLION)
TABLE 66 NORTH AMERICA: MARKET SIZE, BY SERVICE, 20212026 (USD MILLION)
TABLE 67 NORTH AMERICA: MARKET SIZE, BY FUNCTION, 20162020 (USD MILLION)
TABLE 68 NORTH AMERICA: MARKET SIZE, BY FUNCTION, 20212026 (USD MILLION)
TABLE 69 NORTH AMERICA: MARKET SIZE, BY ORGANIZATION SIZE, 20162020 (USD MILLION)
TABLE 70 NORTH AMERICA: MARKET SIZE, BY ORGANIZATION SIZE, 20212026 (USD MILLION)
TABLE 71 NORTH AMERICA: MARKET SIZE, BY DEPLOYMENT MODE, 20162020 (USD MILLION)
TABLE 72 NORTH AMERICA: MARKET SIZE, BY DEPLOYMENT MODE, 20212026 (USD MILLION)
TABLE 73 NORTH AMERICA: MARKET SIZE, BY VERTICAL, 20162020 (USD MILLION)
TABLE 74 NORTH AMERICA: MARKET SIZE, BY VERTICAL, 20212026 (USD MILLION)
TABLE 75 NORTH AMERICA: MARKET SIZE, BY COUNTRY, 20162020 (USD MILLION)
TABLE 76 NORTH AMERICA: MARKET SIZE, BY COUNTRY, 20212026 (USD MILLION)
11.2.3 UNITED STATES
TABLE 77 UNITED STATES: INNOVATION MANAGEMENT MARKET SIZE, BY ORGANIZATION SIZE, 20162020 (USD MILLION)
TABLE 78 UNITED STATES: MARKET SIZE, BY ORGANIZATION SIZE, 20212026 (USD MILLION)
TABLE 79 UNITED STATES: MARKET SIZE, BY DEPLOYMENT MODE, 20162020 (USD MILLION)
TABLE 80 UNITED STATES: MARKET SIZE, BY DEPLOYMENT MODE, 20212026 (USD MILLION)
11.2.4 CANADA
TABLE 81 CANADA: MARKET SIZE, BY ORGANIZATION SIZE, 20162020 (USD MILLION)
TABLE 82 CANADA: MARKET SIZE, BY ORGANIZATION SIZE, 20212026 (USD MILLION)
TABLE 83 CANADA: MARKET SIZE, BY DEPLOYMENT MODE, 20162020 (USD MILLION)
TABLE 84 CANADA: MARKET SIZE, BY DEPLOYMENT MODE, 20212026 (USD MILLION)
11.3 EUROPE
11.3.1 EUROPE: INNOVATION MANAGEMENT MARKET DRIVERS
11.3.2 EUROPE: COVID-19 IMPACT
TABLE 85 EUROPE: MARKET SIZE, BY COMPONENT, 20162020 (USD MILLION)
TABLE 86 EUROPE: MARKET SIZE, BY COMPONENT, 20212026 (USD MILLION)
TABLE 87 EUROPE: MARKET SIZE, BY SERVICE, 20162020 (USD MILLION)
TABLE 88 EUROPE: MARKET SIZE, BY SERVICE, 20212026 (USD MILLION)
TABLE 89 EUROPE: MARKET SIZE, BY FUNCTION, 20162020 (USD MILLION)
TABLE 90 EUROPE: MARKET SIZE, BY FUNCTION, 20212026 (USD MILLION)
TABLE 91 EUROPE: MARKET SIZE, BY ORGANIZATION SIZE, 20162020 (USD MILLION)
TABLE 92 EUROPE: MARKET SIZE, BY ORGANIZATION SIZE, 20212026 (USD MILLION)
TABLE 93 EUROPE: MARKET SIZE, BY DEPLOYMENT MODE, 20162020 (USD MILLION)
TABLE 94 EUROPE: MARKET SIZE, BY DEPLOYMENT MODE, 20212026 (USD MILLION)
TABLE 95 EUROPE: MARKET SIZE, BY VERTICAL, 20162020 (USD MILLION)
TABLE 96 EUROPE: MARKET SIZE, BY VERTICAL, 20212026 (USD MILLION)
TABLE 97 EUROPE: MARKET SIZE, BY COUNTRY, 20162020 (USD MILLION)
TABLE 98 EUROPE: MARKET SIZE, BY COUNTRY, 20212026 (USD MILLION)
11.3.3 UNITED KINGDOM
TABLE 99 UNITED KINGDOM: INNOVATION MANAGEMENT MARKET SIZE, BY ORGANIZATION SIZE, 20162020 (USD MILLION)
TABLE 100 UNITED KINGDOM: MARKET SIZE, BY ORGANIZATION SIZE, 20212026 (USD MILLION)
TABLE 101 UNITED KINGDOM: MARKET SIZE, BY DEPLOYMENT MODE, 20162020 (USD MILLION)
TABLE 102 UNITED KINGDOM: MARKET SIZE, BY DEPLOYMENT MODE, 20212026 (USD MILLION)
11.3.4 GERMANY
TABLE 103 GERMANY: MARKET SIZE, BY ORGANIZATION SIZE, 20162020 (USD MILLION)
TABLE 104 GERMANY: MARKET SIZE, BY ORGANIZATION SIZE, 20212026 (USD MILLION)
TABLE 105 GERMANY: MARKET SIZE, BY DEPLOYMENT MODE, 20162020 (USD MILLION)
TABLE 106 GERMANY: MARKET SIZE, BY DEPLOYMENT MODE, 20212026 (USD MILLION)
11.3.5 FRANCE
TABLE 107 FRANCE: INNOVATION MANAGEMENT MARKET SIZE, BY ORGANIZATION SIZE, 20162020 (USD MILLION)
TABLE 108 FRANCE: MARKET SIZE, BY ORGANIZATION SIZE, 20212026 (USD MILLION)
TABLE 109 FRANCE: MARKET SIZE, BY DEPLOYMENT MODE, 20162020 (USD MILLION)
TABLE 110 FRANCE: MARKET SIZE, BY DEPLOYMENT MODE, 20212026 (USD MILLION)
11.3.6 REST OF EUROPE
TABLE 111 REST OF EUROPE: MARKET SIZE, BY ORGANIZATION SIZE, 20162020 (USD MILLION)
TABLE 112 REST OF EUROPE: MARKET SIZE, BY ORGANIZATION SIZE, 20212026 (USD MILLION)
TABLE 113 REST OF EUROPE: MARKET SIZE, BY DEPLOYMENT MODE, 20162020 (USD MILLION)
TABLE 114 REST OF EUROPE: MARKET SIZE, BY DEPLOYMENT MODE, 20212026 (USD MILLION)
11.4 ASIA PACIFIC
11.4.1 ASIA PACIFIC: INNOVATION MANAGEMENT MARKET DRIVERS
11.4.2 ASIA PACIFIC: COVID-19 IMPACT
FIGURE 46 ASIA PACIFIC: MARKET SNAPSHOT
TABLE 115 ASIA PACIFIC: MARKET SIZE, BY COMPONENT, 20162020 (USD MILLION)
TABLE 116 ASIA PACIFIC: MARKET SIZE, BY COMPONENT, 20212026 (USD MILLION)
TABLE 117 ASIA PACIFIC: MARKET SIZE, BY SERVICE, 20162020 (USD MILLION)
TABLE 118 ASIA PACIFIC: MARKET SIZE, BY SERVICE, 20212026 (USD MILLION)
TABLE 119 ASIA PACIFIC: MARKET SIZE, BY FUNCTION, 20162020 (USD MILLION)
TABLE 120 ASIA PACIFIC: MARKET SIZE, BY FUNCTION, 20212026 (USD MILLION)
TABLE 121 ASIA PACIFIC: MARKET SIZE, BY ORGANIZATION SIZE, 20162020 (USD MILLION)
TABLE 122 ASIA PACIFIC: MARKET SIZE, BY ORGANIZATION SIZE, 20212026 (USD MILLION)
TABLE 123 ASIA PACIFIC: MARKET SIZE, BY DEPLOYMENT MODE, 20162020 (USD MILLION)
TABLE 124 ASIA PACIFIC: MARKET SIZE, BY DEPLOYMENT MODE, 20212026 (USD MILLION)
TABLE 125 ASIA PACIFIC: MARKET SIZE, BY VERTICAL, 20162020 (USD MILLION)
TABLE 126 ASIA PACIFIC: MARKET SIZE, BY VERTICAL, 20212026 (USD MILLION)
TABLE 127 ASIA PACIFIC: MARKET SIZE, BY COUNTRY, 20162020 (USD MILLION)
TABLE 128 ASIA PACIFIC: MARKET SIZE, BY COUNTRY, 20212026 (USD MILLION)
11.4.3 CHINA
TABLE 129 CHINA: INNOVATION MANAGEMENT MARKET SIZE, BY ORGANIZATION SIZE, 20162020 (USD MILLION)
TABLE 130 CHINA: MARKET SIZE, BY ORGANIZATION SIZE, 20212026 (USD MILLION)
TABLE 131 CHINA: MARKET SIZE, BY DEPLOYMENT MODE, 20162020 (USD MILLION)
TABLE 132 CHINA: MARKET SIZE, BY DEPLOYMENT MODE, 20212026 (USD MILLION)
11.4.4 JAPAN
TABLE 133 JAPAN: MARKET SIZE, BY ORGANIZATION SIZE, 20162020 (USD MILLION)
TABLE 134 JAPAN: MARKET SIZE, BY ORGANIZATION SIZE, 20212026 (USD MILLION)
TABLE 135 JAPAN: MARKET SIZE, BY DEPLOYMENT MODE, 20162020 (USD MILLION)
TABLE 136 JAPAN: MARKET SIZE, BY DEPLOYMENT MODE, 20212026 (USD MILLION)
11.4.5 INDIA
TABLE 137 INDIA: INNOVATION MANAGEMENT MARKET SIZE, BY ORGANIZATION SIZE, 20162020 (USD MILLION)
TABLE 138 INDIA: MARKET SIZE, BY ORGANIZATION SIZE, 20212026 (USD MILLION)
TABLE 139 INDIA: MARKET SIZE, BY DEPLOYMENT MODE, 20162020 (USD MILLION)
TABLE 140 INDIA: MARKET SIZE, BY DEPLOYMENT MODE, 20212026 (USD MILLION)
11.4.6 REST OF ASIA PACIFIC
TABLE 141 REST OF ASIA PACIFIC: MARKET SIZE, BY ORGANIZATION SIZE, 20162020 (USD MILLION)
TABLE 142 REST OF ASIA PACIFIC: MARKET SIZE, BY ORGANIZATION SIZE, 20212026 (USD MILLION)
TABLE 143 REST OF ASIA PACIFIC: MARKET SIZE, BY DEPLOYMENT MODE, 20162020 (USD MILLION)
TABLE 144 REST OF ASIA PACIFIC: MARKET SIZE, BY DEPLOYMENT MODE, 20212026 (USD MILLION)
11.5 MIDDLE EAST AND AFRICA
11.5.1 MIDDLE EAST AND AFRICA: INNOVATION MANAGEMENT MARKET DRIVERS
11.5.2 MIDDLE EAST AND AFRICA: COVID-19 IMPACT
TABLE 145 MIDDLE EAST AND AFRICA: MARKET SIZE, BY COMPONENT, 20162020 (USD MILLION)
TABLE 146 MIDDLE EAST AND AFRICA: MARKET SIZE, BY COMPONENT, 20212026 (USD MILLION)
TABLE 147 MIDDLE EAST AND AFRICA: MARKET SIZE, BY SERVICE, 20162020 (USD MILLION)
TABLE 148 MIDDLE EAST AND AFRICA: MARKET SIZE, BY SERVICE, 20212026 (USD MILLION)
TABLE 149 MIDDLE EAST AND AFRICA: MARKET SIZE, BY FUNCTION, 20162020 (USD MILLION)
TABLE 150 MIDDLE EAST AND AFRICA: MARKET SIZE, BY FUNCTION, 20212026 (USD MILLION)
TABLE 151 MIDDLE EAST AND AFRICA: MARKET SIZE, BY ORGANIZATION SIZE, 20162020 (USD MILLION)
TABLE 152 MIDDLE EAST AND AFRICA: MARKET SIZE, BY ORGANIZATION SIZE, 20212026 (USD MILLION)
TABLE 153 MIDDLE EAST AND AFRICA: MARKET SIZE, BY DEPLOYMENT MODE, 20162020 (USD MILLION)
TABLE 154 MIDDLE EAST AND AFRICA: MARKET SIZE, BY DEPLOYMENT MODE, 20212026 (USD MILLION)
TABLE 155 MIDDLE EAST AND AFRICA: MARKET SIZE, BY VERTICAL, 20162020 (USD MILLION)
TABLE 156 MIDDLE EAST AND AFRICA: MARKET SIZE, BY VERTICAL, 20212026 (USD MILLION)
TABLE 157 MIDDLE EAST AND AFRICA: MARKET SIZE, BY COUNTRY, 20162020 (USD MILLION)
TABLE 158 MIDDLE EAST AND AFRICA: MARKET SIZE, BY COUNTRY, 20212026 (USD MILLION)
11.5.3 ISRAEL
TABLE 159 ISRAEL: INNOVATION MANAGEMENT MARKET SIZE, BY ORGANIZATION SIZE, 20162020 (USD MILLION)
TABLE 160 ISRAEL: MARKET SIZE, BY ORGANIZATION SIZE, 20212026 (USD MILLION)
TABLE 161 ISRAEL: MARKET SIZE, BY DEPLOYMENT MODE, 20162020 (USD MILLION)
TABLE 162 ISRAEL: MARKET SIZE, BY DEPLOYMENT MODE, 20212026 (USD MILLION)
11.5.4 UNITED ARAB EMIRATES
TABLE 163 UNITED ARAB EMIRATES: MARKET SIZE, BY ORGANIZATION SIZE, 20162020 (USD MILLION)
TABLE 164 UNITED ARAB EMIRATES: MARKET SIZE, BY ORGANIZATION SIZE, 20212026 (USD MILLION)
TABLE 165 UNITED ARAB EMIRATES: MARKET SIZE, BY DEPLOYMENT MODE, 20162020 (USD MILLION)
TABLE 166 UNITED ARAB EMIRATES: MARKET SIZE, BY DEPLOYMENT MODE, 20212026 (USD MILLION)
11.5.5 REST OF THE MIDDLE EAST AND AFRICA
TABLE 167 REST OF THE MIDDLE EAST AND AFRICA: INNOVATION MANAGEMENT MARKET SIZE, BY ORGANIZATION SIZE, 20162020 (USD MILLION)
TABLE 168 REST OF THE MIDDLE EAST AND AFRICA: MARKET SIZE, BY ORGANIZATION SIZE, 20212026 (USD MILLION)
TABLE 169 REST OF THE MIDDLE EAST AND AFRICA: MARKET SIZE, BY DEPLOYMENT MODE, 20162020 (USD MILLION)
TABLE 170 REST OF THE MIDDLE EAST AND AFRICA: MARKET SIZE, BY DEPLOYMENT MODE, 20212026 (USD MILLION)
11.6 LATIN AMERICA
11.6.1 LATIN AMERICA: MARKET DRIVERS
11.6.2 LATIN AMERICA: COVID-19 IMPACT
TABLE 171 LATIN AMERICA: INNOVATION MANAGEMENT MARKET SIZE, BY COMPONENT, 20162020 (USD MILLION)
TABLE 172 LATIN AMERICA: MARKET SIZE, BY COMPONENT, 20212026 (USD MILLION)
TABLE 173 LATIN AMERICA: MARKET SIZE, BY SERVICE, 20162020 (USD MILLION)
TABLE 174 LATIN AMERICA: MARKET SIZE, BY SERVICE, 20212026 (USD MILLION)
TABLE 175 LATIN AMERICA: MARKET SIZE, BY FUNCTION, 20162020 (USD MILLION)
TABLE 176 LATIN AMERICA: MARKET SIZE, BY FUNCTION, 20212026 (USD MILLION)
TABLE 177 LATIN AMERICA: MARKET SIZE, BY ORGANIZATION SIZE, 20162020 (USD MILLION)
TABLE 178 LATIN AMERICA: MARKET SIZE, BY ORGANIZATION SIZE, 20212026 (USD MILLION)
TABLE 179 LATIN AMERICA: MARKET SIZE, BY DEPLOYMENT MODE, 20162020 (USD MILLION)
TABLE 180 LATIN AMERICA: MARKET SIZE, BY DEPLOYMENT MODE, 20212026 (USD MILLION)
TABLE 181 LATIN AMERICA: MARKET SIZE, BY VERTICAL, 20162020 (USD MILLION)
TABLE 182 LATIN AMERICA: MARKET SIZE, BY VERTICAL, 20212026 (USD MILLION)
TABLE 183 LATIN AMERICA: MARKET SIZE, BY COUNTRY, 20162020 (USD MILLION)
TABLE 184 LATIN AMERICA: MARKET SIZE, BY COUNTRY, 20212026 (USD MILLION)
11.6.3 BRAZIL
TABLE 185 BRAZIL: INNOVATION MANAGEMENT MARKET SIZE, BY ORGANIZATION SIZE, 20162020 (USD MILLION)
TABLE 186 BRAZIL: MARKET SIZE, BY ORGANIZATION SIZE, 20212026 (USD MILLION)
TABLE 187 BRAZIL: MARKET SIZE, BY DEPLOYMENT MODE, 20162020 (USD MILLION)
TABLE 188 BRAZIL: MARKET SIZE, BY DEPLOYMENT MODE, 20212026 (USD MILLION)
11.6.4 MEXICO
TABLE 189 MEXICO: MARKET SIZE, BY ORGANIZATION SIZE, 20162020 (USD MILLION)
TABLE 190 MEXICO: MARKET SIZE, BY ORGANIZATION SIZE, 20212026 (USD MILLION)
TABLE 191 MEXICO: MARKET SIZE, BY DEPLOYMENT MODE, 20162020 (USD MILLION)
TABLE 192 MEXICO: MARKET SIZE, BY DEPLOYMENT MODE, 20212026 (USD MILLION)
11.6.5 REST OF LATIN AMERICA
TABLE 193 REST OF LATIN AMERICA: INNOVATION MANAGEMENT MARKET SIZE, BY ORGANIZATION SIZE, 20162020 (USD MILLION)
TABLE 194 REST OF LATIN AMERICA: MARKET SIZE, BY ORGANIZATION SIZE, 20212026 (USD MILLION)
TABLE 195 REST OF LATIN AMERICA: MARKET SIZE, BY DEPLOYMENT MODE, 20162020 (USD MILLION)
TABLE 196 REST OF LATIN AMERICA: MARKET SIZE, BY DEPLOYMENT MODE, 20212026 (USD MILLION)
12 COMPETITIVE LANDSCAPE (Page No. - 165)
12.1 INTRODUCTION
FIGURE 47 MARKET EVALUATION FRAMEWORK
12.2 MARKET RANKING
FIGURE 48 MARKET RANKING IN 2020
12.3 MARKET SHARE OF TOP VENDORS
TABLE 197 INNOVATION MANAGEMENT: DEGREE OF COMPETITION
FIGURE 49 INNOVATION MANAGEMENT MARKET: VENDOR SHARE ANALYSIS
12.4 HISTORICAL REVENUE ANALYSIS OF TOP VENDORS
FIGURE 50 HISTORICAL REVENUE ANALYSIS
12.5 COMPANY EVALUATION QUADRANT
FIGURE 51 COMPANY EVALUATION MATRIX: CRITERIA WEIGHTAGE
12.5.1 STARS
12.5.2 EMERGING LEADERS
12.5.3 PERVASIVE PLAYERS
12.5.4 PARTICIPANTS
FIGURE 52 INNOVATION MANAGEMENT MARKET: COMPANY EVALUATION MATRIX
TABLE 198 COMPANY FOOTPRINT
TABLE 199 COMPANY VERTICAL FOOTPRINT
TABLE 200 COMPANY REGION FOOTPRINT
12.6 STARTUP/SME EVALUATION QUADRANT
FIGURE 53 STARTUP/SME EVALUATION MATRIX: CRITERIA WEIGHTAGE
12.6.1 RESPONSIVE VENDORS
12.6.2 PROGRESSIVE VENDORS
12.6.3 DYNAMIC VENDORS
12.6.4 STARTING BLOCKS
FIGURE 54 MARKET: STARTUP/SME EVALUATION MATRIX
12.7 COMPETITIVE SCENARIO
TABLE 201 INNOVATION MANAGEMENT MARKET: NEW LAUNCHES, 20182021
TABLE 202 MARKET: DEALS, 20182021
TABLE 203 MARKET: OTHERS, 20182020
13 COMPANY PROFILES (Page No. - 180)
13.1 MAJOR PLAYERS
(Business Overview, Products, Solutions & Services, Key Insights, Recent Developments, MnM View)*
13.1.1 ACCENTURE
TABLE 204 ACCENTURE: BUSINESS OVERVIEW
FIGURE 55 ACCENTURE: COMPANY SNAPSHOT
TABLE 205 ACCENTURE: SERVICES OFFERED
TABLE 206 ACCENTURE: MARKET: DEALS
TABLE 207 ACCENTURE: INNOVATION MANAGEMENT MARKET: OTHERS
13.1.2 SAP SE
TABLE 208 SAP SE: BUSINESS OVERVIEW
FIGURE 56 SAP SE: COMPANY SNAPSHOT
TABLE 209 SAP SE: PRODUCTS OFFERED
13.1.3 SOPHEON
TABLE 210 SOPHEON: BUSINESS OVERVIEW
FIGURE 57 SOPHEON: COMPANY SNAPSHOT
TABLE 211 SOPHEON: PRODUCTS OFFERED
TABLE 212 SOPHEON: MARKET: SERVICE LAUNCHES & ENHANCEMENTS
TABLE 213 SOPHEON: MARKET: DEALS
13.1.4 PLANVIEW
TABLE 214 PLANVIEW: BUSINESS OVERVIEW
TABLE 215 PLANVIEW: PRODUCTS OFFERED
TABLE 216 PLANVIEW: INNOVATION MANAGEMENT MARKET: SERVICE LAUNCHES & ENHANCEMENTS
TABLE 217 PLANVIEW: MARKET: DEALS
13.1.5 QMARKETS
TABLE 218 QMARKETS: BUSINESS OVERVIEW
TABLE 219 QMARKETS: PRODUCTS OFFERED
TABLE 220 QMARKETS: MARKET:PRODUCT LAUNCHES & ENHANCEMENTS
TABLE 221 QMARKETS: MARKET: DEALS
13.1.6 BRIGHTIDEA
TABLE 222 BRIGHTIDEA: BUSINESS OVERVIEW
TABLE 223 BRIGHTIDEA: PRODUCTS OFFERED
TABLE 224 BRIGHTIDEA: INNOVATION MANAGEMENT MARKET: PRODUCT LAUNCHES & ENHANCEMENTS
TABLE 225 BRIGHTIDEA: MARKET: DEALS
13.1.7 PLANBOX
TABLE 226 PLANBOX: BUSINESS OVERVIEW
TABLE 227 PLANBOX: SOLUTIONS AND SERVICES OFFERED
TABLE 228 PLANBOX: MARKET: PRODUCT LAUNCHES & ENHANCEMENTS
TABLE 229 PLANBOX: MARKET: DEALS
13.1.8 HYPE
TABLE 230 HYPE: BUSINESS OVERVIEW
TABLE 231 HYPE: PRODUCTS OFFERED
TABLE 232 HYPE: MARKET: DEALS
TABLE 233 HYPE: INNOVATION MANAGEMENT MARKET: OTHERS
13.1.9 IDEASCALE
TABLE 234 IDEASCALE: BUSINESS OVERVIEW
TABLE 235 IDEASCALE: PRODUCTS OFFERED
TABLE 236 IDEASCALE: MARKET: PRODUCT LAUNCHES
TABLE 237 IDEASCALE: MARKET: DEALS
13.1.10 INNOSABI
TABLE 238 INNOSABI: BUSINESS OVERVIEW
TABLE 239 INNOSABI: PRODUCTS OFFERED
TABLE 240 INNOSABI: MARKET: PRODUCT LAUNCHES
TABLE 241 INNOSABI: INNOVATION MANAGEMENT MARKET: DEALS
13.1.11 VIIMA
13.1.12 EXAGO
13.1.13 KPMG
13.1.14 INNOVATIONCAST
13.1.15 NOSCO
13.1.16 SALESFORCE
13.1.17 INNOCENTIVE
13.1.18 MEDALLIA
13.1.19 EY
13.1.20 DELOITTE
13.1.21 BOSTON CONSULTING GROUP
*Details on Business Overview, Solutions, Products & Services, Key Insights, Recent Developments, MnM View might not be captured in case of unlisted companies.
13.2 STARTUP/SMES
13.2.1 IDEA DROP
13.2.2 INNO360
13.2.3 ITONICS
13.2.4 REVER
13.2.5 INDUCT
13.2.6 SIDEWAYS 6
13.2.7 YAMBLA
13.2.8 IDEAWAKE
13.2.9 LOOPEDIN
13.2.10 MIRO
14 ADJACENT/RELATED MARKETS (Page No. - 218)
14.1 INTRODUCTION
14.1.1 RELATED MARKET
14.1.2 LIMITATIONS
14.2 DIGITAL ASSET MANAGEMENT MARKET
TABLE 242 DIGITAL ASSET MANAGEMENT MARKET SIZE, BY VERTICAL, 20162019 (USD MILLION)
TABLE 243 DIGITAL ASSET MANAGEMENT MARKET SIZE, BY VERTICAL, 20202025 (USD MILLION)
TABLE 244 RETAIL AND ECOMMERCE: DIGITAL ASSET MANAGEMENT MARKET SIZE, BY REGION, 20162019 (USD MILLION)
TABLE 245 RETAIL AND ECOMMERCE: DIGITAL ASSET MANAGEMENT MARKET SIZE, BY REGION, 20202025 (USD MILLION)
TABLE 246 BANKING, FINANCIAL SERVICES, AND INSURANCE: DIGITAL ASSET MANAGEMENT MARKET SIZE, BY REGION, 20162019 (USD MILLION)
TABLE 247 BANKING, FINANCIAL SERVICES, AND INSURANCE: DIGITAL ASSET MANAGEMENT MARKET SIZE, BY REGION, 20202025 (USD MILLION)
TABLE 248 MANUFACTURING: DIGITAL ASSET MANAGEMENT MARKET SIZE, BY REGION, 20162019 (USD MILLION)
TABLE 249 MANUFACTURING: DIGITAL ASSET MANAGEMENT MARKET SIZE, BY REGION, 20202025 (USD MILLION)
TABLE 250 IT AND TELECOM: DIGITAL ASSET MANAGEMENT MARKET SIZE, BY REGION, 20162019 (USD MILLION)
TABLE 251 IT AND TELECOM: DIGITAL ASSET MANAGEMENT MARKET SIZE, BY REGION, 20202025 (USD MILLION)
TABLE 252 MEDIA AND ENTERTAINMENT: DIGITAL ASSET MANAGEMENT MARKET SIZE, BY REGION, 20162019 (USD MILLION)
TABLE 253 MEDIA AND ENTERTAINMENT: DIGITAL ASSET MANAGEMENT MARKET SIZE, BY REGION, 20202025 (USD MILLION)
TABLE 254 GOVERNMENT AND PUBLIC SECTOR: DIGITAL ASSET MANAGEMENT MARKET SIZE, BY REGION, 20162019 (USD MILLION)
TABLE 255 GOVERNMENT AND PUBLIC SECTOR: DIGITAL ASSET MANAGEMENT MARKET SIZE, BY REGION, 20202025 (USD MILLION)
TABLE 256 TRAVEL AND HOSPITALITY: DIGITAL ASSET MANAGEMENT MARKET SIZE, BY REGION, 20162019 (USD MILLION)
TABLE 257 TRAVEL AND HOSPITALITY: DIGITAL ASSET MANAGEMENT MARKET SIZE, BY REGION, 20202025 (USD MILLION)
TABLE 258 HEALTHCARE: DIGITAL ASSET MANAGEMENT MARKET SIZE, BY REGION, 20162019 (USD MILLION)
TABLE 259 HEALTHCARE: DIGITAL ASSET MANAGEMENT MARKET SIZE, BY REGION, 20202025 (USD MILLION)
TABLE 260 OTHER VERTICALS: DIGITAL ASSET MANAGEMENT MARKET SIZE, BY REGION, 20162019 (USD MILLION)
TABLE 261 OTHER VERTICALS: DIGITAL ASSET MANAGEMENT MARKET SIZE, BY REGION, 20202025 (USD MILLION)
15 APPENDIX (Page No. - 226)
15.1 DISCUSSION GUIDE
15.2 KNOWLEDGE STORE: MARKETSANDMARKETS SUBSCRIPTION PORTAL
15.3 AVAILABLE CUSTOMIZATIONS
15.4 RELATED REPORTS
15.5 AUTHOR DETAILS
The study involved 4 major activities to estimate the current market size of innovation management. Exhaustive secondary research was done to collect information on the market, the peer market, and the parent market. The next step was to validate these findings, assumptions, and sizing with industry experts across the value chain through primary research. Both top-down and bottom-up approaches were employed to estimate the complete market size. After that, the market breakup and data triangulation procedures were used to estimate the market size of the segments and subsegments.
Secondary Research
In the secondary research process, various secondary sources were referred to for identifying and collecting information for this study. The secondary sources included annual reports, press releases, and investor presentations of companies; whitepapers; certified publications; and articles from recognized associations, such as data center knowledge and government publishing sources. The research study involved the use of extensive secondary sources, directories, and databases, such as D&B Hoovers, DiscoverOrg, Factiva, vendor data sheets, product demos, Cloud Computing Association (CCA), Vendor Surveys, Asia Cloud Computing Association, and The Software Alliance to identify and collect information useful for this technical, market-oriented, and commercial study of the innovation management market. Secondary research was mainly used to obtain key information about the industrys value chain, the total pool of key players, market classification and segmentation as per the industry trends to the bottom-most level, regional markets, and key developments from both market and technology oriented perspectives.
Primary Research
In the primary research process, various primary sources from both the supply and demand sides were interviewed to obtain qualitative and quantitative information for this report. Primary sources from the supply-side included industry experts, such as Chief Executive Officers (CEOs), Vice Presidents (VPs), marketing directors, technology and innovation directors, and related key executives from various key companies and organizations providing innovation management solutions. The primary sources from the demand side included the end-users of event management software solutions, which included Chief Information Officers (CIOs), IT technicians and technologists, and IT managers at public and investor-owned utilities.
The following figure depicts the breakup of the primary profiles:
To know about the assumptions considered for the study, download the pdf brochure
Market Size Estimation
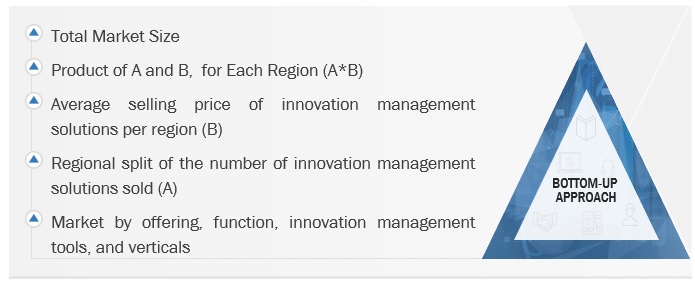
Both top-down and bottom-up approaches were used to estimate and validate the total size of the innovation management market. They were also used extensively to estimate the size of various subsegments in the market. The research methodology used to estimate the market size includes the following:
- The key players in the industry and markets have been identified through extensive secondary research.
- The industrys supply chain and market size, in terms of value, have been determined through primary and secondary research processes.
- All percentage shares, splits, and breakdowns have been determined using secondary sources and verified through primary sources.
Data Triangulation
After arriving at the overall market sizeusing the market size estimation processes as explained abovethe market was split into several segments and subsegments. To complete the overall market engineering process and arrive at the exact statistics of each market segment and subsegment, the data triangulation and market breakup procedures were employed, wherever applicable. The data was triangulated by studying several factors and trends from both, the demand and supply sides, in the innovation management market.
Report Objectives
- To describe and forecast the global innovation management market based on component (solutions and services), function, deployment mode, organization size, vertical, and region
- To forecast the market size of regional segments: North America, Europe, Asia Pacific (APAC), Middle East and Africa (MEA), and Latin America
- To strategically analyze the markets subsegments with respect to individual growth trends, prospects, and contributions to the total market
- To provide detailed information related to major factors (drivers, restraints, opportunities, and challenges) influencing the growth of the market
- To analyze opportunities in the market for stakeholders and provide details of the competitive landscape for major players
- To comprehensively analyze the core competencies of key players
- To track and analyze COVID-19 impact and competitive developments, such as mergers and acquisitions, new product developments, and partnerships and collaborations, in the market.
Available Customizations
With the given market data, MarketsandMarkets offers customizations as per the companys specific needs and on best effort basis for profiling of additional market players.
Growth opportunities and latent adjacency in Innovation Management Market