Intelligent Apps Market by Type (Consumer Apps, Enterprise Apps), Provider (Infrastructure, Data Collection & Preparation), Store Type (Google Play, Apple App Store), Deployment Mode, Service, Vertical, and Region - Global Forecast to 2023


The intelligent apps market size was USD 7.33 billion in 2017 and is projected to reach USD 46.98 billion by 2023, growing at a Compound Annual Growth Rate (CAGR) of 32.9% during the forecast period. The base year considered for this study is 2017, and the forecast period is from 2018 to 2023.
Major growth factors for the intelligent apps market include the increasing number of smartphone users across the globe, the rising adoption of AI technology, and increasing trend of mobile app-based advertising across verticals.
The objective of the study is to define, describe, and forecast the global market by provider, type (consumer apps and enterprise apps), store type (Google Play, Apple App Store, and others [slideME, baidu app store, Amazon app store, Samsung Galaxy store, and others]), services, deployment modes (cloud and on-premises), verticals, and regions. The report also provides detail information about the major factors such as drivers, restraints, opportunities, and challenges, influencing the growth of intelligent apps market.
The research methodology used to estimate and forecast the global intelligent apps market size begins with the capturing of data on the key vendor revenues through secondary research, annual reports, Institute of Electrical and Electronic Engineers (IEEE), Factiva, Bloomberg, and press releases. Moreover, the vendor offerings are taken into consideration to determine the market segmentation. The bottom-up procedure is employed to arrive at the overall market size from the revenues of the key market players. Post-arrival at the overall market size, the total market is split into several segments and subsegments, which are then verified through primary research by conducting extensive interviews with the key individuals, such as Chief Executive Officers (CEOs), Vice Presidents (VPs), directors, and executives. The data triangulation and market breakdown procedures are employed to complete the overall market engineering process and arrive at the exact statistics for all segments and subsegments.
The following figure depicts the breakup of the primary participants� profiles:
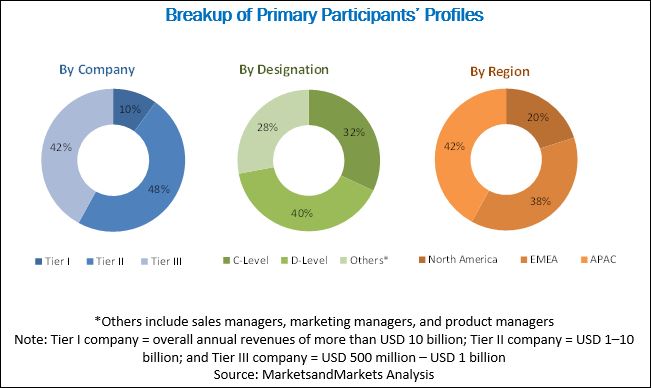
To know about the assumptions considered for the study, download the pdf brochure
Major vendors in the global intelligent apps market include IBM (US), Google (US), AWS (US), Microsoft (US), Salesforce (US), Oracle (US), Apple (US), Baidu (China), SAP SE (Germany), ServiceNow (US), Facebook (US), Intel (US), HPE (US), Avaamo (US), H2O.ai (US), BigML (US), Sentient Technologies (US), Clarifai (US), CloudMinds (US), Ayasdi (US), Narrative Science (US), AIBrain (US), Dation (US), Arkenea Technologies (US), iCarbonX (US), and Fuzzy.ai (US).
Target Audience for Intelligent Apps Market
- Intelligent apps vendors
- Service providers
- Application platform providers
- Research organizations
- App development executives
- Third-party service providers
Get online access to the report on the World's First Market Intelligence Cloud
- Easy to Download Historical Data & Forecast Numbers
- Company Analysis Dashboard for high growth potential opportunities
- Research Analyst Access for customization & queries
- Competitor Analysis with Interactive dashboard
- Latest News, Updates & Trend analysis
Request Sample Scope of the Report
Get online access to the report on the World's First Market Intelligence Cloud
- Easy to Download Historical Data & Forecast Numbers
- Company Analysis Dashboard for high growth potential opportunities
- Research Analyst Access for customization & queries
- Competitor Analysis with Interactive dashboard
- Latest News, Updates & Trend analysis

|
Report Metrics |
Details |
|
Market size available for years |
2017�2023 |
|
Base year considered |
2017 |
|
Forecast period |
2018�2023 |
|
Forecast units |
Billion (USD) |
|
Segments covered |
Type, Provider, Store Type, Deployment Mode, Service, Vertical and Regions |
|
Regions covered |
North America, APAC, Europe, MEA, and Latin America |
|
Companies covered |
IBM (US), Google (US), AWS (US), Microsoft (US), Salesforce (US), Oracle(US), Apple (US), Baidu (China), SAP SE (Germany), ServiceNow (US), Facebook (US), Intel (US), HPE (US), Avaamo (US), H2O.ai (US), BigML (US), Sentient Technologies (US), Clarifai (US), CloudMinds (US), Ayasdi (US), Narrative Science (US), AIBrain (US), Dation (US), Arkenea Technologies (US), iCarbonX (US), and Fuzzy.ai (US) |
The research report categorize the intelligent apps market into the following segments:
By Type:
- Consumer Apps
- Enterprise Apps
By Providers
- Infrastructure
- Data Collection and Preparation
- Machine Intelligence
By Services
- Professional Services
- Managed Services
By Store Type
- Google Play
- Apple App Store
- Others (Amazon app store, SlideME, Baidu app store, Samsung galaxy store, and others)
Intelligent Apps Market By Deployment Mode:
- Cloud
- On-Premises
By Vertical:
- BFSI
- Telecom
- Retail and eCommerce
- Healthcare and Lifer Sciences
- Education
- Media and Entertainment
- Travel and Hospitality
- Others (Energy and Utilities, Transportation and Logistics, and Manufacturing)
By Region:
- North America
- Europe
- Middle East and Africa (MEA)
- Asia Pacific (APAC)
- Latin America
Available Customizations
With the given market data, MarketsandMarkets offers customizations as per the company�s specific needs. The following customization options are available for the report:
Product Analysis
- Product matrix which gives a detailed comparison of product portfolio of each company
Geographic Analysis
- Further breakup of the North American intelligent apps market.
- Further breakup of the APAC market
- Further breakup of the European market
- Further breakup of the MEA market
- Further breakup of the Latin American market
Company Information
- Detailed analysis and profiling of additional market players (Up to 5)
MarketsandMarkets expects the global intelligent apps market to grow from USD 11.34 billion in 2018 to USD 46.98 billion by 2023, at a Compound Annual Growth Rate (CAGR) of 32.9% during the forecast period. Major driving factors for the market include increasing use of smartphones driving the demand for greater business mobility, rising consumer expectations for rich contextual and personalized experience, and growing focus on effective and real-time mobile advertising.
Among types, the enterprise apps segment is expected to grow at a higher rate during the forecast period. Enterprises have started using intelligent apps in various use cases. The consumer apps segment, on the other hand, is to have a larger market size during the forecast period, owing to the growing need to offer personalized results to end users.
The cloud deployment mode is expected to grow at a higher CAGR and hold a larger market size during the forecast period. As the cloud-based intelligent apps solutions are becoming the most popular choice among users, as they help reduce the cost related to infrastructure maintenance.
The infrastructure providers segment is expected to hold a larger market size during the forecast period. Whereas, the machine intelligence segment is to grow at a higher rate, as the segment helps developers make their job simple by offering application specific pre-built models.
The managed services segment is projected to grow at a higher rate during the forecast period, as managed services help organizations concentrate on core business procedures. On the other hand, the professional services segment is to hold a larger market size during the forecast period.
Among the store types, Google Play is expected to grow at the highest CAGR during the forecast period. On the other hand, Apple App Store is to hold the largest market size. Apple has its customer base in premium customer segment which is helping in the generation of significant revenues.
In the intelligent apps market by vertical, the media and entertainment vertical is projected to grow at the highest rate during the forecast period. As, on the enterprise level, the intelligent apps help them understand user profile and thereby assist in delivering personalized web pages to users. Whereas, the retail and eCommerce vertical is to hold the largest market size during the forecast period.
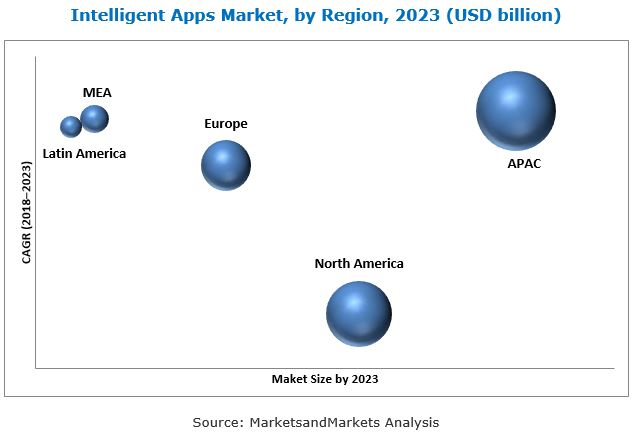
The global intelligent apps market by region covers North America, Europe, Asia Pacific (APAC), Middle East and Africa (MEA), and Latin America. North America is expected to be the largest revenue-generating region, due to the growing demand for intelligent apps by various industries to analyze large volumes of data. APAC is to be the fastest-growing region in the global intelligent apps market, owing to the increasing adoption of advanced technologies across the region.
Concerns over safeguarding customer data and high cost of implementing AI-based solutions could would be challenges for the growth of intelligent apps market.
Major vendors in the global intelligent apps market are IBM (US), Google (US), AWS (US), Microsoft (US), Salesforce (US), Oracle(US), Apple (US), Baidu (China), SAP SE (Germany), ServiceNow (US), Facebook (US), Intel (US), HPE (US), Avaamo (US), H2O.ai (US), BigML (US), Sentient Technologies (US), Clarifai (US), CloudMinds (US), Ayasdi (US), Narrative Science (US), AIBrain (US), Dation(US), Arkenea Technologies(US), iCarbonX (US), and Fuzzy.ai (US).
To speak to our analyst for a discussion on the above findings, click Speak to Analyst
Table of Contents
1 Introduction (Page No. - 17)
1.1 Objectives of the Study
1.2 Market Definition
1.3 Market Scope
1.4 Years Considered for the Study
1.5 Currency
1.6 Stakeholders
2 Research Methodology (Page No. - 20)
2.1 Research Data
2.1.1 Secondary Data
2.1.2 Primary Data
2.1.2.1 Breakup of Primaries
2.1.2.2 Key Industry Insights
2.2 Market Size Estimation
2.2.1 Bottom-Up Approach
2.2.2 Top-Down Approach
2.3 Research Assumptions
2.4 Limitations
3 Executive Summary (Page No. - 27)
4 Premium Insights (Page No. - 33)
4.1 Attractive Opportunities in the Intelligent Apps Market
4.2 Market Top 3 Verticals
4.3 Market Top 3 Providers and Regions
4.4 Market Potential, By Region
4.5 Market By Type
4.6 Market Investment Scenario
5 Market Overview and Industry Trends (Page No. - 36)
5.1 Introduction
5.2 Market Dynamics
5.2.1 Drivers
5.2.1.1 Increasing Use of Smartphones Driving the Demand for Greater Business Mobility
5.2.1.2 Rising Consumer Expectations for Rich Contextual and Personalized Experience
5.2.1.3 Growing Focus on Effective and Real-Time Mobile Advertising
5.2.2 Restraints
5.2.2.1 Fragmentation in Mobile Operating Systems
5.2.3 Opportunities
5.2.3.1 Increasing Automation of Business Processes Using Chatbots
5.2.4 Challenges
5.2.4.1 Concerns Over Safeguarding Customer Data
5.2.4.2 High Cost of Implementing Ai-Based Solutions
5.3 Use Cases
5.3.1 Introduction
5.3.1.1 Use Case: Scenario 1
5.3.1.2 Use Case: Scenario 2
5.3.1.3 Use Case: Scenario 3
5.3.1.4 Use Case: Scenario 4
5.3.1.5 Use Case: Scenario 5
5.4 Regulatory Implications
5.4.1 Introduction
5.4.2 General Data Protection Regulation (GDPR)
5.4.3 Health Insurance Portability and Accountability Act (HIPAA)
5.4.4 Food and Drug Administration (FDA) Compliance
5.4.5 Financial Industry Regulatory Authority (FINRA)
5.4.6 Federal Information Processing Standards (FIPS) Publication 140-2 Compliance
5.4.7 Sarbanes�Oxley Act (SOX)
5.4.8 Basel Ii
6 Intelligent Apps Market, By Type (Page No. - 44)
6.1 Introduction
6.2 Consumer Apps
6.3 Enterprise Apps
7 Market By Provider (Page No. - 48)
7.1 Introduction
7.2 Infrastructure
7.3 Data Collection and Preparation
7.4 Machine Intelligence
8 Intelligent Apps Market, By Service (Page No. - 53)
8.1 Introduction
8.2 Professional Services
8.3 Managed Services
9 Market By Store Type (Page No. - 57)
9.1 Introduction
9.2 Google Play
9.3 Apple App Store
9.4 Others
10 Intelligent Apps Market, By Deployment Mode (Page No. - 62)
10.1 Introduction
10.2 Cloud
10.3 On-Premises
11 Market By Vertical (Page No. - 66)
11.1 Introduction
11.2 Banking, Financial Services, and Insurance
11.3 Telecom
11.4 Retail and Ecommerce
11.5 Healthcare and Life Sciences
11.6 Education
11.7 Media and Entertainment
11.8 Travel and Hospitality
11.9 Others
12 Intelligent Apps Market, By Region (Page No. - 75)
12.1 Introduction
12.2 North America
12.2.1 United States
12.2.2 Canada
12.3 Europe
12.3.1 United Kingdom
12.3.2 Germany
12.3.3 France
12.3.4 Rest of Europe
12.4 Asia Pacific
12.4.1 China
12.4.2 Japan
12.4.3 India
12.4.4 Rest of Asia Pacific
12.5 Middle East and Africa
12.5.1 Israel
12.5.2 United Arab Emirates
12.5.3 South Africa
12.5.4 Rest of Middle East and Africa
12.6 Latin America
12.6.1 Brazil
12.6.2 Mexico
12.6.3 Rest of Latin America
13 Competitive Landscape (Page No. - 102)
13.1 Overview
13.2 Top Players Operating in the Intelligent Apps Market
13.3 Competitive Scenario
13.3.1 New Product/Service Launches and Product/Service Enhancements
13.3.2 Agreements and Partnerships
13.3.3 Acquisitions
13.3.4 Expansions
14 Company Profiles (Page No. - 108)
(Business Overview, Products and Service Offered, Recent Developments, MnM View, SWOT Analysis)*
14.1 IBM
14.2 Google
14.3 Apple
14.4 Microsoft
14.5 Oracle
14.6 Baidu
14.7 AWS
14.8 Salesforce
14.9 SAP
14.10 Servicenow
14.11 Facebook
14.12 Intel
14.13 HPE
14.14 Avaamo
14.15 H2o.AI
14.16 Bigml
14.17 Sentient Technologies
14.18 Clarifai
14.19 Cloudminds
14.20 Ayasdi
14.21 Narrative Science
14.22 Aibrain
14.23 Datoin
14.24 Arkenea
14.25 Icarbonx
14.26 Fuzzy.AI
*Business Overview, Products and Service Offered, Recent Developments, MnM View, SWOT Analysis Might Not Be Captured in Case of Unlisted Companies.
15 Appendix (Page No. - 161)
15.1 Industry Experts
15.2 Discussion Guide
15.3 Knowledge Store: Marketsandmarkets� Subscription Portal
15.4 Available Customizations
15.5 Related Reports
15.6 Author Details
List of Tables (69 Table)
Table 1 United States Dollar Exchange Rate, 2015�2017
Table 2 Global Intelligent Apps Market Size and Growth Rate, 2016�2023 (USD Million, Y-O-Y%)
Table 3 Global Mobile Advertising Spending: Forecast to 2018
Table 4 Market Size, By Type, 2016�2023 (USD Million)
Table 5 Consumer Apps: Market Size By Region, 2016�2023 (USD Million)
Table 6 Enterprise Apps: Market Size By Region, 2016�2023 (USD Million)
Table 7 Market Size, By Provider, 2016�2023 (USD Million)
Table 8 Infrastructure: Market Size By Region, 2016�2023 (USD Million)
Table 9 Data Collection and Preparation: Market Size By Region, 2016�2023 (USD Million)
Table 10 Machine Intelligence: Market Size By Region, 2016�2023 (USD Million)
Table 11 Intelligent Apps Market Size, By Service, 2016�2023 (USD Million)
Table 12 Professional Services: Market Size By Region, 2016�2023 (USD Million)
Table 13 Managed Services: Market Size By Region, 2016�2023 (USD Million)
Table 14 Market Size, By Store Type, 2016�2023 (USD Million)
Table 15 Google Play: Market Size By Region, 2016�2023 (USD Million)
Table 16 Apple App Store: Market Size By Region, 2016�2023 (USD Million)
Table 17 Others: Market Size By Region, 2016�2023 (USD Million)
Table 18 Market Size, By Deployment Mode, 2016�2023 (USD Million)
Table 19 Cloud: Market Size By Region, 2016�2023 (USD Million)
Table 20 on Premises: Market Size By Region, 2016�2023 (USD Million)
Table 21 Intelligent Apps Market Size, By Vertical, 2016�2023 (USD Million)
Table 22 Banking, Financial Services, and Insurance: Market Size By Region, 2016�2023 (USD Million)
Table 23 Telecom: Market Size By Region, 2016�2023 (USD Million)
Table 24 Retail and Ecommerce: Market Size By Region, 2016�2023 (USD Million)
Table 25 Healthcare and Life Sciences: Market Size By Region, 2016�2023 (USD Million)
Table 26 Education: Market Size By Region, 2016�2023 (USD Million)
Table 27 Media and Entertainment: Market Size By Region, 2016�2023 (USD Million)
Table 28 Travel and Hospitality: Market Size By Region, 2016�2023 (USD Million)
Table 29 Others: Market Size By Region, 2016�2023 (USD Million)
Table 30 Intelligent Apps Market Size, By Region, 2016�2023 (USD Million)
Table 31 North America: Market Size By Country, 2016�2023 (USD Million)
Table 32 North America: Market Size By Type, 2016�2023 (USD Million)
Table 33 North America: Market Size By Provider, 2016�2023 (USD Million)
Table 34 North America: Market Size By Service, 2016�2023 (USD Million)
Table 35 North America: Market Size By Store Type, 2016�2023 (USD Million)
Table 36 North America: Market Size By Deployment Mode, 2016�2023 (USD Million)
Table 37 North America: Market Size By Vertical, 2016�2023 (USD Million)
Table 38 Europe: Intelligent Apps Market Size, By Country, 2016�2023 (USD Million)
Table 39 Europe: Market Size By Type, 2016�2023 (USD Million)
Table 40 Europe: Market Size By Provider, 2016�2023 (USD Million)
Table 41 Europe: Market Size By Service, 2016�2023 (USD Million)
Table 42 Europe: Market Size By Store Type, 2016�2023 (USD Million)
Table 43 Europe: Market Size By Deployment Mode, 2016�2023 (USD Million)
Table 44 Europe: Market Size By Vertical, 2016�2023 (USD Million)
Table 45 Asia Pacific: Intelligent Apps Market Size, By Country, 2016�2023 (USD Million)
Table 46 Asia Pacific: Market Size By Type, 2016�2023 (USD Million)
Table 47 Asia Pacific: Market Size By Provider, 2016�2023 (USD Million)
Table 48 Asia Pacific: Market Size By Service, 2016�2023 (USD Million)
Table 49 Asia Pacific: Market Size By Store Type, 2016�2023 (USD Million)
Table 50 Asia Pacific: Market Size By Deployment Mode, 2016�2023 (USD Million)
Table 51 Asia Pacific: Market Size By Vertical, 2016�2023 (USD Million)
Table 52 Middle East and Africa: Intelligent Apps Market Size, By Country, 2016�2023 (USD Million)
Table 53 Middle East and Africa: Market Size By Type, 2016�2023 (USD Million)
Table 54 Middle East and Africa: Market Size By Provider, 2016�2023 (USD Million)
Table 55 Middle East and Africa: Market Size By Service, 2016�2023 (USD Million)
Table 56 Middle East and Africa: Market Size By Store Type, 2016�2023 (USD Million)
Table 57 Middle East and Africa: Market Size By Deployment Mode, 2016�2023 (USD Million)
Table 58 Middle East and Africa: Market Size By Vertical, 2016�2023 (USD Million)
Table 59 Latin America: Intelligent Apps Market Size, By Country, 2016�2023 (USD Million)
Table 60 Latin America: Market Size By Type, 2016�2023 (USD Million)
Table 61 Latin America: Market Size By Provider, 2016�2023 (USD Million)
Table 62 Latin America: Market Size By Service, 2016�2023 (USD Million)
Table 63 Latin America: Market Size By Store Type, 2016�2023 (USD Million)
Table 64 Latin America: Market Size By Deployment Mode, 2016�2023 (USD Million)
Table 65 Latin America: Market Size By Vertical, 2016�2023 (USD Million)
Table 66 New Product/Service Launches and Product/Service Enhancements, 2015�2018
Table 67 Agreements and Partnerships, 2016�2018
Table 68 Acquisitions, 2015�2018
Table 69 Expansions, 2016�2018
List of Figures (55 Figures)
Figure 1 Global Intelligent Apps Market Segmentation
Figure 2 Global Market Regional Scope
Figure 3 Market: Research Design
Figure 4 Breakup of Primary Interviews: By Company, Designation, and Region
Figure 5 Data Triangulation
Figure 6 Market Size Estimation Methodology: Bottom-Up Approach
Figure 7 Market Size Estimation Methodology: Top-Down Approach
Figure 8 Intelligent Apps Market: Assumptions
Figure 9 Asia Pacific is Estimated to Have the Largest Market Share in 2018
Figure 10 Market Snapshot, By Type, 2017
Figure 11 Market Snapshot By Provider, 2017
Figure 12 Market Snapshot By Service, 2017
Figure 13 Market Snapshot By Store Type, 2017
Figure 14 Market Snapshot By Deployment Mode, 2017
Figure 15 Market Snapshot By Vertical, 2017
Figure 16 Increasing Use of Smartphones is Expected to Drive the Global Intelligent Apps Market Growth During the Forecast Period
Figure 17 Media and Entertainment Vertical is Expected to Grow at the Highest CAGR During the Forecast Period
Figure 18 Infrastructure Provider and Asia Pacific are Estimated to Have the Largest Market Shares in the Global Intelligent Apps Market in 2018
Figure 19 Asia Pacific is Expected to Register the Fastest Growth During the Forecast Period
Figure 20 Consumer Apps Segment is Expected to Have the Larger Market Size During the Forecast Period
Figure 21 Asia Pacific is Expected to Emerge as the Best Region for Investments During the Forecast Period
Figure 22 Intelligent Apps Market: Drivers, Restraints, Opportunities, and Challenges
Figure 23 Global Market Share By Operating Systems, 2018
Figure 24 Types of Mobile App Advertisements
Figure 25 Enterprise Apps Segment is Expected to Grow at A Higher CAGR During the Forecast Period
Figure 26 Machine Intelligence Segment is Expected to Record the Highest CAGR During the Forecast Period
Figure 27 Managed Services Segment is Expected to Record A Higher CAGR During the Forecast Period
Figure 28 Google Play Store Type is Expected to Grow at the Highest CAGR During the Forecast Period
Figure 29 Cloud Segment is Expected to Grow at A Higher CAGR During the Forecast Period
Figure 30 Media and Entertainment Vertical is Expected to Witness the Highest CAGR During the Forecast Period
Figure 31 Asia Pacific is Estimated to Account for the Largest Market Size in 2018
Figure 32 Canada is Expected to Register the Highest CAGR During the Forecast Period
Figure 33 North America: Market Snapshot
Figure 34 Asia Pacific: Market Snapshot
Figure 35 Key Developments By Leading Players in the Intelligent Apps Market During 2015�2018
Figure 36 IBM: Company Snapshot
Figure 37 IBM: SWOT Analysis
Figure 38 Google: Company Snapshot
Figure 39 Google: SWOT Analysis
Figure 40 Apple: Company Snapshot
Figure 41 Apple: SWOT Analysis
Figure 42 Microsoft: Company Snapshot
Figure 43 Microsoft: SWOT Analysis
Figure 44 Oracle: Company Snapshot
Figure 45 Oracle: SWOT Analysis
Figure 46 Baidu: Company Snapshot
Figure 47 Baidu: SWOT Analysis
Figure 48 AWS: Company Snapshot
Figure 49 AWS: SWOT Analysis
Figure 50 Salesforce: Company Snapshot
Figure 51 SAP: Company Snapshot
Figure 52 Servicenow: Company Snapshot
Figure 53 Facebook: Company Snapshot
Figure 54 Intel: Company Snapshot
Figure 55 HPE: Company Snapshot


Growth opportunities and latent adjacency in Intelligent Apps Market