Intelligent Completion Market by Application (Onshore & Offshore), Component (Hardware & Software), Type (Complex & Simple), Function (Downhole Monitoring & Control System, Surface Control System, and Communication), and Region - Global Forecast to 2023


[126 Pages Report] The global intelligent completion market was valued at USD 1.53 billion in 2017 and is projected to reach USD 2.16 billion by 2023, at a CAGR of 6.05% during the forecast period.
The years considered for the study are as follows:
- Base Year: 2017
- Estimated Year: 2018
- Projected Year: 2023
- Forecast Period: 2018 � 2023
The base year considered for company profiles is 2017. Whenever information was unavailable for the base year, the prior year has been considered.
Objectives of the Study
- To define and segment the intelligent completion market with respect to application, component, technology, function, and region
- To provide detailed information about major factors influencing the growth of the market (drivers, restraints, opportunities, and industry-specific challenges)
- To strategically analyze the market with respect to individual growth trends, future expansions, and contributions to the market
- To analyze market opportunities for stakeholders and details of a competitive landscape for market leaders
- To forecast the growth of the market with respect to the major regions (North America, Europe, Asia Pacific, Middle East, Africa, and South America)
- To strategically profile key players and comprehensively analyze their market rankings and core competencies
- To analyze competitive developments such as new product development, mergers & acquisitions, expansions & investments, partnership & collaboration, and contracts & agreements, in the market
Research Methodology
This research study involved the use of extensive secondary sources, directories, journals on power generation technologies, and other related rental markets; newsletters and databases such as Hoover�s, Bloomberg, Businessweek, and Factiva, among others, to identify and collect information useful for a technical, market-oriented, and commercial study of the global intelligent completion market. The primary sources include several industry experts from the core and related industries, vendors, preferred suppliers, technology developers, alliances, and organizations related to all the segments of this industry�s value chain. The research methodology has been explained below.
- Study of annual revenues and market developments of major players providing intelligent completion
- Analysis of the major technologies and applications of the intelligent completion
- Assessment of future trends and growth of the market on the basis of investments in onshore and offshore applications
- Study of contracts & developments related to the market by key players across different regions
- Finalization of the overall market sizes by triangulating the supply-side data, which includes product developments, supply chains, and annual revenues of companies manufacturing market across the globe
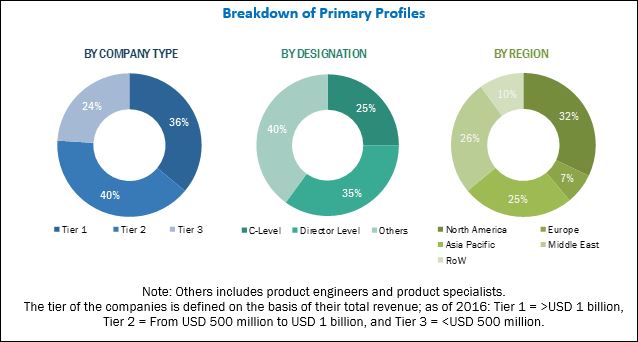
After arriving at the overall market size, the market was split into several segments and subsegments. The figure given below illustrates the breakdown of primary interviews conducted during the research study on the basis of company type, designation, and region.
To know about the assumptions considered for the study, download the pdf brochure
Major players operating in the intelligent completion market include Schlumberger (US), Halliburton (US), BHGE (US), Weatherford (Switzerland), and National Oilwell Varco (US).
Target Audience:
- Rig manufacturers and suppliers
- Drilling and completions companies
- Exploration and Production companies
- Oilfield service provider companies
- National and international drilling associations
Get online access to the report on the World's First Market Intelligence Cloud
- Easy to Download Historical Data & Forecast Numbers
- Company Analysis Dashboard for high growth potential opportunities
- Research Analyst Access for customization & queries
- Competitor Analysis with Interactive dashboard
- Latest News, Updates & Trend analysis
Request Sample Scope of the Report
:
Get online access to the report on the World's First Market Intelligence Cloud
- Easy to Download Historical Data & Forecast Numbers
- Company Analysis Dashboard for high growth potential opportunities
- Research Analyst Access for customization & queries
- Competitor Analysis with Interactive dashboard
- Latest News, Updates & Trend analysis

By Type
- Simple Intelligent Well Completion
- Complex Intelligent Well Completion
By Function
- Downhole Control System
- Downhole Monitoring System
- Surface Control System
- Communication Technology
By Components
- Hardware
- Software
By Application
- Onshore Intelligent Completions Well
- Offshore Intelligent Completions Well
By Region
- Asia Pacific
- Europe
- North America
- Middle East
- South America
- Africa
Available Customizations:
With the given market data, MarketsandMarkets offers customizations as per the client�s specific needs. The following customization options are available for this report:
Company Information
Detailed analyses and profiling of additional market players (up to five)
Drivers
Focus on the increasing production from oil & gas wells
According to IEA, the demand for oil will continue to grow until 2040, and the use of natural gas is expected to increase by 45% by 2040, with industries expecting to be the largest demand generating sector. The oil & gas operators are looking forward to better and more efficient ways to exploit these resources. To maximize the production and improve the economics of reservoirs, oil & gas operators are looking for a wide range of sophisticated completion strategies that utilize real-time data monitoring with remote-controlled sliding sleeves or variable chokes. With the use of intelligent completions, oil & gas operators can manage the production in a better way and eliminate or reduce interventions and associated production downtime, well costs, and risks.
Improved economic and operational benefits
The higher the number of wells that are integrated with intelligent field systems, the greater economic efficiency would be achieved. The adoption of intelligent well technology equips oil & gas wells with monitoring systems enabling the operator to decrease operational costs, optimize production, and manage the entire field. Further, the productivity enhancement is of significant importance as it delivered financial advantage and increased ROIs. The oil & gas operators can introduce additional capabilities for evaluating productive formation, thereby allowing the optimization of production and waterflood systems. Moreover, intelligent completions provide other important advantages such as production from several formations, zonal isolation, control of production rate from different intervals, and enhancement of artificial lift efficiency.
Restraints
High initial cost coupled with lack of data processing infrastructure in the oil & gas rigs
The major factors that result in higher cost of intelligent completions are initial design, components, installation, and maintenance. This would require the oil & gas operators to increase their CAPEX for IC which has traditionally been higher when compared to traditional completion techniques. Hardware and other sensors should help ensure sufficient coverage of data and minimize the redundancy for high-value measurements of overall equipment effectiveness (OEE). Moreover, high-precision hardware sensors are usually more costly than low-precision sensors and find application in critical areas. The installation and the cost of components and systems coupled with their reliability have been a pertinent issue the industry has been dealing with in terms of intelligent completions. However, in the coming years, the industry is expected to diversify the product and system portfolios to address different types of markets by introducing technologies that help lower the costs by a third to half.
Opportunities
Exploration activities in offshore and Arctic regions
New deepwater discoveries since 2012, in India, Australia, Russia, China, Nigeria, and Norway have bolstered E&P activities in these offshore regions. In June 2017, the Oil and Natural Gas Corporation (ONGC) discovered an oilfield with approximately 20 million tons of hydrocarbon reserves in high offshore fields in Mumbai. The Arctic region has seen vast levels of petroleum resource development over the past few decades. The Arctic region is characterized by extreme operating conditions. For example, the region is capital intensive and political regulations pose threats. This offers attractive opportunity for offshore drilling & completion service providers, as offshore services aid the completion processes in locations with lesser known topography. These offshore deepwater locations are in the middle of the ocean and monitoring the levels of E&P are limited to operators who are available onsite. However, integrated and automated operations are likely to ensure data monitoring from far-flung locations enabling effective decision making.
Competitive Landscape
Contracts & Agreements
|
Date |
Company Name |
Development |
|
October 2017 |
Tendeka |
Kuwait Oil Company awarded a contract to Tendeka with its Inflow Control Device (ICD) technology to enhance production through effective reservoir management. |
|
September 2017 |
BHGE |
BHGE was awarded a contract from Petrobel for phase two of the �supergiant� Zohr Gas Field situated in the Mediterranean Sea, off the Egyptian coast. |
Source: Company Websites and Press Releases
New Product Launches
|
Date |
Company Name |
Product Name |
|
November 2017 |
Halliburton |
Halliburton launched the JetPulse high-speed telemetry service to enhance reservoir understanding and faster decision making. |
|
October 2017 |
BHGE |
BHGE launched FASTrak Prism fluid analysis and sampling while drilling service. The service uses advanced sensors and technology to collect and deliver reliable, high-quality fluid samples and real-time reservoir characterization for overall well completion and production strategies. |
Source: Company Websites and Press Releases
Mergers & Acquisitions
|
Date |
Company Name |
Development |
|
December 2017 |
Schlumberger |
Schlumberger acquired Weatherford�s US hydraulic fracturing business. This deal is expected to enable the company to expand its US and Canadian well-completions operations |
|
July 2017 |
Halliburton |
Halliburton acquired Summit ESP to expand its artificial lift capabilities and enhance its market position in North America. |
Source: Company Websites and Press Releases
The global intelligent completion market is estimated to be USD 1.61 billion in 2018 and is projected to reach USD 2.16 billion by 2023, at a CAGR of 6.05%. Increase in production of oil & gas wells and improved economical and operational benefits are the major drivers of the intelligent completion market.
The report segments the intelligent completion market, by application, into onshore and offshore. The onshore application segment is expected to dominate the market in 2018 owing to the rise in deepwater and ultra-deepwater drilling activities. Moreover, the cost incurred in the oil & gas activities such as drilling and well completion is less in onshore when compared to offshore applications.
Based on type, the intelligent completion market has been segmented into complex intelligent well completion and simple intelligent well completion. The simple intelligent well completion segment is expected to hold the largest market share in 2018. Simple intelligent well completion helps to enhance the performance of the wells and finds its application in horizontal and multilateral wells. It provides downhole monitoring system to facilitate reservoir monitoring. This type of intelligent completion includes pressure and temperature sensors, distributed & temperature profiling, and downhole flow meters. The adoption of simple intelligent well completion will drive the simple intelligent well completion segment.
Based on component, the intelligent completion market has been segmented into hardware and software. The hardware segment is estimated to lead the market in 2018 and is expected to grow at the fastest rate during the forecast period, as it consists of various components such as control devices, monitoring devices, and others. (progressing units and communication network).
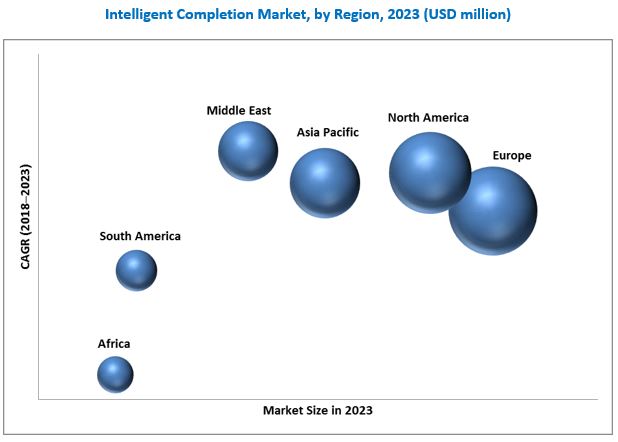
In this report, the intelligent completion market has been analyzed with respect to 6 regions, namely, the Asia Pacific, Europe, North America, South America, the Middle East, and Africa. Europe is expected to hold the largest market share in 2018 and the Middle East is the fastest growing market during the forecast period. Factors such as increase in oil & gas activities and availability of several mature oilfields in the North Sea are driving the intelligent completion market in the European region.
Exploration activities in offshore and arctic regions and increased adoption of data driven technologies for real-time monitoring in the oil & gas industry can create opportunities in the market. However, concerns regarding data privacy and high cybersecurity risks could restrain the growth of the market, leading to declining profits.
Some of the leading players in the intelligent completion market are Schlumberger (US), Halliburton (US), BHGE (US), Weatherford (US), and National Oilwell Varco (US). Contracts & agreements and new product launches were the most widely adopted strategies by players to ensure their dominance in the market.
Increased adoption of data-driven technologies for real-time monitoring in the oil & gas industry
Digital transformation and automation are emerging trends in the oil & gas industry. The rapid digitalization in the oil & gas industry has taken place by transforming traditional processes with innovative technology to deploy minimum workforce over remote onshore and offshore exploration sites. The decline in oil prices, frequent budget and schedule overruns, and climate change accountability are issues faced by the industry. The application of technologies such as robotics, process automation, DCS, intelligent completions, and SCADA systems in the upstream segment helps automate the control process and offers operators a real-time view for optimization. Benefits realized through this are process automation, production efficiencies, reduced costs, and elimination of the need for manual data collection. This provides better routine maintenance of equipment and spotting of areas for improvement, thus minimizing losses. Furthermore, the usage of cloud computing technologies is expanding in many applications or systems such as consumer-based applications to enterprise management systems. Cloud analytics is quickly gaining momentum and has become an essential need for oil & gas companies to deploy their business tools globally at low capital costs. The concept of storing data in the cloud and virtually displaying the data is becoming prominent because of the ease of availability and reliable service providers. These factors are expected to provide excellent opportunities for the intelligent completion market during the forecast period.
Challenges
Concerns regarding data privacy and increased cybersecurity risks
The increasing application of automation and use of connected technologies have increased the risk of cybersecurity and industrial espionage. Cybersecurity in the oil & gas sector is critical to protecting the confidential field data. Operational systems that include production line management and oil & gas monitoring in the oil & gas sector are used to monitor and control operations across the entire value chain. At the drilling, completion or production stage, the availability of confidential process data is the primary focus for most security engineers in the field. As automation and digitalization data is used for predictive maintenance, planning, and execution of many exploration and development activities, it requires access to multiple oil & gas data sets. This is a crucial task as most of the data platforms are consolidated and require extensive computing power, owing to which the machine data or parts of it are required to be stored at the vendor�s data center. In 2015, the US government placed a cybersecurity law that was passed by the Senate. The law allows the sharing of internet traffic information between the US government and oil & gas companies. Hence, the oil & gas-related data must be protected under the Federal laws, and any breaches or failure to maintain its integrity can result in legal and financial penalties.
Expansion
Mergers & Acquisitions
|
Date |
Company Name |
Development |
|
November 2017 |
BHGE |
Baker Hughes collaborated with Sonatrach to form a new company named Arzew Industrial Zone to strengthen Algeria�s position in the upstream oil & gas market. |
Partnership & Collaboration
Mergers & Acquisitions
|
Date |
Company Name |
Development |
|
November 2017 |
Weatherford |
Weatherford partnered with Intel Corporation for utilizing IoT to enhance the efficiency and profitability of production operations in the oilfields. |
|
September 2017 |
BHGE |
Baker Hughes and KBC, a Yokogawa company, collaborated to provide integrated asset performance management and digital process simulation capabilities across the value chain. |
To speak to our analyst for a discussion on the above findings, click Speak to Analyst
Table of Contents
1 Introduction (Page No. - 14)
1.1 Objectives of the Study
1.2 Market Definition
1.3 Market Scope
1.3.1 Markets Covered
1.3.2 Regional Scope
1.3.3 Years Considered for the Study
1.4 Currency
1.5 Stakeholders
2 Research Methodology (Page No. - 17)
2.1 Research Data
2.1.1 Secondary Data
2.1.1.1 Key Secondary Sources
2.1.2 Primary Data
2.1.2.1 Key Data From Primary Sources
2.1.2.2 Key Industry Insights
2.1.2.3 Breakdown of Primaries
2.2 Market Size Estimation
2.2.1 Bottom-Up Approach
2.2.2 Market Size Estimation Methodology: Top-Down Approach
2.3 Market Breakdown & Data Triangulation
2.4 Research Limitations
2.5 Research Assumptions
3 Executive Summary (Page No. - 25)
4 Premium Insights (Page No. - 29)
4.1 Attractive Opportunities in the Intelligent Completion Market, 2018�2023
4.2 Intelligent Completion Market, By Countries, 2018 & 2023
4.3 Intelligent Completion Market, By Application, 2018 & 2023
4.4 Intelligent Completion Market, By Component, 2018 & 2023
4.5 Intelligent Completion Market, By Type, 2018 & 2023
5 Market Overview (Page No. - 32)
5.1 Introduction
5.2 Market Dynamics
5.2.1 Drivers
5.2.1.1 Focus on the Increasing Production From Oil & Gas Wells
5.2.1.2 Improved Economic and Operational Benefits
5.2.2 Restraints
5.2.2.1 High Initial Cost Coupled With Lack of Data Processing Infrastructure in the Oil & Gas Rigs
5.2.3 Opportunities
5.2.3.1 Exploration Activities in Offshore and Arctic Regions
5.2.3.2 Increased Adoption of Data-Driven Technologies for Real-Time Monitoring in the Oil & Gas Industry
5.2.4 Challenges
5.2.4.1 Concerns Regarding Data Privacy and Increased Cybersecurity Risks
6 Intelligent Completion Market, By Application (Page No. - 39)
6.1 Introduction
6.2 Onshore
6.3 Offshore
7 Intelligent Completion Market, By Component (Page No. - 43)
7.1 Introduction
7.2 Hardware
7.3 Software
8 Intelligent Completion Market, By Type (Page No. - 47)
8.1 Introduction
8.2 Simple Intelligent Well Completion
8.3 Complex Intelligent Well Completion
9 Intelligent Completion Market, By Function (Page No. - 51)
9.1 Introduction
9.2 Downhole Monitoring System
9.3 Downhole Control System
9.4 Surface Control System
9.5 Communication System
10 Intelligent Completion Market, By Region (Page No. - 53)
10.1 Introduction
10.2 Asia Pacific
10.2.1 By Application
10.2.2 By Component
10.2.3 By Type
10.2.4 By Country
10.2.4.1 China
10.2.4.2 Malaysia
10.2.4.3 Indonesia
10.2.4.4 Rest of Asia Pacific
10.3 North America
10.3.1 By Application
10.3.2 By Component
10.3.3 By Type
10.3.4 By Country
10.3.4.1 US
10.3.4.2 Canada
10.3.4.3 Mexico
10.4 Europe
10.4.1 By Application
10.4.2 By Component
10.4.3 By Type
10.4.4 By Country
10.4.4.1 Norway
10.4.4.2 Russia
10.4.4.3 UK
10.4.4.4 Rest of Europe
10.5 Middle East
10.5.1 By Component
10.5.2 By Application
10.5.3 By Type
10.5.4 By Country
10.5.4.1 Saudi Arabia
10.5.4.2 UAE
10.5.4.3 Kuwait
10.5.4.4 Oman
10.5.4.5 Rest of the Middle East
10.6 Africa
10.6.1 By Application
10.6.2 By Component
10.6.3 By Type
10.6.4 By Country
10.6.4.1 Angola
10.6.4.2 Nigeria
10.6.4.3 Rest of Africa
10.7 South America
10.7.1 By Application
10.7.2 By Component
10.7.3 By Type
10.7.4 By Country
10.7.4.1 Brazil
10.7.4.2 Argentina
10.7.4.3 Rest of South America
11 Competitive Landscape (Page No. - 81)
11.1 Overview
11.2 Market Ranking of Players and Industry Concentration, 2017
11.3 Competitive Scenario
11.3.1 Contracts & Agreements
11.3.2 New Product Launches
11.3.3 Mergers & Acquisitions
11.3.4 Expansion
11.3.5 Partnership & Collaboration
12 Company Profile (Page No. - 87)
12.1 Benchmarking
(Business Overview, Products/ Services Offered, Recent Developments, and MnM View)*
12.2 Schlumberger
12.3 Weatherford
12.4 Bhge
12.5 Halliburton
12.6 National Oilwell Varco
12.7 Ouro Negro
12.8 Packers Plus Energy Services
12.9 Omega Well Intervention Ltd.
12.10 Ciscon Nigeria
12.11 Praxis
12.12 Vantage Energy
12.13 Tendeka
*Details on Business Overview, Products/ Services Offered Offered, Recent Developments, and MnM View Might Not Be Captured in Case of Unlisted Companies.
13 Appendix (Page No. - 119)
13.1 Insights of Industry Experts
13.2 Discussion Guide
13.3 Knowledge Store: Marketsandmarkets� Subscription Portal
13.4 Available Customizations
13.5 Related Reports
13.6 Author Details
List of Tables (66 Tables)
Table 1 Intelligent Completion Market Snapshot
Table 2 Market Size, By Application, 2016�2023 (USD Million)
Table 3 Onshore: Market Size, By Region, 2016�2023 (USD Million)
Table 4 Offshore: Market Size, By Region, 2016�2023 (USD Million)
Table 5 Market Size, By Component, 2016�2023 (USD Million)
Table 6 Hardware: Market Size, By Region, 2016�2023 (USD Million)
Table 7 Software: Market Size, By Region, 2016�2023 (USD Million)
Table 8 Intelligent Completion Market Size, By Type, 2016�2023 (USD Million)
Table 9 Simple Intelligent Well Completion: Market Size, By Region, 2016�2023 (USD Million)
Table 10 Complex Intelligent Well Completion: Market Size, By Region, 2016�2023 (USD Million)
Table 11 Market Size, By Function, 2016�2023 (USD Million)
Table 12 Intelligent Completion Market Size, By Region, 2016�2023 (USD Million)
Table 13 Top 5 Intelligent Completion Largest Market Size, By Country, 2016�2023 (USD Million)
Table 14 Top 5 Intelligent Completion Fastest Market, By Country, 2016�2023 (USD Million)
Table 15 Top 5 Intelligent Completion Largest Market Size, By Offshore, 2016�2023 (USD Million)
Table 16 Asia Pacific: Intelligent Completion Market Size, By Application, 2016�2023 (USD Million)
Table 17 Asia Pacific: Market Size, By Component, 2016�2023 (USD Million)
Table 18 Asia Pacific: Market Size, By Type, 2016�2023 (USD Million)
Table 19 Asia Pacific: Market Size, By Country, 2016�2023 (USD Million)
Table 20 China: Intelligent Completion Market Size, By Application, 2016�2023 (USD Million)
Table 21 Malaysia: Market Size, By Application, 2016�2023 (USD Million)
Table 22 Indonesia: Market Size, By Application, 2016�2023 (USD Million)
Table 23 Rest of Asia Pacific: Market Size, By Application, 2016�2023 (USD Million)
Table 24 North America: Intelligent Completion Market Size, By Application, 2016�2023 (USD Million)
Table 25 North America: Market Size, By Component, 2016�2023 (USD Million)
Table 26 North America: Market Size, By Type, 2016�2023 (USD Million)
Table 27 North America: Market Size, By Country, 2016�2023 (USD Million)
Table 28 US: Intelligent Completion Market Size, By Application, 2016�2023 (USD Million)
Table 29 Canada: Market Size, By Application, 2016�2023 (USD Million)
Table 30 Mexico: Market Size, By Application, 2016�2023 (USD Million)
Table 31 Europe: Intelligent Completion Market Size, By Application, 2016�2023 (USD Million)
Table 32 Europe: Market Size, By Component, 2016�2023 (USD Million)
Table 33 Europe: Market Size, By Type, 2016�2023 (USD Million)
Table 34 Europe: Market Size, By Country, 2016�2023 (USD Million)
Table 35 Norway: Intelligent Completion Market Size, By Application, 2016�2023 (USD Million)
Table 36 Russia: Market Size, By Application, 2016�2023 (USD Million)
Table 37 UK: Market Size, By Application, 2016�2023 (USD Million)
Table 38 Rest of Europe: Market Size, By End-User, 2016�2023 (USD Million)
Table 39 Middle East: Intelligent Completion Market Size, By Component, 2016�2023 (USD Million)
Table 40 Middle East: Market Size, By Application, 2016�2023 (USD Million)
Table 41 Middle East: Market Size, By Type, 2016�2023 (USD Million)
Table 42 Middle East: Market Size, By Country, 2016�2023 (USD Million)
Table 43 Saudi Arabia: Intelligent Completion Market Size, By Application, 2016�2023 (USD Million)
Table 44 UAE: Market Size, By Application, 2016�2023 (USD Million)
Table 45 Kuwait: Market Size, By Application, 2016�2023 (USD Million)
Table 46 Oman: Market Size, By Application, 2016�2023 (USD Million)
Table 47 Rest of the Middle East: Market Size, By Application, 2016�2023 (USD Million)
Table 48 Africa: Intelligent Completion Market Size, By Application, 2016�2023 (USD Million)
Table 49 Africa: Market Size, By Component, 2016�2023 (USD Million)
Table 50 Africa: Market Size, By Type, 2016�2023 (USD Million)
Table 51 Africa: Market Size, By Country, 2016�2023 (USD Billion)
Table 52 Angola: Market Size, By Application, 2016�2023 (USD Million)
Table 53 Nigeria: Market Size, By Application, 2016�2023 (USD Million)
Table 54 Rest of Africa: Market Size, By Application, 2016�2023 (USD Million)
Table 55 South America: Intelligent Completion Market Size, By Application, 2016�2023 (USD Million)
Table 56 South America: Market Size, By Component, 2016�2023 (USD Million)
Table 57 South America: Market Size, By Type, 2016�2023 (USD Million)
Table 58 South America: Market Size, By Country, 2016�2023 (USD Million)
Table 59 Brazil: Intelligent Completion Market Size, By Application, 2016�2023 (USD Million)
Table 60 Argentina: Market Size, By Application, 2016�2023 (USD Million)
Table 61 Rest of South America: Market Size, By Application, 2016�2023 (USD Million)
Table 62 Contracts & Agreements, 2017
Table 63 New Product Launches, 2014�2017
Table 64 Mergers & Acquisitions, 2014�2017
Table 65 Mergers & Acquisitions, 2014�2017
Table 66 Mergers & Acquisitions, 2014�2017
List of Figures (32 Figures)
Figure 1 Intelligent Completion Market: Research Design
Figure 2 Bottom-Up Approach
Figure 3 Top-Down Approach
Figure 4 Data Triangulation Methodology
Figure 5 Assumptions of the Research Study
Figure 6 European Market Dominated the Intelligent Completion in 2017
Figure 7 Onshore Segment is Expected to Lead the Intelligent Completion Market, By Application, During the Forecast Period
Figure 8 Hardware Segment is Expected to Lead the Intelligent Completion Market, By Component, During the Forecast Period
Figure 9 Simple Intelligent Well Completion Segment is Expected to Lead the Intelligent Completion Market, By Type, During the Forecast Period
Figure 10 Increasing Production of Oil & Gas From Wells is Expected to Drive the Intelligent Completion Market During the Forecast Period
Figure 11 Saudi Arabia is Expected to Hold the Fastest Growing Intelligent Completion Market During the Forecast Period
Figure 12 The Onshore Segment is Expected to Have Largest Intelligent Completion Market Share During the Forecast Period
Figure 13 Hardware Segment is Expected to Lead the Intelligent Completion Market During the Forecast Period
Figure 14 Simple Intelligent Well Completion Segment is Expected to Lead the Intelligent Completion Market During the Forecast Period
Figure 15 Market Dynamics: Intelligent Completion Market
Figure 16 Increase in Production With the Application of Intelligent Completions, 2012�2016
Figure 17 World Crude Oil Annual Production, 2016�2019
Figure 18 World Crude Oil Annual Production vs Consumption, 2011�2016
Figure 19 Global Offshore Investments, 2011�2022 (USD Billion)
Figure 20 Onshore Segment Accounted for the Largest Market Share in 2017
Figure 21 Hardware Segment Accounted for the Largest Market Share in 2017
Figure 22 The Single Intelligent Completion Type Accounted for the Largest Market Share in 2017
Figure 23 Europe is the Largest Market (By Value) During the Forecast Period
Figure 24 North America: Intelligent Completion Market Snapshot
Figure 25 Europe: Market Snapshot
Figure 26 Key Developments in the Intelligent Completion, 2014�2017
Figure 27 Schlumberger Lead the Market for Intelligent Completion in 2017
Figure 28 Schlumberger: Company Snapshot
Figure 29 Weatherford: Company Snapshot
Figure 30 Bhge: Company Snapshot
Figure 31 Halliburton: Company Snapshot
Figure 32 National Oilwell Varco: Company Snapshot


Growth opportunities and latent adjacency in Intelligent Completion Market