Intelligent Pigging Market by Technology (Magnetic Flux Leakage, Ultrasonic, Caliper), Application (Metal Loss/Corrosion Detection, Geometry Measurement & Bend Detection, Crack & Leak Detection), Pipeline Type (Gas, Liquid) - Global Forecast to 2023


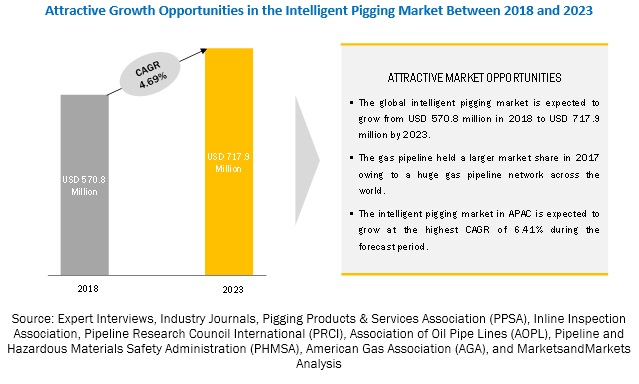
[120 Pages Report] The intelligent pigging market size was valued at USD 544.7 Million in 2017 and is expected to reach USD 717.9 Million by 2023, at a CAGR of 4.69% during the forecast period.
By technology, Intelligent Pigging Market to hold the largest market share during the forecast period
MFL technology is likely to continue to hold the largest share of the intelligent pigging market in the next few years. The magnetic flux leakage (MFL)-based intelligent pigging is used to inspect and measure the metal loss in terms of corrosion or gouges. MFL technology is more preferred technology as MFL pigs can be run in both liquid and gas pipelines, and it does not require any liquid couplant, unlike ultrasonic technology-based intelligent pigs. The MFL technology-based intelligent pigs can measure metal loss or corrosion even for thin-walled pipelines, whereas ultrasonic technology-based intelligent pigs fail to achieve accurate measurements for thin-walled pipelines.
By pipeline type, gas pipelines expected to command the Intelligent Pigging Market during the forecast period
Huge shale gas development across North America and offshore deep-water exploration and production activities were the hallmarks of the oil & gas industry in the past few decades owing to technological advancements. This leads to the development of a huge network of pipelines to transport, gather, and distribute petroleum products. Moreover, the distribution of gas as an energy source for both industrial and domestic purposes further increases the length of the pipelines globally.
The intelligent pigging market for gas pipelines is expected to grow at a higher CAGR owing to the development of pipeline infrastructure in China, India, Africa, and Europe. According to the data released by Global Gas Flaring Reduction Partnership (GGFR)), a World Bank-led organization comprising oil companies, governments, and international institutions working to reduce gas flaring, the global gas flaring in 2016 was 149.4 bcm, an increase of 2% from the previous year. The initiative in gas flaring reduction, especially in Africa, would lead to the increasing deployment of new gas pipelines, which, in turn, offers opportunities to intelligent pigging companies.
By application, metal loss/corrosion detection application to lead the Intelligent Pigging Market during the forecast period
Metal loss anomalies are defined by an area of pipe wall with a quantifiable decrease in its thickness. Corrosion can be caused by the chemical reaction due to the content or material that is being carried through the pipeline, and environmental factors are also responsible for corrosion. Huge failures and industrial disasters are the consequences of corrosion failures due to which timely inspection of pipelines for corrosion detection has become a more common practice. Thus, the increased risk of damage due to corrosion and metal loss results in higher demand for intelligent pigging for the said application; therefore, the metal loss/corrosion detection application is expected to continue to hold the largest market share in the coming years.
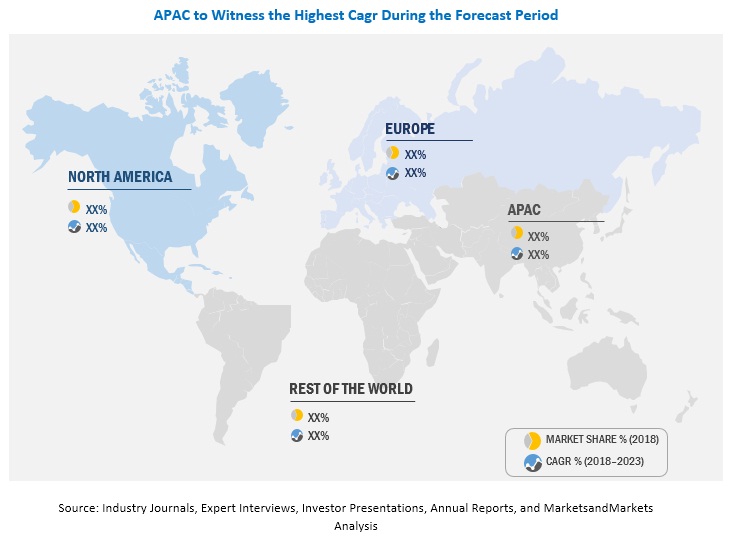
By geography, APAC to witness highest CAGR in the Intelligent Pigging Market during the forecast period
North America to hold the largest share of the intelligent pigging market owing to the presence of the world�s largest pipeline infrastructure in the US in 2018. The North American intelligent pigging market is driven by stringent regulations pertaining to the operations and integrity of pipelines.
Europe is another important intelligent pigging market and a gas-driven economy. In 2010, the European Union (EU) was able to meet 35.3% requirement of its total gas consumption from the local gas production. It has declined to 27.6% in 2016. Therefore, the EU will have to construct new pipelines to sustain its energy demand as pipelines are the more economical mode of transporting liquids and petroleum products than other alternative options such as LNG. As a result, Germany and Russia have united to build a natural gas pipeline known as Nord Stream 2, which is expected to double the existing gas supply from Russia to Germany. However, a 1,200 kilometer-long-pipeline project is a debatable issue among many stakeholders.
At the end of 2015, the total length of crude, refined oil, and natural gas pipelines in China was 112,000 km. By 2020, the total length of the natural gas pipeline network in the country is expected to reach 169,000 km and to 240,000 km by 2025.
Even India has planned to lay many intercity gas pipelines for seamless supply of fuel at a cheaper rate, which would result in building new pipelines and improve pipeline infrastructure, thereby propelling the growth of the intelligent pigging market in APAC.
Market Dynamics
Driver: Increased government mandates and regulations for pipeline inspections
Pipeline inspection is a crucial process in asset integrity management. Pipeline operators need to check the signs of metal loss, internal and external corrosion, and other irregularities to ensure safety and mitigate risks effectively. Immense safety measures are required to carry or transmit large volumes of flammable or explosive materials, such as natural gas or oil, through pipelines as even a small leak in these pipelines may result in serious consequences. Inline inspection of gas or liquid pipelines can be done with the help of intelligent pigging. It helps to determine anomalies and target areas that are required to undergo further examination, repair, or replacement. Hence, governments worldwide have made the inline inspection of pipelines mandatory. They are also insisting on conducting scheduled maintenance and inspection activities to ensure the long-term and safe operation of the pipeline, which is one of the key factors driving the market growth.
The federal program of the US for pipeline safety is primarily conducted by the Pipeline and Hazardous Materials Safety Administration (PHMSA) agency of the United States Department of Transportation, which monitors inspection and enforcement activities. The agency is established to protect people and the environment by advancing the safe transportation of energy and other essential hazardous materials used in our daily lives. PHMSA has made it mandatory to deploy leak detection systems, inspect the construction of new pipelines, investigate pipeline failures, and inspect pipeline facilities for compliance with the operation, maintenance, integrity, and emergency response safety regulations. PHMSA also insists on inspections of pipelines in areas affected by extreme weather and natural disasters.
Restraint: Unpiggable pipelines render intelligent pigging cumbersome
Pigging is the most preferred method for inline inspection and cleaning of the pipeline. However, pigging does not ensure the total elimination of the risks associated with the pipeline transmission. Although most pigging operations are carried out smoothly, it is a process with high risk; if a pig is stalled or stuck in the pipeline, due to debris or wax, it blocks or jams the pipeline, which may have considerable operational, safety, environmental, and commercial consequences.
Pipelines that cannot be inspected using intelligent pigs are known as unpiggable. These pipelines are those that have acute bends, many �T� and �Y� junctions, and variable diameters that make pigging infeasible. It has been observed that the use of orifice plates and pipe joints changes the diameter of the pipe, making pigging impractical. A stuck pig in an unpiggable pipeline can result in high losses for the operator as it causes halting of the operation inside the pipeline.
Opportunity: Significant use of small-diameter intelligent pigs
Generally, pigs are used for cleaning and pipeline maintenance services. Intelligent pigs are used in the inline pipeline inspection technique. Earlier, the cross-sectional area of pigs was quite large in size, and their use was limited to pipelines having a large diameter. Nowadays, pipelines having a smaller diameter and cross-sectional area are commonly used, and the inspection of such pipelines is crucial. Companies are coming up with multi-diameter intelligent pigs for variable cross-sectional pipes and also with smaller cross-sectional intelligent pigs. The inspection of pipelines with smaller diameter pigs is expected to be the rising trend. As in-line inspection, especially for the metal loss detection application, has become a universally accepted and important part of pipeline integrity, the demand for smaller diameter intelligent pigs for more difficult applications is likely to increase.
Challenge: More time consumption in data analysis than that in data acquisition
Intelligent pigs are deployed in pipelines to inspect its inline integrity by collecting the data through ultrasonic technology, magnetic flux leakage method, or by caliper pigs. Intelligent pigs have sensors that sense anomalies such as corrosion, leak, and metal loss and has data acquisition system on board; hence, data can be collected instantly and does not require much efforts, but the analysis of data after miles of inspection of pipelines is a cumbersome job. The inspection can be done for a few miles in a few days, but it may take more than 90 days to analyze this data in detail. Meanwhile, if any anomaly appears inside the pipeline, it is left unnoticed, and another inspection cycle may start quite later. Some companies have made software modules that reduce the time to analyze large volumes of collected data. However, intelligent pigging market players still find data analysis tasks more time-consuming than that of data acquisition.
Get online access to the report on the World's First Market Intelligence Cloud
- Easy to Download Historical Data & Forecast Numbers
- Company Analysis Dashboard for high growth potential opportunities
- Research Analyst Access for customization & queries
- Competitor Analysis with Interactive dashboard
- Latest News, Updates & Trend analysis
Request Sample Scope of the Report
Get online access to the report on the World's First Market Intelligence Cloud
- Easy to Download Historical Data & Forecast Numbers
- Company Analysis Dashboard for high growth potential opportunities
- Research Analyst Access for customization & queries
- Competitor Analysis with Interactive dashboard
- Latest News, Updates & Trend analysis

|
Report Metric |
Details |
|
Market size available for years |
2015�2023 |
|
Base year considered |
2017 |
|
Forecast period |
2018�2023 |
|
Forecast units |
Million (USD) |
|
Segments covered |
Industry, Sensing Parameter, Device, Type, and Region |
|
Geographies covered |
North America, Europe, APAC, RoW (South America, Middle East, and Africa) |
|
Companies covered |
T.D. Williamson (TDW) (US), Baker Hughes (US), ROSEN Group (Germany), NDT Global (Ireland), Enduro Pipeline Services (US), Intertek (UK), Applus (Spain), LIN SCAN (UAE), Dacon Inspection Services (Thailand), Onstream Pipeline Inspection (Canada) |
This research report categorizes the intelligent pigging market on the basis of technology, application, pipeline type, and geography.
Intelligent Pigging Market, by Technology:
- Magnetic Flux Leakage
- Ultrasonic
- Caliper
Intelligent Pigging Market, by Application:
- Metal Loss/Corrosion Detection
- Geometry Measurement & Bend Detection
- Crack & Leak Detection
Intelligent Pigging Market, by Pipeline Type:
- Gas
- Liquid
Intelligent Pigging Market, by Region:
- North America
- Europe
- Asia Pacific (APAC)
- Rest of the World (RoW)
Key Market Players:
T.D. Williamson (TDW) (US), Baker Hughes (US), ROSEN Group (Germany), NDT Global (Ireland), Enduro Pipeline Services (US), Intertek (UK), Applus (Spain), LIN SCAN (UAE), Dacon Inspection Services (Thailand), Onstream Pipeline Inspection (Canada)
T.D. Williamson has a huge experience in all aspects of pipeline management and inspected 800,000 KM pipeline so far. The company is into the pipeline equipment business and providing offshore and onshore services for a long time and offers both conventional and automated pigging solutions. The company also delivers customized solutions according to the operator�s need in the automated pigging market. The company also offers pig tracking systems and transmitters, pig washer equipment, and pipeline consulting services. Worldwide presence and extensive product portfolio of the company give TDW a competitive edge over other players in the automated pigging market. Considering the company�s expertise and financial strength, TWD is expected to stay ahead of the curve. For instance, expert engineers at TWD can not only provide guidance and recommendation on the best suitable pigging solution to operators but also analyze and interpret post-inspection data of pipelines using the latest technologies, such as AI and high-performance computing, which help them to offer results way earlier than the conventional methods.
Key Questions Answered
- Where will all these developments take the industry in the long term?
- What are the upcoming trends for the Intelligent Pigging market?
- Which segment provides the most opportunity for growth?
- Who are the leading vendors operating in this market?
- What are the opportunities for new market entrants?
To speak to our analyst for a discussion on the above findings, click Speak to Analyst
Table of Contents
1 Introduction (Page No. - 12)
1.1 Objectives of the Study
1.2 Definition
1.3 Scope of the Study
1.3.1 Markets Covered
1.3.2 Geographic Scope
1.3.3 Years Considered for the Study
1.4 Currency
1.5 Stakeholders
2 Research Methodology (Page No. - 16)
2.1 Research Data
2.1.1 Secondary Data
2.1.1.1 Secondary Sources
2.1.2 Primary Data
2.1.2.1 Primary Interviews With Experts
2.1.2.2 Breakdown of Primaries
2.1.2.3 Primary Sources
2.1.3 Secondary and Primary Research
2.1.3.1 Key Industry Insights
2.2 Market Size Estimation
2.2.1 Bottom-Up Approach
2.2.1.1 Approach for Capturing the Market Size By Bottom-Up Analysis (Demand Side)
2.2.2 Top-Down Approach
2.2.2.1 Approach for Capturing the Market Size By Top-Down Analysis (Supply Side)
2.3 Market Breakdown and Data Triangulation
2.4 Assumptions
3 Executive Summary (Page No. - 26)
4 Premium Insights (Page No. - 31)
4.1 Intelligent Pigging Market Opportunities (2018�2023)
4.2 Market in North America, By Technology (2018�2023)
4.3 Market in Europe, By Application
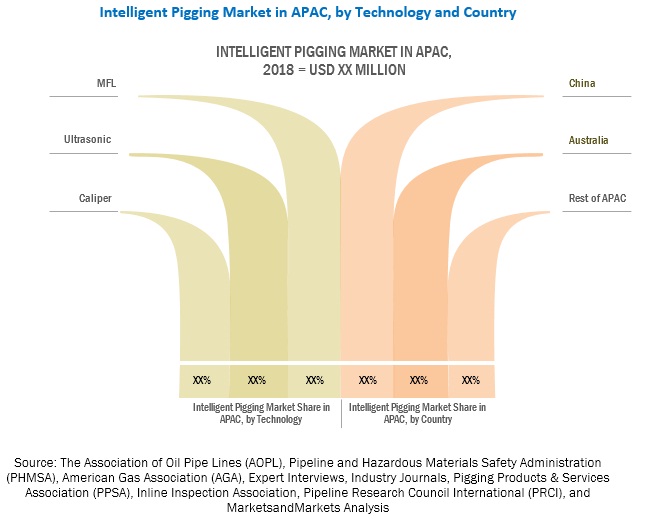
4.4 Market in APAC, By Technology and Country
4.5 Market for Gas Pipelines, By Region
5 Market Overview (Page No. - 34)
5.1 Introduction
5.1.1 Drivers
5.1.1.1 Increased Government Mandates and Regulations for Pipeline Inspections
5.1.1.2 Benefits of Intelligent Pigging Solutions
5.1.1.3 Concern Over the Safety of Pipelines and Energy Infrastructure
5.1.2 Restraints
5.1.2.1 Unpiggable Pipelines Render Intelligent Pigging Cumbersome
5.1.3 Opportunities
5.1.3.1 Significant Use of Small-Diameter Intelligent Pigs
5.1.4 Challenges
5.1.4.1 More Time Consumption in Data Analysis Than That in Data Acquisition
6 Intelligent Pigging Market, By Technology (Page No. - 38)
6.1 Introduction
6.2 Magnetic Flux Leakage (MFL)
6.3 Ultrasonic
6.4 Caliper
7 Intelligent Pigging Market, By Pipeline Type (Page No. - 42)
7.1 Introduction
7.2 Liquid
7.3 Gas
8 Intelligent Pigging Market, By Application (Page No. - 46)
8.1 Introduction
8.2 Metal Loss/Corrosion Detection
8.3 Geometry Measurement and Bend Detection
8.4 Crack and Leak Detection
9 Geographic Analysis (Page No. - 51)
9.1 Introduction
9.2 North America
9.2.1 US
9.2.2 Canada
9.2.3 Mexico
9.3 Europe
9.3.1 UK
9.3.2 Germany
9.3.3 Russia
9.3.4 Rest of Europe
9.4 APAC
9.4.1 China
9.4.2 Australia
9.4.3 Rest of Asia Pacific
9.5 Rest of the World
9.5.1 Middle East & Africa
9.5.2 South America
10 Competitive Landscape (Page No. - 78)
10.1 Overview
10.2 Market Ranking Analysis: Intelligent Pigging Market
11 Company Profiles (Page No. - 80)
(Business Overview, Products/ Services Offered, SWOT Analysis, and MnM View)*
11.1 Key Players
11.1.1 T.D. Williamson
11.1.2 Baker Hughes
11.1.3 Rosen Group
11.1.4 NDT Global
11.1.5 Enduro Pipeline Services
11.1.6 Intertek Group
11.1.7 Applus
11.1.8 Lin Scan
11.1.9 Dacon Inspection Services
11.1.10 Onstream Pipeline Inspection
11.2 Other Key Players
11.2.1 SGS SA
11.2.2 A.Hak Industrial Services
11.2.3 Quest Integrity Group
11.2.4 Cdria Pipeline Services
11.2.5 Cokebusters
11.2.6 Romstar
11.2.7 Halfwave As
11.2.8 Penspen
11.2.9 Rouge Pipeline & Process Services
11.2.10 Corrosion Control Engineering
*Details on Business Overview, Products/ Services Offered, SWOT Analysis, and MnM View Might Not Be Captured in Case of Unlisted Companies.
12 Appendix (Page No. - 100)
12.1 Insights of Industry Experts
12.2 Discussion Guide
12.3 Knowledge Store: Marketsandmarkets� Subscription Portal
12.4 Introducing RT: Real-Time Market Intelligence
12.5 Available Customizations
12.6 Related Reports
12.7 Author Details
List of Tables (64 Tables)
Table 1 Oil & Gas Leak Incidents (2015�2016)
Table 2 Intelligent Pigging Market, By Technology, 2015�2023 (USD Million)
Table 3 Market for MFL Technology, By Region, 2015�2023 (USD Million)
Table 4 Market for Ultrasonic Technology, By Region, 2015�2023 (USD Million)
Table 5 Market for Caliper Technology, By Region, 2015�2023 (USD Million)
Table 6 Market, By Pipeline Type, 2015�2023 (USD Million)
Table 7 Market for Liquid Pipelines, By Region, 2015�2023 (USD Million)
Table 8 Market for Gas Pipelines, By Region, 2015�2023 (USD Million)
Table 9 Market, By Application, 2015�2023 (USD Million)
Table 10 Market for Metal Loss/Corrosion Detection, By Region, 2015�2023 (USD Million)
Table 11 Market for Geometry Measurement and Bend Detection, By Region, 2015�2023 (USD Million)
Table 12 Market for Crack and Leak Detection, By Region, 2015�2023 (USD Million)
Table 13 Market, By Region, 2015�2023 (USD Million)
Table 14 Natural Gas Pipeline Trade Movement in North America in 2016
Table 15 Market in North America, By Technology, 2015�2023 (USD Million)
Table 16 Market in North America, By Application, 2015�2023 (USD Million)
Table 17 Market in North America, By Pipeline Type, 2015�2023 (USD Million)
Table 18 Market in North America, By Country, 2015�2023 (USD Million)
Table 19 Market in North America for Gas Pipelines, By Country, 2015�2023 (USD Million)
Table 20 Market in North America for Liquid Pipelines, By Country, 2015�2023 (USD Million)
Table 21 Major Upcoming Natural Gas Pipeline Projects in US
Table 22 Market in US, By Pipeline Type, 2015�2023 (USD Million)
Table 23 Market in Canada, By Pipeline Type, 2015�2023 (USD Million)
Table 24 Market in Mexico, By Pipeline Type, 2015�2023 (USD Million)
Table 25 Market in Europe, By Country, 2015�2023 (USD Million)
Table 26 Market in Europe, By Technology, 2015�2023 (USD Million)
Table 27 Market in Europe, By Application, 2015�2023 (USD Million)
Table 28 Market in Europe, By Pipeline Type, 2015�2023 (USD Million)
Table 29 Market in APAC, By Country, 2015�2023 (USD Million)
Table 30 Market in APAC, By Technology, 2015�2023 (USD Million)
Table 31 Market in APAC, By Application, 2015�2023 (USD Million)
Table 32 Market in APAC, By Pipeline Type, 2015�2023 (USD Million)
Table 33 Market in RoW, By Region, 2015�2023 (USD Million)
Table 34 Market in RoW, By Technology, 2015�2023 (USD Million)
Table 35 Market in RoW for MFL Technology, By Region, 2015�2023 (USD Million)
Table 36 Market in RoW for Ultrasonic Technology, By Region, 2015�2023 (USD Million)
Table 37 Market in RoW for Caliper Technology, By Region, 2015�2023 (USD Million)
Table 38 Market in RoW, By Application, 2015�2023 (USD Million)
Table 39 Market in RoW for Metal Loss/Corrosion Detection, Y Region, 2015�2023 (USD Million)
Table 40 Market in RoW for Crack Detection, By Region, 2015�2023 (USD Million)
Table 41 Intelligent Pigging Market in RoW for Geometry Measurement and Bend Detection, By Region, 2015�2023 (USD Million)
Table 42 Market in RoW, By Pipeline Type, 2015�2023 (USD Million)
Table 43 Market in RoW for Liquid Pipelines, By Region, 2015�2023 (USD Million)
Table 44 Intelligent Pigging Market in RoW for Gas Pipelines, By Region, 2015�2023 (USD Million)
Table 45 Market in Middle East & Africa, By Region, 2015�2023 (USD Million)
Table 46 Market in Middle East & Africa, By Technology, 2015�2023 (USD Million)
Table 47 Market in Middle East & Africa, By Application, 2015�2023 (USD Million)
Table 48 Market in Middle East & Africa, By Pipeline Type, 2015�2023 (USD Million)
Table 49 Market in Middle East & Africa for MFL Technology, By Region, 2015�2023 (USD Million)
Table 50 Market in Middle East & Africa for Metal Loss/Corrosion Detection, By Region, 2015�2023 (USD Million)
Table 51 Market in Middle East & Africa for Crack Detection, By Region, 2015�2023 (USD Million)
Table 52 Market in Middle East & Africa for Geometry Measurement and Bend Detection, By Region, 2015�2023 (USD Million)
Table 53 Market in Middle East & Africa for Liquid Pipelines, By Region, 2015�2023 (USD Million)
Table 54 Market in Middle East & Africa for Gas Pipelines, By Region, 2015�2023 (USD Million)
Table 55 Intelligent Pigging Market in Middle East, By Technology, 2015�2023 (USD Million)
Table 56 Market in Middle East, By Application, 2015�2023 (USD Million)
Table 57 Market in Middle East, By Pipeline Type, 2015�2023 (USD Million)
Table 58 Market in Africa, By Technology, 2015�2023 (USD Million)
Table 59 Market in Africa, By Application, 2015�2023 (USD Million)
Table 60 Market in Africa, By Pipeline Type, 2015�2023 (USD Million)
Table 61 Market in South America, By Technology, 2015�2023 (USD Million)
Table 62 Market in South America, By Application, 2015�2023 (USD Million)
Table 63 Market in South America, By Pipeline Type, 2015�2023 (USD Million)
Table 64 Top 3 Companies in Market, 2017
List of Figures (28 Figures)
Figure 1 Markets Covered
Figure 2 Intelligent Pigging Market: Research Design
Figure 3 Bottom-Up Approach to Arrive at Market Size
Figure 4 Top-Down Approach to Arrive at Market Size
Figure 5 Data Triangulation
Figure 6 Assumptions
Figure 7 Intelligent Pigging Market Segmentation
Figure 8 Global Market Size From 2015 to 2023 and CAGR During 2018�2023
Figure 9 Metal Loss/Corrosion Detection Application to Lead Market During 2018�2023
Figure 10 MFL Technology to Dominate Global Market During Forecast Period
Figure 11 Gas Pipelines Expected to Command Intelligent Pigging Market Between 2018 and 2023
Figure 12 APAC to Witness Highest CAGR in Global Market During 2018�2023
Figure 13 Attractive Growth Opportunities in Intelligent Pigging Market Between 2018 and 2023
Figure 14 MFL Technology to Dominate Market During Forecast Period
Figure 15 Metal Loss/Corrosion Detection Application Expected to Account for Highest Market Share in 2018
Figure 16 China Expected to Dominate Market in APAC in 2018
Figure 17 North America to Hold Largest Share of Market in 2018
Figure 18 Market Dynamics
Figure 19 Market, By Technology
Figure 20 Market, By Pipeline Type
Figure 21 Market, By Application
Figure 22 Market, By Geography
Figure 23 Market Snapshot in North America
Figure 24 Gas Production and Consumption Trends in European Union (EU), 2005�2016
Figure 25 Market Snapshot in APAC
Figure 26 Baker Hughes: Company Snapshot
Figure 27 Intertek Group: Company Snapshot
Figure 28 Applus: Company Snapshot


Growth opportunities and latent adjacency in Intelligent Pigging Market
Offshore Piles coating repairs / cleaning pigging / smart pigging / offshore platforms solutions.