IoT Connectivity Market by Component (Platform, Services), Organization Size, Application Areas (Building &Home Automation, Smart Energy & Utility, Smart Manufacturing, Connected Health, Smart Retail, Smart Transportation), Region - Global Forecast to 2024


IoT Connectivity Market Size and Opportunities
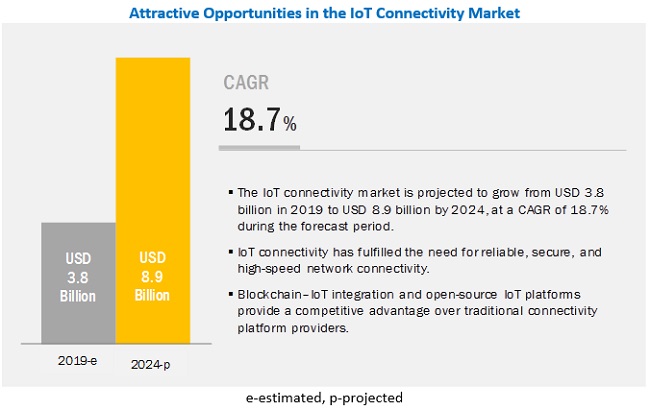
[119 Pages Report] The global IoT Connectivity Market was estimated to be worth $3.8 billion in 2019, and it is anticipated to increase to $8.9billion by 2024, with a CAGR of 18.7%from 2019 to 2024. Major factors expected to drive the growth of the market include an increase in demand for connected devices; the need for reliable, secure, and high-speed network connectivity; and ability to integrating the standalone and non-standalone components of IoT ecosystem.
By organization size, the large enterprises to constitute a larger market size during the forecast period
Based on organization size, the global IoT connectivity market is segmented into SMEs and large enterprises. The segmentation has been carried out based on the number of employees in the organizations. The large enterprise segment is expected to have the largest market size in the market, due to their early adoption of IoT connectivity platform and high investment capabilities.
Large enterprises can benefit from the cloud services which require IoT connectivity, as they can host their large number of applications in the cloud network, which eases application management. With the cloud, enterprises can achieve improved collaboration, along with faster performance, quick responsiveness, and greater agility, without having to operate a server infrastructure. On the other hand, the SMEs segment is expected to experience moderate growth in the adoption of IoT connectivity platform and associated services.
The managed services segment to grow at a higher CAGR during the forecast period
Among services, the managed services segment is expected to witness a higher growth rate than the professional services segment during the forecast period. Managed services help clients manage their IoT connectivity operations from consultancy to deployment and maintenance. The prime responsibility of the managed services providers is to improve the efficiency of inbound and outbound operations cost-effectively for enterprises.
Managed services assist clients in outsourcing the IoT connectivity to service providers for efficiently managing their key business operations. These services are very useful for companies, which do not have internal budgets or analytical skills to implement and manage the IoT connectivity platforms. The managed service providers handle end-to-end deployment and after-sales services for the platform.
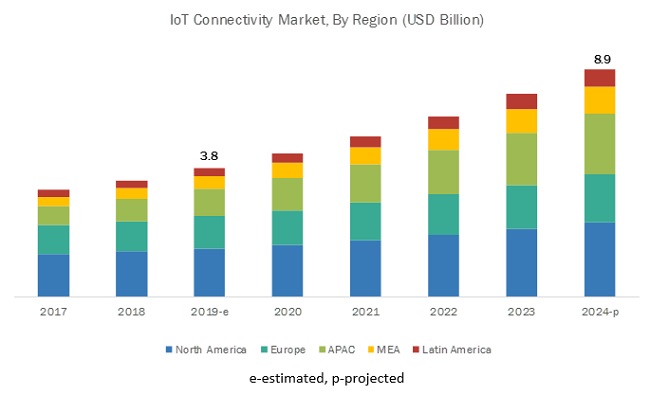
North America to account for the largest market size during the forecast period.
The geographic analysis of the IoT connectivity market includes five major regions, namely, North America, Asia Pacific (APAC), Europe, Latin America, and the Middle East and Africa (MEA). North America is expected to hold the largest share of the global market and comprises the US and Canada, which are early adopters of connectivity technologies such as cellular-based and unlicensed low-power wide-area network (LPWAN).
US and Canada have sustainable and well-established economies, which empower them to actively invest in R&D activities, thereby contributing to the development of new technologies. Due to the early adoption of trending technologies, such as IoT, cloud, AI, big data, and mobility, organizations are keen to integrate IoT technologies into their processes. The advent of SMEs and increasing digitalization in manufacturing by large organizations have also aided the growth of the North American IoT connectivity platform space.
Key Market Players
Key and emerging market players include AT&T (US), Cisco (US), Verizon (US), Vodafone (UK), Ericsson (Sweden), Sierra Wireless (Canada), Orange (France), Telefónica (Spain), Huawei (China), Telit (Italy), Hologram (US), Particle (US), Aeris (US), Sigfox (France), EMnify (Germany), and Moeco (US). These players have adopted various strategies to grow in the IoT connectivity market. The companies are focused on inorganic growth strategies to strengthen their market position.
Since the acquisition of Jasper in March 2016 for approximately USD 1.4 billion, Cisco has made exponential growth in the IoT connectivity market. The company focuses on adopting inorganic growth strategies. For instance, the company collaborated with KaR-Tel in April 2018, to help enable enterprises in Kazakhstan launch, manage, and monetize IoT services. In February 2019, Cisco partnered with THREE Group, part of the conglomerate CK Hutchison, and launched IoT services globally. THREE Group’s enterprise customers can launch IoT services using Cisco’s powerful connectivity management platform, Control Center. Cisco also collaborated with Telenor Norway, a provider of mobile and network services in Norway in February 2018. With this collaboration, Cisco will help enable enterprises throughout the country to launch, manage, and monetize IoT services. Telenor Norway’s mobile network with the Cisco Jasper IoT Connectivity Management Platform enables enterprises to quickly and cost-effectively deliver new connected services through connected devices that create valuable experiences for customers and unlock new revenue channels.
Huawei is expanding its business by forming strategic partnerships with various companies. In 2016, the company collaborated with Intel to improve network performance. In September 2018, the company launched a new product called IoT CEP Cloud, which is an operational connectivity management platform designed explicitly for telco requirements. It enables telcos and enterprises for IoT deployments and to share network and device APIs with enterprises and developers. In 2016, Huawei and MTN entered into a joint venture for developing smart water solution in Africa. This partnership helped Huawei increase its market share in Africa.
Get online access to the report on the World's First Market Intelligence Cloud
- Easy to Download Historical Data & Forecast Numbers
- Company Analysis Dashboard for high growth potential opportunities
- Research Analyst Access for customization & queries
- Competitor Analysis with Interactive dashboard
- Latest News, Updates & Trend analysis
Request Sample Scope of the Report
Get online access to the report on the World's First Market Intelligence Cloud
- Easy to Download Historical Data & Forecast Numbers
- Company Analysis Dashboard for high growth potential opportunities
- Research Analyst Access for customization & queries
- Competitor Analysis with Interactive dashboard
- Latest News, Updates & Trend analysis

|
Report Metrics |
Details |
|
Market size value in 2019 |
USD 3.8 billion |
|
Revenue forecast for 2024 |
USD 8.9 billion |
|
Growth Rate |
18.7% CAGR |
|
Market size available for years |
2017–2024 |
|
Base year considered |
2018 |
|
Forecast period |
2019–2024 |
|
Forecast units |
Billion (USD) |
|
Segments covered |
Component (Platform and Services), Services (Professional Services and Managed Services), Organization Size (Large Enterprises, and SMEs), Application Areas, and Region |
|
Geographies covered |
North America, Europe, Asia Pacific, Latin America and Middle East and Africa |
|
Companies covered |
AT&T (US), Cisco (US), Verizon (US), Vodafone (UK), Ericsson (Sweden), Sierra Wireless (Canada), Orange (France), Telefónica (Spain), Huawei (China), Telit (Italy), Hologram (US), Particle (US), Aeris (US), Sigfox (France), EMnify (Germany), and Moeco (US) |
The research report categorizes the IoT connectivity market to forecast the revenues and analyze trends in each of the following subsegments:
By Component
- Platform
-
Services
- Professional Services
- Managed Services
By Region
- North America
- Europe
- APAC
- Latin America
- MEA
By Application Areas
- Building & Home Automation
- Smart Energy & Utility
- Smart Manufacturing
- Connected Health
- Smart Retail
- Smart Transportation
- Others (Education and Agriculture)
By Organization Size
- Large Enterprises
- SMEs
Recent Developments
- In February 2019, AT&T collaborated with Vodafone. This collaboration will accelerate IoT connectivity and innovation in the automotive industry. The companies plan to combine their industry-leading expertise to develop superior and consistent connected car solutions and experiences for customers across their combined footprints in North America, Europe, and Africa.
- In February 2019, Arm and Vodafone announced a strategic agreement to simplify the IoT deployment for organizations. This partnership will leverage the Vodafone IoT global platform and connectivity and will enable Arm’s IoT software and services to provide enterprises with a programmable, connected system on chips which eliminates the need for traditional SIM cards. This would allow customers to securely deploy, remotely provision, and manage massive numbers of IoT devices across global markets at a significantly lower cost and complexity.
- In February 2019, Chunghwa Telecom, Taiwan’s largest telecommunications service provider, partnered with Ericsson to drive enterprise IoT. Ericsson’s IoT Accelerator service with global connectivity management capabilities enable enterprises to deploy, manage, and scale IoT-connected solutions and applications at a much faster speed. Chunghwa’s enterprise customers will be able to control and track their IoT assets with this unified and intuitive connectivity management service.
Frequently Asked Questions (FAQ):
What is IoT Connectivity?
What are the major application areas of IoT connectivity?
Which are the top industry players in the IoT connectivity market?
What are the top trends in IoT connectivity market?
Trends that are impacting the IoT connectivity market includes:
- Proliferation of connected devices
- Need for reliable, secure, and high-speed network connectivity
- Need for integrating the standalone and non-standalone components of IoT ecosystem
Opportunities for the IoT connectivity market:
- Open-Source IoT platforms providing a competitive advantage over traditional connectivity platform providers
- Telcos to move up the IoT Value chain
- Integration of blockchain with IoT
To speak to our analyst for a discussion on the above findings, click Speak to Analyst
Table of Contents
1 Introduction (Page No. - 14)
1.1 Objectives of the Study
1.2 Market Definition
1.3 Market Scope
1.3.1 Market Segmentation
1.4 Years Considered for the Study
1.5 Currency Considered
1.6 Stakeholders
2 Research Methodology (Page No. - 17)
2.1 Research Data
2.1.1 Secondary Data
2.1.2 Primary Data
2.1.2.1 Breakup of Primaries
2.1.2.2 Key Industry Insights
2.2 Market Breakup and Data Triangulation
2.3 Market Size Estimation
2.3.1 Top-Down Approach
2.3.2 Bottom-Up Approach
2.4 Market Forecast
2.5 Competitive Leadership Mapping Research Methodology
2.6 Research Assumptions and Limitations
2.6.1 Assumptions for the Study
2.6.2 Limitations of the Study
3 Executive Summary (Page No. - 25)
4 Premium Insights (Page No. - 29)
4.1 Attractive Opportunities in the IoT Connectivity Market
4.2 Market in Asia Pacific, By Component and Country
4.3 Market Major Countries
5 Market Overview and Industry Trends (Page No. - 31)
5.1 Introduction
5.2 Market Dynamics
5.2.1 Drivers
5.2.1.1 Proliferation of Connected Devices
5.2.1.2 Need for Reliable, Secure, and High-Speed Network Connectivity
5.2.1.3 Need for Integrating the Standalone and Non-Standalone Components of IoT Ecosystem
5.2.2 Opportunities
5.2.2.1 Open-Source IoT Platforms Providing A Competitive Advantage Over Traditional Connectivity Platform Providers
5.2.2.2 Telcos to Move Up the IoT Value Chain
5.2.2.3 Integration of Blockchain With Iot
5.2.3 Challenges
5.2.3.1 Data Security Concerns and Cyberattacks on Connectivity Layer
5.2.3.2 Government Regulations Varying From Country to Country
5.2.3.3 High Bandwidth and Energy Consumption
5.3 Regulatory Implications
5.3.1 ISO Standards
5.3.2 ISO/IEC JTC 1
5.3.2.1 ISO/IEC JTC 1/SWG 5
5.3.2.2 ISO/IEC JTC 1/SC 31
5.3.2.3 ISO/IEC JTC 1/SC 27
5.3.2.4 ISO/IEC JTC 1/WG 7 Sensors
5.3.3 IEEE
5.3.4 CEN/ISO
5.3.5 CEN/CENELEC
5.3.6 ETSI
5.3.7 ITU-T
5.4 Use Cases
5.4.1 Use Case 1: Cisco Jasper Enabling Vivint to Increase Revenues By Adding New Services
5.4.2 Use Case 2: Grundfos Driving Innovation in Water Technology With the Help of Ericsson’s IoT Connectivity Management
5.4.3 Use Case 3: Telit's Asset Tracking and Inventory Management Solutions Helping Restaurant Technologies to Troubleshoot Remotely and Update Telemetry Devices
5.4.4 Use Case 4: Sierra Wireless IoT Enabling Predictive Maintenance to Support Veolia's Premium Service Offering
5.4.5 Use Case 5: Arm’s Pelion Connectivity Management Enabling UK Smart Meter Systems to Deploy, Own, and Manage Smart Metering Assets Throughout the Country
6 IoT Connectivity Market By Component (Page No. - 38)
6.1 Introduction
6.2 Platform
6.2.1 Rising Need for Network Management Through A Single Platform to Drive the Deployment of IoT Connectivity Platform
6.3 Services
6.3.1 Professional Services
6.3.1.1 Consulting
6.3.1.1.1 Demand for Consulting Services on the Rise to Solve IoT Connectivity Challenges
6.3.1.2 Implementation
6.3.1.2.1 Demand for Implementation Services to Grow to Solve Interoperability Issues
6.3.1.3 Support and Maintenance
6.3.1.3.1 Growing Demand for Support and Maintenance Services in the Matured Regions
6.3.2 Managed Services
6.3.2.1 Need for End-To-End Connectivity Management to Drive the Demand for Managed Services
7 IoT Connectivity Market Size By Organization Size (Page No. - 46)
7.1 Introduction
7.2 Large Enterprises
7.2.1 Increasing Number of Connected Devices Across Large Enterprises to Drive the Market
7.3 Small and Medium-Sized Enterprises
7.3.1 Tailor-Made Approach From Vendors to Drive Small and Medium-Sized Enterprises Toward the Adoption of IoT Connectivity Platforms
8 IoT Connectivity Market Size By Application Area (Page No. - 50)
8.1 Introduction
8.2 Smart Retail
8.2.1 Increasing Focus to Provide Seamless Customer Experience to Drive the Need for A Unified IoT Connectivity Platform in Smart Retail
8.3 Smart Manufacturing
8.3.1 Industry 4.0 to Drive the Adoption of IoT Connectivity Platforms
8.4 Connected Health
8.4.1 IoT Connectivity Platform to Enable Seamless Remote Patient Monitoring for Healthcare Providers
8.5 Building and Home Automation
8.5.1 IoT Connectivity is Pervasive for Effective Building Automation
8.6 Smart Transportation
8.6.1 Robust IoT Connectivity Management to Offer Seamless Information Flow to Commuters
8.7 Smart Grid and Utilities
8.7.1 Smart Meter and Smart Grid Initiatives to Drive the Demand for IoT Network Connectivity
8.8 Others
9 IoT Connectivity Market By Region (Page No. - 59)
9.1 Introduction
9.2 North America
9.2.1 United States
9.2.1.1 Early Adoption of the Latest Connectivity Technologies to Drive the Adoption of IoT Connectivity Platform in the Us
9.2.2 Canada
9.2.2.1 Smart Grid Initiatives By the Government to Drive the IoT Connectivity Market Growth in Canada
9.3 Europe
9.3.1 United Kingdom
9.3.1.1 UK Digital Strategy to Boost the Adoption of IoT Connectivity Platform in the Uk
9.3.2 Germany
9.3.2.1 Industrie 4.0 to Boost the Demand for IoT Connectivity in Germany
9.3.3 Rest of Europe
9.4 Asia Pacific
9.4.1 China
9.4.1.1 Complementary Government Initiatives to Drive the Demand for IoT Connectivity Management in China
9.4.2 Japan
9.4.2.1 Government and Enterprises’ Initiatives to Drive the Market in Japan
9.4.3 Rest of Asia Pacific
9.5 Latin America
9.5.1 Brazil
9.5.1.1 Brazilian Government Initiatives to Drive the Growth of the IoT Connectivity Market in Brazil
9.5.2 Mexico
9.5.2.1 Smart Grid and Industry 4.0 Implementation Plans to Drive the Demand for IoT Connectivity in Mexico
9.5.3 Rest of Latin America
9.6 Middle East and Africa
9.6.1 Saudi Arabia
9.6.1.1 Saudi Vision 2030 to Fuel the Adoption of IoT Connectivity Solutions in Saudi Arabia
9.6.2 United Arab Emirates
9.6.2.1 Dubai IoT Strategy to Drive the Adoption of IoT Connectivity Solutions Across UAE
9.6.3 Rest of Middle East and Africa
10 Competitive Landscape (Page No. - 83)
10.1 Competitive Leadership Mapping
10.1.1 Visionary Leaders
10.1.2 Innovators
10.1.3 Dynamic Differentiators
10.1.4 Emerging Companies
10.2 Strength of Product Portfolio
10.3 Business Strategy Excellence
10.4 Ranking of Key Players for the IoT Connectivity Market, 2019
11 Company Profiles (Page No. - 88)
(Business Overview, Products and Services Offered, Recent Developments, and MnM View)*
11.1 Cisco Jasper
11.2 Huawei
11.3 AT&T
11.4 Telefónica
11.5 Ericsson
11.6 Vodafone
11.7 Sierra Wireless
11.8 Orange Business Services
11.9 Verizon Enterprise Solutions
11.10 Telit
11.11 Hologram
11.12 Particle
11.13 Aeris
11.14 Sigfox
11.15 Emnify
11.16 Moeco
*Details on Business Overview, Products and Services Offered, Recent Developments, and MnM View Might Not Be Captured in Case of Unlisted Companies.
12 Appendix (Page No. - 113)
12.1 Discussion Guide
12.2 Knowledge Store: Marketsandmarkets’ Subscription Portal
12.3 Available Customization
12.4 Related Reports
12.5 Author Details
List of Tables (53 Tables)
Table 1 United States Dollar Exchange Rate, 2016–2018
Table 2 Factor Analysis
Table 3 IoT Connectivity Market Size, By Component, 2017–2024 (USD Million)
Table 4 Platform: Market Size By Region, 2017–2024 (USD Million)
Table 5 Services: Market Size By Type, 2017–2024 (USD Million)
Table 6 Services: Market Size By Region, 2017–2024 (USD Million)
Table 7 Professional Services Market Size, By Type, 2017–2024 (USD Million)
Table 8 Consulting Market Size, By Region, 2017–2024 (USD Million)
Table 9 Implementation Market Size, By Region, 2017–2024 (USD Million)
Table 10 Support and Maintenance Market Size, By Region, 2017–2024 (USD Million)
Table 11 Managed Services Market Size, By Region, 2017–2024 (USD Million)
Table 12 IoT Connectivity Market Size, By Organization Size, 2017–2024 (USD Million)
Table 13 Large Enterprises: Market Size By Region, 2017–2024 (USD Million)
Table 14 Small and Medium-Sized Enterprises: Market Size By Region, 2017–2024 (USD Million)
Table 15 IoT Connectivity Market Size, By Application Area, 2017–2024 (USD Million)
Table 16 Smart Retail: Market Size By Region, 2017–2024 (USD Million)
Table 17 Smart Manufacturing: Market Size By Region, 2017–2024 (USD Million)
Table 18 Connected Health: Market Size By Region, 2017–2024 (USD Million)
Table 19 Building and Home Automation: Market Size By Region, 2017–2024 (USD Million)
Table 20 Smart Transportation: Market Size By Region, 2017–2024 (USD Million)
Table 21 Smart Grid and Utilities: Market Size By Region, 2017–2024 (USD Million)
Table 22 Others: Market Size By Region, 2017–2024 (USD Million)
Table 23 IoT Connectivity Market Size, By Region, 2017–2024 (USD Million)
Table 24 North America: Market Size By Component, 2017–2024 (USD Million)
Table 25 North America: Market Size By Service, 2017–2024 (USD Million)
Table 26 North America: Market Size By Professional Service, 2017–2024 (USD Million)
Table 27 North America: Market Size By Organization Size, 2017–2024 (USD Million)
Table 28 North America: Market Size By Application Area, 2017–2024 (USD Million)
Table 29 North America: Market Size By Country, 2017–2024 (USD Million)
Table 30 Europe: IoT Connectivity Market Size, By Component, 2017–2024 (USD Million)
Table 31 Europe: Market Size By Service, 2017–2024 (USD Million)
Table 32 Europe: Market Size By Professional Service, 2017–2024 (USD Million)
Table 33 Europe: Market Size By Organization Size, 2017–2024 (USD Million)
Table 34 Europe: Market Size By Application Area, 2017–2024 (USD Million)
Table 35 Europe: Market Size By Country, 2017–2024 (USD Million)
Table 36 Asia Pacific: IoT Connectivity Market Size, By Component, 2017–2024 (USD Million)
Table 37 Asia Pacific: Market Size By Service, 2017–2024 (USD Million)
Table 38 Asia Pacific: Market Size By Professional Service, 2017–2024 (USD Million)
Table 39 Asia Pacific: Market Size By Organization Size, 2017–2024 (USD Million)
Table 40 Asia Pacific: Market Size By Application Area, 2017–2024 (USD Million)
Table 41 Asia Pacific: Market Size By Country, 2017–2024 (USD Million)
Table 42 Latin America: IoT Connectivity Market Size, By Component, 2017–2024 (USD Million)
Table 43 Latin America: Market Size By Service, 2017–2024 (USD Million)
Table 44 Latin America: Market Size By Professional Service, 2017–2024 (USD Million)
Table 45 Latin America: Market Size By Organization Size, 2017–2024 (USD Million)
Table 46 Latin America: Market Size By Application Area, 2017–2024 (USD Million)
Table 47 Latin America: Market Size By Country, 2017–2024 (USD Million)
Table 48 Middle East and Africa: IoT Connectivity Market Size, By Component, 2017–2024 (USD Million)
Table 49 Middle East and Africa: Market Size By Service, 2017–2024 (USD Million)
Table 50 Middle East and Africa: Market Size By Professional Service, 2017–2024 (USD Million)
Table 51 Middle East and Africa: Market Size By Organization Size, 2017–2024 (USD Million)
Table 52 Middle East and Africa: Market Size By Application Area, 2017–2024 (USD Million)
Table 53 Middle East and Africa: Market Size By Country, 2017–2024 (USD Million)
List of Figures (31 Figures)
Figure 1 IoT Connectivity Market: Research Design
Figure 2 Market Top-Down and Bottom-Up Approaches
Figure 3 Competitive Leadership Mapping: Criteria Weightage
Figure 4 IoT Connectivity Market Size, 2017–2024
Figure 5 Platform Segment to Hold A Larger Market Size During the Forecast Period
Figure 6 Large Enterprises to Account for A Higher Market Share in 2019
Figure 7 Smart Transportation Application Area to Hold the Largest Market Size During the Forecast Period
Figure 8 IoT Connectivity Market: Regional Snapshot
Figure 9 Increase in the Number of Connected Devices to Drive the Market Growth
Figure 10 Platform Segment and China to Dominate the APAC IoT Connectivty Market in 2019
Figure 11 China to Register the Highest CAGR During the Forecast Period
Figure 12 Drivers, Opportunities, and Challenges: IoT Connectivity Market
Figure 13 Platform Segment to Hold A Larger Market Size During the Forecast Period
Figure 14 Large Enterprises Segment to Account for A Larger Market Size During the Forecast Period
Figure 15 Smart Transportation Segment to Account for the Largest Market Size During the Forecast Period
Figure 16 North America to Hold the Largest Market Size During the Forecast Period
Figure 17 Asia Pacific to Grow at the Highest CAGR During the Forecast Period
Figure 18 North America: Market Snapshot
Figure 19 Asia Pacific: Market Snapshot
Figure 20 IoT Connectivity Market (Global) Competitive Leadership Mapping
Figure 21 Ranking of Key Players, 2019
Figure 22 Cisco: Company Snapshot
Figure 23 Huawei: Company Snapshot
Figure 24 AT&T: Company Snapshot
Figure 25 Telefónica: Company Snapshot
Figure 26 Ericsson: Company Snapshot
Figure 27 Vodafone: Company Snapshot
Figure 28 Sierra Wireless: Company Snapshot
Figure 29 Orange: Company Snapshot
Figure 30 Verizon: Company Snapshot
Figure 31 Telit: Company Snapshot
The study involved four major activities in estimating the current size of the IoT connectivity market. Extensive secondary research was done to collect information on the market, the peer market, and the parent market. The next step was to validate these findings, assumptions, and sizing with industry experts across the value chain through primary research. Both top-down and bottom-up approaches were employed to estimate the complete market size. After that, the market breakup and data triangulation procedures were used to estimate the market size of segments and subsegments of the IoT connectivity market.
Secondary Research
In the secondary research process, various secondary sources, such as D&B Hoovers, Bloomberg BusinessWeek, and Factiva, have been referred, to identify and collect information for this study. These secondary sources included annual reports; press releases and investor presentations of companies; whitepapers, certified publications, and articles by recognized authors; gold standard and silver standard websites; Research and Development (R&D) organizations; regulatory bodies; and databases.
Primary Research
Various primary sources from both the supply and demand sides of the IoT connectivity market ecosystem were interviewed to obtain qualitative and quantitative information for this study. The primary sources from the supply side included industry experts, such as Chief Executive Officers (CEOs), Vice Presidents (VPs), marketing directors, technology and innovation directors, and related key executives from various vendors who provide IoT connectivity in the targeted regions. All possible parameters that affect the market covered in this research study have been accounted for, viewed in extensive detail, verified through primary research, and analyzed to get the final quantitative and qualitative data. The following is the breakup of the primary respondents’ profiles:
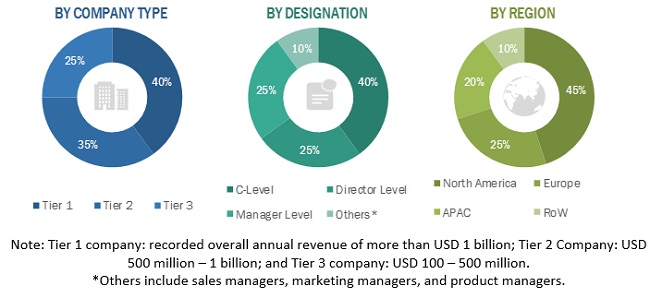
To know about the assumptions considered for the study, download the pdf brochure
IoT Connectivity Market Size Estimation
To make market estimations and forecast the IoT connectivity market and the other dependent submarkets, the top-down and bottom-up approaches were used. The bottom-up procedure was used to arrive at the overall size of the global market using the revenues and offerings of the key companies in the market. The research methodology used to estimate the market size includes the following:
- The key players in the market were identified through extensive secondary research.
- The market size, in terms of value, was determined through primary and secondary research processes.
- All percentage shares, splits, and breakups were determined using secondary sources and verified through primary sources.
Data Triangulation
With data triangulation and validation through primary interviews, the exact value of the overall parent market size was determined and confirmed using this study. The overall market size was then used in the top-down procedure to estimate the size of other individual markets via percentage splits of the market segmentation.
Report Objectives
- To define, describe, and forecast the IoT connectivity market based on component (platform and services), organization size (large enterprises, and SMEs), application areas, and region.
- To provide detailed information related to the major factors, such as drivers, restraints, opportunities, and challenges, influencing the growth of the market
- To analyze the market subsegments with respect to individual growth trends, prospects, and contributions to the total market
- To analyze the opportunities in the market for stakeholders and provide the competitive landscape of the market
- To forecast the revenue of the market segments with respect to five major regions, namely North America, Europe, Asia Pacific (APAC), Latin America, and Middle East & Africa (MEA).
- To profile the key players and comprehensively analyze their recent developments and positioning in the market
- To analyze the competitive developments, such as mergers and acquisitions, new product developments, and R&D activities in the market
Critical Questions the Report Answers:
- Where will all these developments take the industry in the long term?
- What are the upcoming trends for the IoT connectivity market?
- Which segment provides the most opportunity for growth?
- Who are the leading vendors operating in this market?
- What are the opportunities for new market entrants?
Available Customizations
With the given market data, MarketsandMarkets offers customizations as per the company’s specific requirements. The following customization options are available for the report:
Product Analysis
- Product matrix provides detailed product information and comparisons
Geographic Analysis
- Further breakup of the North American IoT connectivity market
- Further breakup of the European market
- Further breakup of the APAC market
- Further breakup of the Latin American market
- Further breakup of the MEA market
Company Information
- Detailed analysis and profiling of additional market players


Growth opportunities and latent adjacency in IoT Connectivity Market