LED Packaging Market

LED Packaging Market Size, Share, Industry Growth & Trends by Package Type (SMD, COB, CSP), Power Range (Low-&Mid-Power LED Packages, High-Power LED Packages), Wavelength (Visible & Infrared, Deep UV), Packaging Component (Equipment, Material), Application & Region - Global Forecast to 2029

Report Code: SE 5858 Feb, 2024, by marketsandmarkets.com

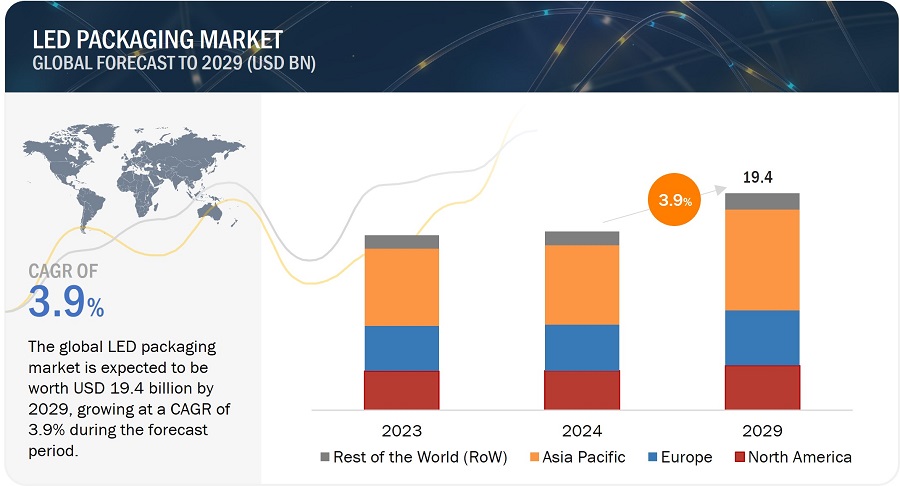
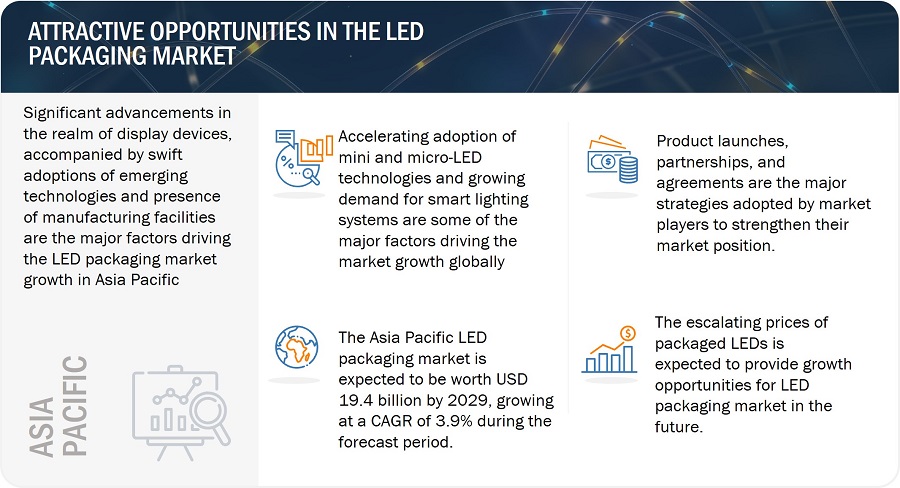
[225 Pages Report] The LED packaging market is estimated to be worth USD 16.0 billion in 2024 and is projected to reach USD 19.4 billion by 2029, at a CAGR of 3.9% during the forecast period. The acceleration adoption of mini and micro-LED technologies and growing demand for smart lighting systems are some of the major factors driving the market growth of LED packaging globally.
LED Packaging Market

LED Packaging Market

LED Packaging Market Forecast to 2029

To know about the assumptions considered for the study, Request for Free Sample Report

LED Packaging Market Dynamics

Driver: Growing demand for smart lighting systems

The increasing demand for smart lighting solutions is expected to be a key driver in the LED packaging market. Smart lighting solutions presents a compelling proposition for businesses and homeowners as it offers substantial energy savings in comparison to traditional lighting alternatives. This energy efficiency, coupled with the growing awareness of sustainability, makes smart lighting a preferrable choice. The integration of artificial intelligence (AI) and machine learning (ML) into smart lighting systems further enhances their appeal, that provides personalized and efficient lighting solutions that can adapt to user preferences and environmental conditions. Therefore, the growing demand for smart lighting systems is expected to drive the growth of LED packaging market.

Restraint: Saturation of LED packaging market

The market saturation of LED packaging gives rise to various challenges that create challenges towards product acceptance, market growth, and profit margins. As the LED packaging market is a saturated market due to numerous manufacturers that are offering similar LED packaging solutions, the differentiation between these products may diminish. This will lead to a situation where customers may restrain themselves towards adopting new products, due to the large number of existing options that fulfill the basic requirements. This decline in product adoption is a key factor that restricts the overall growth of the LED packaging market.

Opportunity: The escalating adoption of mini and micro-LED technologies

The surge in demand for mini and micro-LED technologies is attributed to several factors such as technological advancements, energy efficiency, and IoT connectivity which propels the growth of the LED packaging market. This ongoing transition towards the adoption of mini and micro-LED technologies requires specialized packaging solutions to accommodate the smaller form factors, advanced technological features, and precise requirements. Furthermore, the technological advancements in chip design and assembly processes for mini and micro-LED have led to the growing need for innovative LED packaging.

Challenge:  Absence of common open standards

The absence of common open standards for LED packaging can impact growth and adoption of the LED packaging market. The lack of standardized specifications and protocols creates a fragmented landscape wherein different component suppliers may use diverse standards or proprietary formats which leads to a lack of coordination and compatibility among various elements of LED packaging systems. This lack of coordination can result in inefficiencies in LED performance that hinders the overall advancement and acceptance of LED packaging technologies.

LED Packaging Market Ecosystem

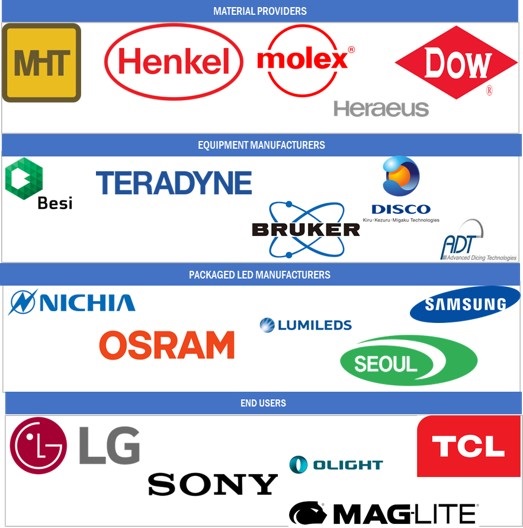
The prominent players in the LED packaging market are NICHIA CORPORATION (Japan), ams-OSRAM AG. (Austria), Samsung (South Korea), Lumileds Holding B.V. (US), and Seoul Semiconductor Co., Ltd. (South Korea). These companies perform organic and inorganic growth strategies to expand themselves globally by providing new and advanced packaged LED solutions.
LED Packaging Market by Ecosystem

High-power LED packages to register highest CAGR in the LED packaging market during forecast period

The high-power LED packages market experiences a surge in demand driven by the increasing need from smartphone manufacturers to integrate high-power LEDs into flash lighting modules. This integration allows smartphone cameras to deliver excellent image quality in low-light environments. Additionally, factors such as lower power consumption, enhanced luminescence efficiency, and the growing prevalence of high-brightness applications contribute significantly to the expansion of the LED packaging market.

Others segment that includes applications such as disinfection, counterfeit detection, sensing devices, and keyboards is expected to have the highest CAGR in the LED packaging market during the forecast period.

The growing need for UV LEDs is anticipated to boost the market demand for LED packages in the future. UV LEDs in the UV-C band have the potential to revolutionize sterilization and disinfection practices that contribute towards safer conditions in medical facilities. Therefore, others segment that include applications such as disinfection, counterfeit detection, sensing devices, and keyboards is expected to have the highest CAGR in the LED packaging market during the forecast period.

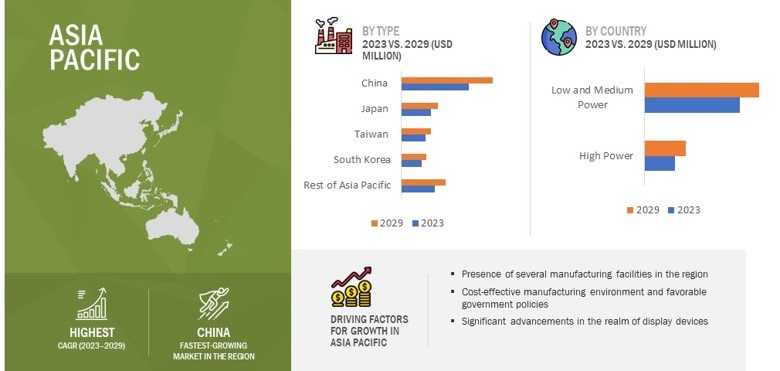
Europe is expected to register for the second highest CAGR in the LED packaging during the forecast period

The expansion of the LED packaging market in Europe is attributed to the substantial growth in automotive and general lighting applications marked by technological advancements within these industries. Additionally, the increasing demand for emerging technologies like microLED, particularly in backlighting applications drives the market growth of LED packaging in Europe.
LED Packaging Market
 by Region

LED Packaging Market by Region

To know about the assumptions considered for the study, download the pdf brochure

Key Market Players

The major players in the LED packaging companies include NICHIA CORPORATION (Japan), ams-OSRAM AG. (Austria), Samsung (South Korea), Lumileds Holding B.V. (US), and Seoul Semiconductor Co., Ltd. (South Korea). These companies have used both organic and inorganic growth strategies such as product launches, partnerships, and agreements to strengthen their position in the market.

Get online access to the report on the World's First Market Intelligence Cloud

  • Easy to Download Historical Data & Forecast Numbers
  • Company Analysis Dashboard for high growth potential opportunities
  • Research Analyst Access for customization & queries
  • Competitor Analysis with Interactive dashboard
  • Latest News, Updates & Trend analysis
Request Sample

Scope of the Report

Report Metric

Details

Market size available for years

2020–2029

Base year considered

2023

Forecast period

2024–2029

Forecast units

Value (USD Million/Billion), Volume (Million Units)

Segments covered

By Packaging Component, Package Type, Power Range, Wavelength, Application, and Region

Geographies covered

North America, Europe, Asia Pacific, and Rest of the World (RoW)

Companies covered

The major players in the LED packaging market are NICHIA CORPORATION (Japan), ams-OSRAM AG. (Austria), Samsung (South Korea), Lumileds Holding B.V. (US), Seoul Semiconductor Co., Ltd. (South Korea), MLS CO, LTD (China), EVERLIGHT ELECTRONICS CO., LTD. (Taiwan), SMART Global Holdings, Inc. (US), Foshan NationStar Optoelectronics Co. Ltd (China), and LITE-ON Technology, Inc. (Taiwan).

LED Packaging Market Highlights

The study segments the LED packaging market based on packaging component, package type, power range, wavelength, application, and region at the regional and global level.

Segment

Subsegment

By Packaging Component

  • Equipment
    • Bonding Equipment
    • Assembly and Packaging Equipment
    • Testing Equipment
    • Others (Metrology and Dicing)

By Package Type

  • SMD
  • COB
  • CSP
  • Others
    • DIP
    • COF

By Power Range

  • Low-& Mid-Power LED Packages
  • High-Power LED Packages

By Wavelength

  • Visible & Infrared
  • Deep UV

By Application

  • General Lighting
  • Automotive Lighting
  • Backlighting
  • Flash Lighting
  • Industrial
  • Others (disinfection, counterfeit detection, etc.)

By Region

    • North America
      • US
      • Canada
      • Mexico
    • Europe
      • UK
      • Germany
      • France
      • Rest of Europe
    • Asia Pacific
      • China
      • Japan
      • Taiwan
      • South Korea
      • Rest of Asia Pacific
  • Rest of the World (RoW)
    • Middle East & Africa
      • Gulf Cooperation Council (GCC)
      • Rest of Middle East & Africa
  • South America

Recent Developments

  • In August 2021, NICHIA CORPORATION announced a joint-product development and collaboration with Zumtobel, an international supplier of holistic lighting solutions, to manufacture LED lighting with advanced human-centric lighting benefits.
  • In September 2023, ams-OSRAM AG. And Malaysian Investment Development Authority (MIDA) announced a collaborative agreement in which MIDA significantly supports the initiative of ams-OSRAM AG to expand in Malaysia.
  • In May 2023, Lumileds Holding B.V. announced the broadening of its CoB offerings by introducing LUXEON Core and LUXEON CX and the new LUXEON CS board sizes for enhanced design flexibility,
  • In May 2023, Seoul Semiconductor Co., Ltd. announced the launch of the 2nd-generation LED technology, WICOP Pixel microLED technology, for future displays such as WICOP-Pixel-based microLED displays and Low Blue Light (LBL) displays that maintains the health of the users’ eyes.
  • In September 2023, Samsung announced the launch of a new LED solution for outdoor lighting, 5050 LED. The 5050 LED possess enhanced reliability, performance, and cost efficiency.

Frequently Asked Questions (FAQs):

To speak to our analyst for a discussion on the above findings, click Speak to Analyst

TABLE OF CONTENTS
 
1 INTRODUCTION (Page No. - 31)
    1.1 OBJECTIVES OF THE STUDY 
    1.2 MARKET DEFINITION 
    1.3 STUDY SCOPE 
           1.3.1 MARKETS COVERED
                    FIGURE 1 LED PACKAGING MARKET: SEGMENTATION
           1.3.2 GEOGRAPHIC SCOPE
                    FIGURE 2 LED PACKAGING MARKET: GEOGRAPHIC SCOPE
           1.3.3 INCLUSIONS AND EXCLUSIONS
                    1.3.3.1 Inclusions and exclusions: Company level
                    1.3.3.2 Inclusions and exclusions: Package type level
                    1.3.3.3 Inclusions and exclusions: Packaging component level
                    1.3.3.4 Inclusions and exclusions: Power range level
                    1.3.3.5 Inclusions and exclusions: Wavelength level
                    1.3.3.6 Inclusions and exclusions: Application level
                    1.3.3.7 Inclusions and exclusions: Region level
           1.3.4 YEARS CONSIDERED
           1.3.5 CURRENCY CONSIDERED
           1.3.6 UNITS CONSIDERED
    1.4 LIMITATIONS 
    1.5 STAKEHOLDERS 
    1.6 SUMMARY OF CHANGES 
           1.6.1 RECESSION IMPACT
 
2 RESEARCH METHODOLOGY (Page No. - 37)
    2.1 RESEARCH APPROACH 
           FIGURE 3 LED PACKAGING MARKET: RESEARCH DESIGN
           2.1.1 SECONDARY DATA
                    2.1.1.1 Major secondary sources
                    2.1.1.2 Key data from secondary sources
           2.1.2 PRIMARY DATA
                    2.1.2.1 Primary interviews with experts
                    2.1.2.2 List of key primary interview participants
                    2.1.2.3 Breakdown of primaries
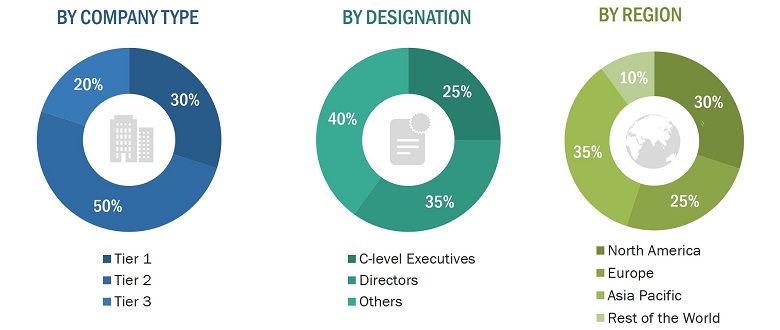
                               FIGURE 4 BREAKDOWN OF PRIMARIES, BY COMPANY TYPE, DESIGNATION, AND REGION
                    2.1.2.4 Key data from primary sources
                               TABLE 1 KEY DATA FROM PRIMARY SOURCES
           2.1.3 SECONDARY AND PRIMARY RESEARCH
                    FIGURE 5 SECONDARY AND PRIMARY RESEARCH
                    2.1.3.1 Key industry insights
                               FIGURE 6 KEY INDUSTRY INSIGHTS
    2.2 MARKET SIZE ESTIMATION 
           2.2.1 BOTTOM-UP APPROACH
                    FIGURE 7 BOTTOM-UP APPROACH
           2.2.2 TOP-DOWN APPROACH
                    FIGURE 8 TOP-DOWN APPROACH
    2.3 FACTOR ANALYSIS 
           2.3.1 DEMAND-SIDE ANALYSIS
                    FIGURE 9 MARKET SIZE ESTIMATION: DEMAND-SIDE ANALYSIS
           2.3.2 SUPPLY-SIDE ANALYSIS
                    FIGURE 10 MARKET SIZE ESTIMATION: SUPPLY-SIDE ANALYSIS
           2.3.3 GROWTH FORECAST ASSUMPTIONS
                    TABLE 2 MARKET GROWTH ASSUMPTIONS
    2.4 RECESSION IMPACT ANALYSIS 
    2.5 MARKET BREAKDOWN AND DATA TRIANGULATION 
           FIGURE 11 DATA TRIANGULATION
    2.6 RESEARCH ASSUMPTIONS 
           TABLE 3 RESEARCH ASSUMPTIONS: LED PACKAGING MARKET
    2.7 RISK ASSESSMENT 
           TABLE 4 RISK ASSESSMENT: LED PACKAGING MARKET
 
3 EXECUTIVE SUMMARY (Page No. - 50)
    FIGURE 12 LED PACKAGING MARKET GROWTH, 2020–2029
    FIGURE 13 LED PACKAGING EQUIPMENT MARKET GROWTH, 2020–2029
    FIGURE 14 SMD PACKAGE TYPE SEGMENT TO DOMINATE LED PACKAGING MARKET DURING FORECAST PERIOD
    FIGURE 15 HIGH-POWER LED POWER RANGE SEGMENT TO REGISTER HIGHER CAGR DURING FORECAST PERIOD
    FIGURE 16 LED PACKAGES IN DEEP UV WAVELENGTH TO REGISTER HIGHER CAGR DURING FORECAST PERIOD
    FIGURE 17 GENERAL LIGHTING SEGMENT TO LEAD LED PACKAGING MARKET DURING FORECAST PERIOD
    FIGURE 18 TESTING EQUIPMENT SEGMENT TO LEAD LED PACKAGING EQUIPMENT MARKET FROM 2024 TO 2029
    FIGURE 19 ASIA PACIFIC TO DOMINATE LED PACKAGING MARKET DURING FORECAST PERIOD
 
4 PREMIUM INSIGHTS (Page No. - 56)
    4.1 ATTRACTIVE GROWTH OPPORTUNITIES FOR PLAYERS IN LED PACKAGING MARKET 
           FIGURE 20 GROWING DEMAND FOR SMART LIGHTING SOLUTIONS TO DRIVE MARKET GROWTH
    4.2 LED PACKAGING MARKET, BY PACKAGE TYPE 
           FIGURE 21 SMD LED PACKAGE SEGMENT TO DOMINATE LED PACKAGING MARKET DURING FORECAST PERIOD
    4.3 LED PACKAGING MARKET, BY WAVELENGTH 
           FIGURE 22 VISIBLE & INFRARED SEGMENT TO ACCOUNT FOR LARGER SHARE OF LED PACKAGING MARKET DURING FORECAST PERIOD
    4.4 LED PACKAGING MARKET, BY POWER RANGE 
           FIGURE 23 LOW-& MID-POWER LED PACKAGES TO DOMINATE LED PACKAGING MARKET IN 2024 AND 2029
    4.5 LED PACKAGING MARKET, BY APPLICATION 
           FIGURE 24 GENERAL LIGHTING SEGMENT TO LEAD LED PACKAGING MARKET DURING FORECAST PERIOD
    4.6 LED PACKAGING MARKET, BY PACKAGING COMPONENT 
           FIGURE 25 TESTING EQUIPMENT SEGMENT TO BE LARGEST IN LED PACKAGING EQUIPMENT MARKET IN 2024 AND 2029
    4.7 LED PACKAGING MARKET IN ASIA PACIFIC, BY PACKAGE TYPE AND COUNTRY, 2023 
           FIGURE 26 SMD SEGMENT AND CHINA ACCOUNTED FOR LARGEST SHARES OF LED PACKAGING MARKET IN ASIA PACIFIC, IN 2023
 
5 MARKET OVERVIEW (Page No. - 60)
    5.1 INTRODUCTION 
    5.2 MARKET DYNAMICS 
           FIGURE 27 MARKET DYNAMICS: LED PACKAGING MARKET
           5.2.1 DRIVERS
                    5.2.1.1 Growing demand for UV LED-based disinfection systems
                    5.2.1.2 Increasing demand for smart lighting solutions
                    5.2.1.3 Growing adoption of packaged LEDs in automotive lighting solutions
                               FIGURE 28 GLOBAL SALES OF ELECTRIC VEHICLES, 2019-2021
                    5.2.1.4 Surging prices of packaged LEDs
                               FIGURE 29 IMPACT ANALYSIS OF DRIVERS ON LED PACKAGING MARKET
           5.2.2 RESTRAINTS
                    5.2.2.1 Market saturation
                               FIGURE 30 IMPACT ANALYSIS OF RESTRAINTS ON LED PACKAGING MARKET
           5.2.3 OPPORTUNITIES
                    5.2.3.1 Surging adoption of mini and micro-LED technologies
                    5.2.3.2 Development of advanced LED packaging technologies
                               FIGURE 31 IMPACT ANALYSIS OF OPPORTUNITIES IN LED PACKAGING MARKET
           5.2.4 CHALLENGES
                    5.2.4.1 Lack of common open standards
                               FIGURE 32 IMPACT ANALYSIS OF CHALLENGES ON LED PACKAGING MARKET
    5.3 SUPPLY CHAIN ANALYSIS 
           FIGURE 33 SUPPLY CHAIN ANALYSIS: LED PACKAGING MARKET
           TABLE 5 LED PACKAGING MARKET: SUPPLY CHAIN ANALYSIS
    5.4 ECOSYSTEM/MARKET MAP 
           FIGURE 34 LED PACKAGING MARKET: ECOSYSTEM/MARKET MAP
    5.5 KEY TECHNOLOGY TRENDS 
           5.5.1 MICRO LED IN PACKAGE (MIP)
           5.5.2 CHIP-SCALE PACKAGE (CSP)
           5.5.3 CHIP-ON-BOARD (COB)
           5.5.4 CHIP-ON-WAFER-ON-SUBSTRATE (COWOS)
           5.5.5 PHOSPHOR-CONVERTED WHITE LED
    5.6 PRICING ANALYSIS 
           5.6.1 AVERAGE SELLING PRICE OF PRODUCTS, BY KEY PLAYER
           FIGURE 35 AVERAGE SELLING PRICE OF PRODUCTS OFFERED BY KEY PLAYERS
           TABLE 6 AVERAGE SELLING PRICE OF SMD LEDS, COB LEDS, AND CSP LEDS OFFERED BY KEY PLAYERS
           5.6.2 AVERAGE SELLING PRICE TREND
                    5.6.2.1 Average selling price trend of LED packaging, by package type
                               FIGURE 36 AVERAGE SELLING PRICE TREND OF LED PACKAGING, BY PACKAGE TYPE
                    5.6.2.2 Average selling price trend of LED packaging, by region
                               FIGURE 37 AVERAGE SELLING PRICE TREND FOR SMD LEDS, BY REGION
    5.7 LIST OF KEY PATENTS AND INNOVATIONS 
           TABLE 7 PATENTS FILED DURING REVIEW PERIOD
           FIGURE 38 NUMBER OF PATENTS GRANTED FOR LED PACKAGING
           FIGURE 39 TOP 10 COMPANIES WITH HIGHEST NUMBER OF PATENTS GRANTED (JANUARY 2012-DECEMBER 2023)
           TABLE 8 TOP 20 PATENT OWNERS DURING 2013–2023
           TABLE 9 KEY PATENTS RELATED TO LED PACKAGING
    5.8 PORTER’S FIVE FORCES ANALYSIS 
           TABLE 10 LED PACKAGING MARKET: PORTER’S FIVE FORCES ANALYSIS
           FIGURE 40 LED PACKAGING MARKET: PORTER’S FIVE FORCES ANALYSIS–2023
           FIGURE 41 IMPACT OF PORTER’S FIVE FORCES ON LED PACKAGING MARKET, 2023
           5.8.1 THREAT OF NEW ENTRANTS
           5.8.2 THREAT OF SUBSTITUTES
           5.8.3 BARGAINING POWER OF SUPPLIERS
           5.8.4 BARGAINING POWER OF BUYERS
           5.8.5 INTENSITY OF COMPETITIVE RIVALRY
    5.9 KEY STAKEHOLDERS & BUYING CRITERIA 
           5.9.1 KEY STAKEHOLDERS IN BUYING PROCESS
                    FIGURE 42 INFLUENCE OF STAKEHOLDERS ON BUYING PROCESS
                    TABLE 11 INFLUENCE OF STAKEHOLDERS ON BUYING PROCESS
           5.9.2 BUYING CRITERIA
                    FIGURE 43 KEY BUYING CRITERIA FOR TOP THREE LED PACKAGE TYPES
                    TABLE 12 KEY BUYING CRITERIA FOR TOP THREE LED PACKAGE TYPES
    5.10 CASE STUDIES 
           5.10.1 LEVERAGING NICHIA’S HUMAN-CENTRIC LIGHTING TECHNOLOGIES TO ENHANCE OVERALL SHOPPING EXPERIENCE FOR RETAIL CUSTOMERS
           5.10.2 OSRAM’S OSLON P1616 SERIES MINIATURE HIGH-POWER INFRARED LED TO OFFER COMPACT DESIGN, HIGH-EFFICIENCY, LOW-ENERGY LIGHTING FOR SHINING 3D’S AORALSCAN 3I INTRAORAL SCANNER
           5.10.3 INTEGRATION OF LUMILEDS LUXEON 3535 HV LED IN AUDAX ELECTRONICS’ WALL SCONCES, WALL PACKS, BOLLARDS, AND PENDANTS TO DELIVER REASONABLY PRICED LED-BASED FIXTURES
           5.10.4 INTEGRATION OF LUXEON 4014 LOW-POWER LEDS IN JASCO PRODUCT FIXTURES REDUCED FIXTURE SIZE AND ENHANCED PERFORMANCE EFFICIENCY
    5.11 TRADE ANALYSIS 
           TABLE 13 IMPORT DATA FOR HS CODE 8541, BY COUNTRY, 2018-2022 (USD MILLION)
           FIGURE 44 IMPORT DATA FOR HS CODE 8541, 2018-2022
           TABLE 14 EXPORT DATA FOR HS CODE 8541, BY COUNTRY 2018-2022 (USD MILLION)
           FIGURE 45 EXPORT DATA FOR HS CODE 8541, 2018-2022
    5.12 REGULATORY LANDSCAPE FOR LED PACKAGING MARKET 
           5.12.1 GLOBAL
           5.12.2 EUROPE
           5.12.3 ASIA PACIFIC
           5.12.4 NORTH AMERICA
           5.12.5 GOVERNMENT REGULATIONS
                    5.12.5.1 Asia Pacific
                    5.12.5.2 North America
                    5.12.5.3 Europe
    5.13 TRENDS/DISRUPTIONS IMPACTING CUSTOMERS’ BUSINESSES 
           FIGURE 46 REVENUE SHIFTS FOR LED PACKAGING MARKET
    5.14 KEY CONFERENCES & EVENTS, 2024–2025 
           TABLE 15 LED PACKAGING MARKET: DETAILED LIST OF CONFERENCES & EVENTS
 
6 LED PACKAGING MARKET, BY PACKAGING COMPONENT (Page No. - 90)
    6.1 INTRODUCTION 
    6.2 EQUIPMENT 
           TABLE 16 LED PACKAGING EQUIPMENT MARKET, BY TYPE, 2020–2023 (USD MILLION)
           FIGURE 47 TESTING EQUIPMENT TO LEAD MARKET DURING FORECAST PERIOD
           TABLE 17 LED PACKAGING EQUIPMENT MARKET, BY TYPE, 2024–2029 (USD MILLION)
           6.2.1 BONDING EQUIPMENT
                    6.2.1.1 High performance, reliability, and cost-effectiveness to drive market
           6.2.2 ENCAPSULATION & PACKAGING EQUIPMENT
                    6.2.2.1 Reliability and damage resistance properties to support usage
           6.2.3 TESTING EQUIPMENT
                    6.2.3.1 Evaluation of performance, quality, and safety of LED lighting products to drive market
           6.2.4 OTHER EQUIPMENT
    6.3 MATERIALS 
           6.3.1 LEAD FRAMES
                    6.3.1.1 Facilitation of electrical and mechanical connections between chip and package to drive market
           6.3.2 SUBSTRATES
                    6.3.2.1 Optimized performance, reliability, and functionality across various applications to drive market
           6.3.3 INTERCONNECTS (ADHESIVES)
                    6.3.3.1 Need to ensure robust bonds between LED chip and substrate to drive market
           6.3.4 HOUSING MATERIALS
                    6.3.4.1 Need to ensure mechanical protection of LED chips and other components to drive market
           6.3.5 ENCAPSULANTS
                    6.3.5.1 Better sealing and protective barrier against moisture, dust, and contaminants to drive market
 
7 LED PACKAGING MARKET, BY PACKAGING METHOD (Page No. - 96)
    7.1 INTRODUCTION 
    7.2 MESA (HORIZONTAL) 
    7.3 VERTICAL 
    7.4 FLIP-CHIP 
 
8 LED PACKAGING MARKET, BY PACKAGE TYPE (Page No. - 98)
    8.1 INTRODUCTION 
           FIGURE 48 LED PACKAGING MARKET FOR CSP LEDS TO GROW AT HIGHEST CAGR DURING FORECAST PERIOD
           TABLE 18 LED PACKAGING MARKET, BY PACKAGE TYPE, 2020–2023 (USD MILLION)
           TABLE 19 LED PACKAGING MARKET, BY PACKAGE TYPE, 2024–2029 (USD MILLION)
    8.2 SMD 
           8.2.1 INCREASED PACKING DENSITY, LOWER PRODUCTION COST, AND USE OF SMALLER PCBS TO DRIVE MARKET
                    TABLE 20 SMD: LED PACKAGING MARKET, BY REGION, 2020–2023 (USD MILLION)
                    TABLE 21 SMD: LED PACKAGING MARKET, BY REGION, 2024–2029 (USD MILLION)
                    TABLE 22 SMD: LED PACKAGING MARKET, 2020–2023 (MILLION UNITS)
                    TABLE 23 SMD: LED PACKAGING MARKET, 2024–2029 (MILLION UNITS)
    8.3 COB 
           8.3.1 INCREASING DEMAND FOR IMPROVED LUMEN-PER-WATT RATIOS AND HEAT-EFFICIENT LED TECHNOLOGIES TO DRIVE MARKET
                    TABLE 24 COB: LED PACKAGING MARKET, BY REGION, 2020–2023 (USD MILLION)
                    TABLE 25 COB: LED PACKAGING MARKET, BY REGION, 2024–2029 (USD MILLION)
                    TABLE 26 COB: LED PACKAGING MARKET, 2020–2023 (MILLION UNITS)
                    TABLE 27 COB: LED PACKAGING MARKET, 2024–2029 (MILLION UNITS)
    8.4 CSP 
           8.4.1 HIGH OPTICAL DENSITY, EXCELLENT LUMEN MAINTENANCE, COLOR STABILITY, REDUCED CURRENT CONSUMPTION, AND IMPROVED RELIABILITY TO DRIVE MARKET
                    TABLE 28 CSP: LED PACKAGING MARKET, BY REGION, 2020–2023 (USD MILLION)
                    TABLE 29 CSP: LED PACKAGING MARKET, BY REGION, 2024–2029 (USD MILLION)
                    TABLE 30 CSP: LED PACKAGING MARKET, 2020–2023 (MILLION UNITS)
                    TABLE 31 CSP: LED PACKAGING MARKET, 2024–2029 (MILLION UNITS)
    8.5 OTHER PACKAGE TYPES 
           TABLE 32 OTHER PACKAGE TYPES: LED PACKAGING MARKET, BY REGION, 2020–2023 (USD MILLION)
           TABLE 33 OTHER PACKAGE TYPES: LED PACKAGING MARKET, BY REGION, 2024–2029 (USD MILLION)
           8.5.1 DUAL INLINE PACKAGE (DIP)
           8.5.2 CHIP-ON-FLEX (COF)
 
9 LED PACKAGING MARKET, BY POWER RANGE (Page No. - 106)
    9.1 INTRODUCTION 
           FIGURE 49 LED PACKAGING MARKET FOR HIGH-POWER LED PACKAGES TO GROW AT HIGHER CAGR DURING FORECAST PERIOD
           TABLE 34 LED PACKAGING MARKET, BY POWER RANGE, 2020–2023 (USD MILLION)
           TABLE 35 LED PACKAGING MARKET, BY POWER RANGE, 2024–2029 (USD MILLION)
    9.2 LOW- & MID-POWER LED PACKAGES 
           9.2.1 INCREASING ADOPTION IN GENERAL LIGHTING, BACKLIGHTING, AND AUTOMOTIVE LIGHTING TO DRIVE MARKET
                    TABLE 36 LOW- & MID-POWER LED PACKAGES: LED PACKAGING MARKET, BY REGION, 2020–2023 (USD MILLION)
                    TABLE 37 LOW- & MID-POWER LED PACKAGES: LED PACKAGING MARKET, BY REGION, 2024–2029 (USD MILLION)
    9.3 HIGH-POWER LED PACKAGES 
           9.3.1 DEMAND FOR INTENSE LUMINESCENCE OR BRIGHT DIRECTIONAL LIGHT ACROSS APPLICATIONS TO DRIVE MARKET
                    TABLE 38 HIGH-POWER LED PACKAGES: LED PACKAGING MARKET, BY REGION, 2020–2023 (USD MILLION)
                    TABLE 39 HIGH-POWER LED PACKAGES: LED PACKAGING MARKET, BY REGION, 2024–2029 (USD MILLION)
 
10 LED PACKAGING MARKET, BY WAVELENGTH (Page No. - 110)
     10.1 INTRODUCTION 
             FIGURE 50 DEEP UV LEDS TO REGISTER HIGHER CAGR DURING FORECAST PERIOD
             TABLE 40 LED PACKAGING MARKET, BY WAVELENGTH, 2020–2023 (USD MILLION)
             TABLE 41 LED PACKAGING MARKET, BY WAVELENGTH, 2024–2029 (USD MILLION)
     10.2 VISIBLE & INFRARED 
             10.2.1 GROWING DEMAND FOR HUMAN-CENTRIC LIGHTING TO ENSURE MARKET GROWTH
                        TABLE 42 VISIBLE & INFRARED: LED PACKAGING MARKET, BY REGION, 2020–2023 (USD MILLION)
                        TABLE 43 VISIBLE & INFRARED: LED PACKAGING MARKET, BY REGION, 2024–2029 (USD MILLION)
     10.3 DEEP UV 
             10.3.1 RISING NEED FOR STERILIZATION AND DISINFECTION TO DRIVE MARKET
                        TABLE 44 DEEP UV: LED PACKAGING MARKET, BY REGION, 2020–2023 (USD MILLION)
                        TABLE 45 DEEP UV: LED PACKAGING MARKET, BY REGION, 2024–2029 (USD MILLION)
 
11 MATERIALS USED IN LED PACKAGING (Page No. - 115)
     11.1 INTRODUCTION 
     11.2 PLASTICS 
     11.3 NANOCERAMICS 
     11.4 CERAMICS 
             11.4.1 LEDS WITH A SINTERED CERAMIC PACKAGE
             11.4.2 LEDS WITH CERAMIC SUBSTRATE COMBINED WITH SILICONE
             11.4.3 LEDS WITH CERAMIC SUBSTRATE AND GLASS
     11.5 SILICONE MATERIALS 
     11.6 EPOXY MOLDING COMPOUNDS 
     11.7 METAL ALLOYS 
     11.8 POLYMERS 
     11.9 GLASS COMPOSITES 
     11.1 OTHER MATERIALS 
             11.10.1 BONDING WIRES
             11.10.2 SILICON CARBIDE SUBSTRATES
             11.10.3 SAPPHIRE SUBSTRATES
             11.10.4 GRAPHENE
 
12 LED PACKAGING MARKET, BY APPLICATION (Page No. - 119)
     12.1 INTRODUCTION 
             FIGURE 51 GENERAL LIGHTING SEGMENT TO DOMINATE LED PACKAGING MARKET DURING FORECAST PERIOD
             TABLE 46 LED PACKAGING MARKET, BY APPLICATION, 2020–2023 (USD MILLION)
             TABLE 47 LED PACKAGING MARKET, BY APPLICATION, 2024–2029 (USD MILLION)
     12.2 GENERAL LIGHTING 
             12.2.1 RISING USE OF ENERGY-EFFICIENT LEDS AND NEED FOR REDUCED CARBON FOOTPRINT TO DRIVE MARKET
                        FIGURE 52 OUTDOOR & COMMERCIAL LIGHTING SEGMENT TO REGISTER HIGHER CAGR IN GENERAL LIGHTING APPLICATIONS DURING FORECAST PERIOD
                        TABLE 48 GENERAL LIGHTING: LED PACKAGING MARKET, BY TYPE, 2020–2023 (USD MILLION)
                        TABLE 49 GENERAL LIGHTING: LED PACKAGING MARKET, BY TYPE, 2024–2029 (USD MILLION)
                        TABLE 50 GENERAL LIGHTING: LED PACKAGING MARKET, BY REGION, 2020–2023 (USD MILLION)
                        TABLE 51 GENERAL LIGHTING: LED PACKAGING MARKET, BY REGION, 2024–2029 (USD MILLION)
                        TABLE 52 RESIDENTIAL: LED PACKAGING MARKET, BY REGION, 2020–2023 (USD MILLION)
                        TABLE 53 RESIDENTIAL: LED PACKAGING MARKET, BY REGION, 2024–2029 (USD MILLION)
                        TABLE 54 OUTDOOR & COMMERCIAL LIGHTING: LED PACKAGING MARKET, BY REGION, 2020–2023 (USD MILLION)
                        TABLE 55 OUTDOOR & COMMERCIAL LIGHTING: LED PACKAGING MARKET, BY REGION, 2024–2029 (USD MILLION)
     12.3 AUTOMOTIVE LIGHTING 
             12.3.1 HIGHER PERFORMANCE, IMPROVED SAFETY, AND APPEALING DESIGNS IN AUTOMOTIVE LIGHTING TO INCREASE USAGE
                        FIGURE 53 EXTERIOR LIGHTING SEGMENT TO AUTOMOTIVE LIGHTING APPLICATION DURING FORECAST PERIOD
                        TABLE 56 AUTOMOTIVE LIGHTING: LED PACKAGING MARKET, BY TYPE, 2020–2023 (USD MILLION)
                        TABLE 57 AUTOMOTIVE LIGHTING: LED PACKAGING MARKET, BY TYPE, 2024–2029 (USD MILLION)
                        TABLE 58 AUTOMOTIVE LIGHTING: LED PACKAGING MARKET, BY REGION, 2020–2023 (USD MILLION)
                        TABLE 59 AUTOMOTIVE LIGHTING: PACKAGED LED MARKET, BY REGION, 2024–2029 (USD MILLION)
                        TABLE 60 INTERIOR LIGHTING: LED PACKAGING MARKET, BY REGION, 2020–2023 (USD MILLION)
                        TABLE 61 INTERIOR LIGHTING: LED PACKAGING MARKET, BY REGION, 2024–2029 (USD MILLION)
                        TABLE 62 EXTERIOR LIGHTING: LED PACKAGING MARKET, BY REGION, 2020–2023 (USD MILLION)
                        TABLE 63 EXTERIOR LIGHTING: LED PACKAGING MARKET, BY REGION, 2024–2029 (USD MILLION)
     12.4 BACKLIGHTING 
             12.4.1 RISING DEMAND FOR EMERGING DISPLAY TECHNOLOGIES SUCH AS MICRO-LED AND QUANTUM DOT DISPLAYS TO DRIVE MARKET
                        TABLE 64 BACKLIGHTING: LED PACKAGING MARKET, BY REGION, 2020–2023 (USD MILLION)
                        TABLE 65 BACKLIGHTING: LED PACKAGING MARKET, BY REGION, 2024–2029 (USD MILLION)
     12.5 FLASH LIGHTING 
             12.5.1 GROWING ADOPTION OF LED-BASED FLASHLIGHTS IN SMARTPHONES TO DRIVE MARKET
                        TABLE 66 FLASH LIGHTING: LED PACKAGING MARKET, BY REGION, 2020–2023 (USD MILLION)
                        TABLE 67 FLASH LIGHTING: LED PACKAGING MARKET, BY REGION, 2024–2029 (USD MILLION)
     12.6 INDUSTRIAL LIGHTING 
             12.6.1 RISING EMPHASIS ON SMART LIGHTING FOR COST REDUCTION TO DRIVE MARKET
                        TABLE 68 INDUSTRIAL LIGHTING: LED PACKAGING MARKET, BY REGION, 2020–2023 (USD MILLION)
                        TABLE 69 INDUSTRIAL LIGHTING: LED PACKAGING MARKET, BY REGION, 2024–2029 (USD MILLION)
     12.7 OTHER APPLICATIONS 
             TABLE 70 OTHER APPLICATIONS: LED PACKAGING MARKET, BY REGION, 2020–2023 (USD MILLION)
             TABLE 71 OTHER APPLICATIONS: LED PACKAGING MARKET, BY REGION, 2024–2029 (USD MILLION)
 
13 LED PACKAGING MARKET, BY REGION (Page No. - 132)
     13.1 INTRODUCTION 
             FIGURE 54 CHINA TO REGISTER HIGHEST CAGR IN LED PACKAGING MARKET FROM 2024 TO 2029
             TABLE 72 LED PACKAGING MARKET, BY REGION, 2020–2023 (USD BILLION)
             TABLE 73 LED PACKAGING MARKET, BY REGION, 2024–2029 (USD BILLION)
     13.2 NORTH AMERICA 
             FIGURE 55 NORTH AMERICA: LED PACKAGING MARKET SNAPSHOT
             TABLE 74 NORTH AMERICA: LED PACKAGING MARKET, BY COUNTRY, 2020–2023 (USD MILLION)
             TABLE 75 NORTH AMERICA: LED PACKAGING MARKET, BY COUNTRY, 2024–2029 (USD MILLION)
             TABLE 76 NORTH AMERICA: LED PACKAGING MARKET, BY APPLICATION, 2020–2023 (USD MILLION)
             TABLE 77 NORTH AMERICA: LED PACKAGING MARKET, BY APPLICATION, 2024–2029 (USD MILLION)
             TABLE 78 NORTH AMERICA: LED PACKAGING MARKET, BY POWER RANGE, 2020–2023 (USD MILLION)
             TABLE 79 NORTH AMERICA: LED PACKAGING MARKET, BY POWER RANGE, 2024–2029 (USD MILLION)
             TABLE 80 NORTH AMERICA: LED PACKAGING MARKET, BY WAVELENGTH, 2020–2023 (USD MILLION)
             TABLE 81 NORTH AMERICA: LED PACKAGING MARKET, BY WAVELENGTH, 2024–2029 (USD MILLION)
             TABLE 82 NORTH AMERICA: LED PACKAGING MARKET, BY PACKAGE TYPE, 2020–2023 (USD MILLION)
             TABLE 83 NORTH AMERICA: LED PACKAGING MARKET, BY PACKAGE TYPE, 2024–2029 (USD MILLION)
             TABLE 84 NORTH AMERICA: LED PACKAGING MARKET FOR AUTOMOTIVE LIGHTING, BY TYPE, 2020–2023 (USD MILLION)
             TABLE 85 NORTH AMERICA: LED PACKAGING MARKET FOR AUTOMOTIVE LIGHTING, BY TYPE, 2024–2029 (USD MILLION)
             TABLE 86 NORTH AMERICA: LED PACKAGING MARKET FOR GENERAL LIGHTING, BY TYPE, 2020–2023 (USD MILLION)
             TABLE 87 NORTH AMERICA: LED PACKAGING MARKET FOR GENERAL LIGHTING, BY TYPE, 2024–2029 (USD MILLION)
             13.2.1 NORTH AMERICA: RECESSION IMPACT
             13.2.2 US
                        13.2.2.1 Increasing adoption of LEDs for energy-efficient building systems to drive market
             13.2.3 CANADA
                        13.2.3.1 Rising government initiatives to promote use of EVs and drive market
             13.2.4 MEXICO
                        13.2.4.1 Increasing demand for efficient lighting systems and growing adoption of LEDs for automotive lighting to drive market
     13.3 EUROPE 
             FIGURE 56 EUROPE: LED PACKAGING MARKET SNAPSHOT
             TABLE 88 EUROPE: LED PACKAGING MARKET, BY COUNTRY, 2020–2023 (USD MILLION)
             TABLE 89 EUROPE: LED PACKAGING MARKET, BY COUNTRY, 2024–2029 (USD MILLION)
             TABLE 90 EUROPE: LED PACKAGING MARKET, BY APPLICATION, 2020–2023 (USD MILLION)
             TABLE 91 EUROPE: LED PACKAGING MARKET, BY APPLICATION, 2024–2029 (USD MILLION)
             TABLE 92 EUROPE: LED PACKAGING MARKET, BY POWER RANGE, 2020–2023 (USD MILLION)
             TABLE 93 EUROPE: LED PACKAGING MARKET, BY POWER RANGE, 2024–2029 (USD MILLION)
             TABLE 94 EUROPE: LED PACKAGING MARKET, BY WAVELENGTH, 2020–2023 (USD MILLION)
             TABLE 95 EUROPE: LED PACKAGING MARKET, BY WAVELENGTH, 2024–2029 (USD MILLION)
             TABLE 96 EUROPE: LED PACKAGING MARKET, BY PACKAGE TYPE, 2020–2023 (USD MILLION)
             TABLE 97 EUROPE: LED PACKAGING MARKET, BY PACKAGE TYPE, 2024–2029 (USD MILLION)
             TABLE 98 EUROPE: LED PACKAGING MARKET FOR AUTOMOTIVE LIGHTING, BY TYPE, 2020–2023 (USD MILLION)
             TABLE 99 EUROPE: LED PACKAGING MARKET FOR AUTOMOTIVE LIGHTING, BY TYPE, 2024–2029 (USD MILLION)
             TABLE 100 EUROPE: LED PACKAGING MARKET FOR GENERAL LIGHTING, BY TYPE, 2020–2023 (USD MILLION)
             TABLE 101 EUROPE: LED PACKAGING MARKET FOR GENERAL LIGHTING, BY TYPE, 2024–2029 (USD MILLION)
             13.3.1 EUROPE: RECESSION IMPACT
             13.3.2 GERMANY
                        13.3.2.1 Favorable trade scenarios and rising demand for energy-efficient lighting solutions to drive market
             13.3.3 FRANCE
                        13.3.3.1 Efforts to reduce carbon footprint to drive market
             13.3.4 UK
                        13.3.4.1 Rising government initiatives toward energy-efficient lighting solutions to drive market
             13.3.5 REST OF EUROPE
     13.4 ASIA PACIFIC 
             FIGURE 57 ASIA PACIFIC: LED PACKAGING MARKET SNAPSHOT
             TABLE 102 ASIA PACIFIC: LED PACKAGING MARKET, BY COUNTRY, 2020–2023 (USD MILLION)
             TABLE 103 ASIA PACIFIC: LED PACKAGING MARKET, BY COUNTRY, 2024–2029 (USD MILLION)
             TABLE 104 ASIA PACIFIC: LED PACKAGING MARKET, BY APPLICATION, 2020–2023 (USD MILLION)
             TABLE 105 ASIA PACIFIC: LED PACKAGING MARKET, BY APPLICATION, 2024–2029 (USD MILLION)
             TABLE 106 ASIA PACIFIC: LED PACKAGING MARKET, BY POWER RANGE, 2020–2023 (USD MILLION)
             TABLE 107 ASIA PACIFIC: LED PACKAGING MARKET, BY POWER RANGE, 2024–2029 (USD MILLION)
             TABLE 108 ASIA PACIFIC: LED PACKAGING MARKET, BY WAVELENGTH, 2020–2023 (USD MILLION)
             TABLE 109 ASIA PACIFIC: LED PACKAGING MARKET, BY WAVELENGTH, 2024–2029 (USD MILLION)
             TABLE 110 ASIA PACIFIC: LED PACKAGING MARKET, BY PACKAGE TYPE, 2020–2023 (USD MILLION)
             TABLE 111 ASIA PACIFIC: LED PACKAGING MARKET, BY PACKAGE TYPE, 2024–2029 (USD MILLION)
             TABLE 112 ASIA PACIFIC: LED PACKAGING MARKET FOR AUTOMOTIVE LIGHTING, BY TYPE, 2020–2023 (USD MILLION)
             TABLE 113 ASIA PACIFIC: LED PACKAGING MARKET FOR AUTOMOTIVE LIGHTING, BY TYPE, 2024–2029 (USD MILLION)
             TABLE 114 ASIA PACIFIC: LED PACKAGING MARKET FOR GENERAL LIGHTING, BY TYPE, 2020–2023 (USD MILLION)
             TABLE 115 ASIA PACIFIC: LED PACKAGING MARKET FOR GENERAL LIGHTING, BY TYPE, 2024–2029 (USD MILLION)
             13.4.1 ASIA PACIFIC: RECESSION IMPACT
             13.4.2 CHINA
                        13.4.2.1 Presence of major display panel manufacturers to drive market
             13.4.3 JAPAN
                        13.4.3.1 Demand from major automotive manufacturers to drive market
             13.4.4 TAIWAN
                        13.4.4.1 Ongoing technological advancements toward energy-efficient technologies to drive market
             13.4.5 SOUTH KOREA
                        13.4.5.1 Presence of established semiconductor device manufacturers to drive market
             13.4.6 REST OF ASIA PACIFIC
     13.5 REST OF THE WORLD 
             TABLE 116 REST OF THE WORLD: LED PACKAGING MARKET, BY REGION, 2020–2023 (USD MILLION)
             TABLE 117 REST OF THE WORLD: LED PACKAGING MARKET, BY REGION, 2024–2029 (USD MILLION)
             TABLE 118 MIDDLE EAST & AFRICA: LED PACKAGING MARKET, BY REGION, 2020–2023 (USD MILLION)
             TABLE 119 MIDDLE EAST & AFRICA: LED PACKAGING MARKET, BY REGION, 2024–2029 (USD MILLION)
             TABLE 120 REST OF THE WORLD: LED PACKAGING MARKET, BY APPLICATION, 2020–2023 (USD MILLION)
             TABLE 121 REST OF THE WORLD: LED PACKAGING MARKET, BY APPLICATION, 2024–2029 (USD MILLION)
             TABLE 122 REST OF THE WORLD: LED PACKAGING MARKET, BY POWER RANGE, 2020–2023 (USD MILLION)
             TABLE 123 REST OF THE WORLD: LED PACKAGING MARKET, BY POWER RANGE, 2024–2029 (USD MILLION)
             TABLE 124 REST OF THE WORLD: LED PACKAGING MARKET, BY WAVELENGTH, 2020–2023 (USD MILLION)
             TABLE 125 REST OF THE WORLD: LED PACKAGING MARKET, BY WAVELENGTH, 2024–2029 (USD MILLION)
             TABLE 126 REST OF THE WORLD: LED PACKAGING MARKET, BY PACKAGE TYPE, 2020–2023 (USD MILLION)
             TABLE 127 REST OF THE WORLD: LED PACKAGING MARKET, BY PACKAGE TYPE, 2024–2029 (USD MILLION)
             TABLE 128 REST OF THE WORLD: LED PACKAGING MARKET FOR AUTOMOTIVE LIGHTING, BY TYPE, 2020–2023 (USD MILLION)
             TABLE 129 REST OF THE WORLD: LED PACKAGING MARKET FOR AUTOMOTIVE LIGHTING, BY TYPE, 2024–2029 (USD MILLION)
             TABLE 130 REST OF THE WORLD: LED PACKAGING MARKET FOR GENERAL LIGHTING, BY TYPE, 2020–2023 (USD MILLION)
             TABLE 131 REST OF THE WORLD: LED PACKAGING MARKET FOR GENERAL LIGHTING, BY TYPE, 2024–2029 (USD MILLION)
             13.5.1 REST OF THE WORLD: RECESSION IMPACT
             13.5.2 MIDDLE EAST & AFRICA
                        13.5.2.1 Growing investments in R&D for smart lighting solutions to drive market
                        13.5.2.2 GCC countries
                                     13.5.2.2.1 Growing measures supporting use of low-power and cost-effective lighting solutions to drive market
                        13.5.2.3 Rest of Middle East & Africa
             13.5.3 SOUTH AMERICA
                        13.5.3.1 Supportive government initiatives to favor adoption of low-power LEDs
 
14 COMPETITIVE LANDSCAPE (Page No. - 161)
     14.1 INTRODUCTION 
     14.2 MARKET EVALUATION FRAMEWORK 
             TABLE 132 OVERVIEW OF STRATEGIES DEPLOYED BY KEY LED PACKAGING PLAYERS
             FIGURE 58 COMPANIES ADOPTED ACQUISITIONS AS KEY GROWTH STRATEGY FROM 2019–2023
             14.2.1 ORGANIC/INORGANIC GROWTH STRATEGIES
             14.2.2 PRODUCT PORTFOLIO
             14.2.3 GEOGRAPHIC PRESENCE
             14.2.4 MANUFACTURING FOOTPRINT
     14.3 MARKET SHARE ANALYSIS, 2023 
             TABLE 133 MARKET SHARE ANALYSIS OF KEY COMPANIES, 2023
     14.4 HISTORICAL REVENUE ANALYSIS OF MAJOR MARKET PLAYERS 
             14.4.1 HISTORICAL REVENUE ANALYSIS, 2018–2022
                        FIGURE 59 HISTORICAL REVENUE ANALYSIS OF MAJOR COMPANIES, 2018–2022 (USD BILLION)
     14.5 COMPANY EVALUATION MATRIX: KEY PLAYERS 
             14.5.1 STARS
             14.5.2 EMERGING LEADERS
             14.5.3 PERVASIVE PLAYERS
             14.5.4 PARTICIPANTS
                        FIGURE 60 LED PACKAGING MARKET (GLOBAL): COMPANY EVALUATION MATRIX (KEY PLAYERS), 2023
             14.5.5 COMPANY FOOTPRINT
                        TABLE 134 COMPANY PRODUCT FOOTPRINT
                        TABLE 135 COMPANY PACKAGE TYPE FOOTPRINT
                        TABLE 136 COMPANY APPLICATION FOOTPRINT
                        TABLE 137 COMPANY REGION FOOTPRINT
     14.6 COMPANY EVALUATION MATRIX: STARTUPS/SMES 
             14.6.1 PROGRESSIVE COMPANIES
             14.6.2 RESPONSIVE COMPANIES
             14.6.3 DYNAMIC COMPANIES
             14.6.4 STARTING BLOCKS
                        FIGURE 61 LED PACKAGING MARKET (GLOBAL): COMPANY EVALUATION MATRIX (STARTUPS/SMES), 2023
             14.6.5 COMPETITIVE BENCHMARKING
                        TABLE 138 LED PACKAGING MARKET: DETAILED LIST OF KEY STARTUPS/SMES
                        TABLE 139 COMPETITIVE BENCHMARKING FOR STARTUPS/SMES: PACKAGE TYPE
                        TABLE 140 COMPETITIVE BENCHMARKING FOR STARTUPS/SMES: APPLICATION
                        TABLE 141 COMPETITIVE BENCHMARKING OF STARTUP/SMES: REGION
     14.7 COMPETITIVE SCENARIO 
             14.7.1 PRODUCT LAUNCHES
                        TABLE 142 LED PACKAGING MARKET: PRODUCT LAUNCHES, 2021–2023
             14.7.2 DEALS
                        TABLE 143 DEALS, 2021–2023
 
15 COMPANY PROFILES (Page No. - 178)
     15.1 INTRODUCTION 
     15.2 KEY PLAYERS 
(Business Overview, Products/Solutions/Services Offered, Recent Developments, MnM view (Key strengths/Right to win, Strategic choices made, Weakness/competitive threats)*  
             15.2.1 NICHIA CORPORATION
                        TABLE 144 NICHIA CORPORATION: COMPANY OVERVIEW
                        TABLE 145 NICHIA CORPORATION: PRODUCT LAUNCHES
                        TABLE 146 NICHIA CORPORATION: DEALS
             15.2.2 AMS-OSRAM AG.
                        TABLE 147 AMS-OSRAM AG.: COMPANY OVERVIEW
                        FIGURE 62 AMS-OSRAM AG.: COMPANY SNAPSHOT
                        TABLE 148 AMS-OSRAM AG.: PRODUCT LAUNCHES
                        TABLE 149 AMS-OSRAM AG.: DEALS
             15.2.3 SAMSUNG
                        TABLE 150 SAMSUNG: COMPANY OVERVIEW
                        FIGURE 63 SAMSUNG: COMPANY SNAPSHOT
                        TABLE 151 SAMSUNG: PRODUCT LAUNCHES
             15.2.4 LUMILEDS HOLDING B.V.
                        TABLE 152 LUMILEDS HOLDING B.V.: COMPANY OVERVIEW
                        TABLE 153 LUMILEDS HOLDING B.V.: PRODUCT LAUNCHES
             15.2.5 SEOUL SEMICONDUCTOR CO., LTD.
                        TABLE 154 SEOUL SEMICONDUCTOR CO., LTD.: COMPANY OVERVIEW
                        FIGURE 64 SEOUL SEMICONDUCTOR CO., LTD.: COMPANY SNAPSHOT
                        TABLE 155 SEOUL SEMICONDUCTOR CO., LTD.: PRODUCT LAUNCHES
             15.2.6 MLS CO, LTD.
                        TABLE 156 MLS CO, LTD.: COMPANY OVERVIEW
             15.2.7 EVERLIGHT ELECTRONICS CO., LTD.
                        TABLE 157 EVERLIGHT ELECTRONICS CO., LTD.: COMPANY OVERVIEW
                        FIGURE 65 EVERLIGHT ELECTRONICS CO., LTD.: COMPANY SNAPSHOT
                        TABLE 158 EVERLIGHT ELECTRONICS CO., LTD.: PRODUCT LAUNCHES
             15.2.8 SMART GLOBAL HOLDINGS, INC.
                        TABLE 159 SMART GLOBAL HOLDINGS, INC.: COMPANY OVERVIEW
                        FIGURE 66 SMART GLOBAL HOLDINGS, INC.: COMPANY SNAPSHOT
                        TABLE 160 SMART GLOBAL HOLDINGS, INC.: PRODUCT LAUNCHES
                        TABLE 161 SMART GLOBAL HOLDINGS, INC.: DEALS
             15.2.9 FOSHAN NATIONSTAR OPTOELECTRONICS CO. LTD.
                        TABLE 162 FOSHAN NATIONSTAR OPTOELECTRONICS CO. LTD.: COMPANY OVERVIEW
                        TABLE 163 FOSHAN NATIONSTAR OPTOELECTRONICS CO. LTD.: PRODUCT LAUNCHES
             15.2.10 LITE-ON TECHNOLOGY, INC.
                        TABLE 164 LITE-ON TECHNOLOGY, INC.: COMPANY OVERVIEW
                        FIGURE 67 LITE-ON TECHNOLOGY, INC.: COMPANY SNAPSHOT
                        TABLE 165 LITE-ON TECHNOLOGY, INC.: PRODUCT LAUNCHES
                        TABLE 166 LITE-ON TECHNOLOGY, INC.: DEALS
     15.3 OTHER PLAYERS 
             15.3.1 STANLEY ELECTRIC CO., LTD.
             15.3.2 HONGLI ZHIHUI GROUP CO., LTD.
             15.3.3 LEXTAR ELECTRONICS CORPORATION
             15.3.4 PROLIGHT OPTO TECHNOLOGY CORP.
             15.3.5 EDISON OPTO CORP.
             15.3.6 SCHOTT
             15.3.7 CITIZEN ELECTRONICS CO., LTD.
             15.3.8 TSLC
             15.3.9 VIOLUMAS
             15.3.10 LUMINUS, INC.
             15.3.11 HARVATEK CORPORATION
             15.3.12 LUCKYLIGHT ELECTRONICS CO., LTD
             15.3.13 BRIDGELUX, INC
             15.3.14 US KOREA HOTLINK
             15.3.15 LUMEX INC.
*Details on Business Overview, Products/Solutions/Services Offered, Recent Developments, MnM view (Key strengths/Right to win, Strategic choices made, Weakness/competitive threats)* might not be captured in case of unlisted companies.  
 
16 APPENDIX (Page No. - 218)
     16.1 INSIGHTS FROM INDUSTRY EXPERTS 
     16.2 DISCUSSION GUIDE 
     16.3 KNOWLEDGESTORE: MARKETSANDMARKETS’ SUBSCRIPTION PORTAL 
     16.4 CUSTOMIZATION OPTIONS 
     16.5 RELATED REPORTS 
     16.6 AUTHOR DETAILS 


The research study involved 4 major activities in estimating the size of the LED packaging market. Exhaustive secondary research has been done to collect important information about the market and peer markets. The validation of these findings, assumptions, and sizing with the help of primary research with industry experts across the supply chain has been the next step. Both top-down and bottom-up approaches have been used to estimate the market size. Post which the market breakdown and data triangulation have been adopted to estimate the market sizes of segments and sub-segments.

Secondary Research

In the secondary research process, various secondary sources have been referred to for identifying and collecting information required for this study. The secondary sources include annual reports, press releases, and investor presentations of companies, white papers, and articles from recognized authors. Secondary research has been mainly done to obtain key information about the market’s value chain, the pool of key market players, market segmentation according to industry trends, regional outlook and developments from both market and technology perspectives.

Primary Research

In primary research, various primary sources from both supply and demand sides have been interviewed to obtain qualitative and quantitative insights required for this report. Primary sources from supply side include experts such as CEOs, vice presidents, marketing directors, manufacturers, technology and innovation directors, end users and related executives from multiple key companies and organizations operating in the LED packaging market ecosystem.
LED Packaging Market
 Size, and Share

To know about the assumptions considered for the study, download the pdf brochure

Market Size Estimation

In the market engineering process, both top-down and bottom-up approaches have been used along with data triangulation methods to estimate and validate the size of the LED packaging market and other dependent submarkets. The research methodology used to estimate the market sizes includes the following:

  • Identifying stakeholders in the LED packaging market that influence the entire market, along with participants across the value chain.
  • Analyzing major manufacturers of LED packaging and studying their product portfolios
  • Analyzing trends related to the adoption of LED packaging
  • Tracking the recent and upcoming developments in the market that include investments, R&D activities, product launches, partnerships and agreements, as well as forecasting the market size based on these developments and other critical parameters
  • Carrying out multiple discussions with key opinion leaders to identify the adoption trends of packaged LEDs
  • Segmenting the overall market into various other market segments
  • Validating the estimates at every level through discussions with key opinion leaders, such as chief executives (CXOs), directors, and operation managers, and finally with the domain experts at MarketsandMarkets

Market Size Estimation Methodology-Bottom-up Approach

LED Packaging Market
 Size, and Bottom-up Approach

Market Size Estimation Methodology-Top-down Approach

LED Packaging Market
 Size, and Top-down Approach

Data Triangulation

After arriving at the overall market size by the market size estimation process explained in the earlier section, the overall LED packaging market has been divided into several segments and subsegments. To complete the overall market engineering process and arrive at the exact statistics for all segments, the data triangulation and market breakdown procedures have been used, wherever applicable. The data has been triangulated by studying various factors and trends from both the demand and supply side perspectives. Along with data triangulation and market breakdown, the market has been validated by top-down and bottom-up approaches.

Market Definition

LED packages are defined as assemblies that house LED chip(s). Through packaging, LED chips and welded lead wires are protected from being in contact with the external environment. Also, packaging improves luminescence efficiency and ensures that diode chips function properly, and export visible light effectively. LED packages have empowered the lighting industry to overcome the challenges of high lumen maintenance and high-power consumption and helped in the extension of lifespan and reduction of carbon footprint. Various types of LED packages, including surface-mount device package (SMD), chip-on-board package (COB), chip-scale package (CSP), dual in-line package (DIP), and chip-on-flex (COF) LEDs, are available for various end-use applications. Package type refers to how LED semiconductor dies are integrated into LED technology-based devices used in different applications. Various applications of LED packages include general lighting, automotive lighting, backlighting, flash lighting, and industrial, among others.

Stakeholders

  • Raw material suppliers
  • Equipment manufacturers
  • Material Suppliers
  • Packaged LED manufacturer
  • Semiconductor product designers and fabricators
  • Regulatory bodies
  • Semiconductor intellectual property vendors
  • Assembly, testing, and packaging vendors
  • Distributors and Resellers
  • End Users

The main objectives of this study are as follows:

  • To define, analyze and forecast the LED packaging market size, by package type, packaging component, power range, wavelength, application, and region, in terms of value.
  • To define, analyze and forecast the LED packaging market size, by package type, in terms of volume
  • To forecast the market size for various segments with respect to four main regions, namely, North America, Europe, Asia Pacific, and Rest of the World
  • To provide detailed information regarding the major drivers, restraints, opportunities, and challenges influencing the growth of the LED packaging market
  • To study the complete value chain and related industry segments for the LED packaging market
  • To strategically analyze the micromarkets1 with respect to individual growth trends, prospects, and contributions to the total market
  • To analyze the market ecosystem; trends/disruptions impacting customer’s business; technology analysis; pricing analysis; Porter’s five forces model; key stakeholders & buying criteria; case study analysis; trade analysis; patent analysis; key conferences & events, 2024–2025; and tariff and regulations related to the LED packaging market.
  • To analyze opportunities in the market for various stakeholders by identifying the high-growth segments of the market.
  • To strategically profile the key players and comprehensively analyze their market position in terms of ranking and core competencies2, along with detailing the competitive landscape for the market leaders.
  • To analyze competitive developments such as product launches, partnerships, agreements, and research and development (R&D) activities carried out by players in the LED packaging market.

Customizations Options:

With the given market data, MarketsandMarkets offers customizations according to the company’s specific needs. The following customization options are available for the report:

Company Information

  • Detailed analysis and profiling of additional market players (up to 5)

Geographic Information

  • Detailed analysis of additional countries (up to 5)
Custom Market Research Services

We will customize the research for you, in case the report listed above does not meet with your exact requirements. Our custom research will comprehensively cover the business information you require to help you arrive at strategic and profitable business decisions.

Request Customization

Instant Answers with GPT - Ask Now!

Ask real questions. Get complete answers !
Report Code
SE 5858
Published ON
Feb, 2024
Choose License Type
BUY NOW
  • SHARE
X
Request Customization
Speak to Analyst
Speak to Analyst
OR FACE-TO-FACE MEETING
PERSONALIZE THIS RESEARCH
  • Triangulate with your Own Data
  • Get Data as per your Format and Definition
  • Gain a Deeper Dive on a Specific Application, Geography, Customer or Competitor
  • Any level of Personalization
REQUEST A FREE CUSTOMIZATION
LET US HELP YOU!
  • What are the Known and Unknown Adjacencies Impacting the LED Packaging Market
  • What will your New Revenue Sources be?
  • Who will be your Top Customer; what will make them switch?
  • Defend your Market Share or Win Competitors
  • Get a Scorecard for Target Partners
CUSTOMIZED WORKSHOP REQUEST
+1-888-600-6441
  • Call Us
  • +1-888-600-6441 (Corporate office hours)
  • +1-888-600-6441 (US/Can toll free)
  • +44-800-368-9399 (UK office hours)
CONNECT WITH US
ABOUT TRUST ONLINE
©2024 MarketsandMarkets Research Private Ltd. All rights reserved
DMCA.com Protection Status Website Feedback