Livestock Grow Lights Market by Type (Fluorescent, Light-Emitting Diode (LED), Incandescent, and Hid), Livestock (Cattle, Poultry, Swine, and Others), Installation Type (Retrofit and New Installation), and Region - Global Forecast to 2023


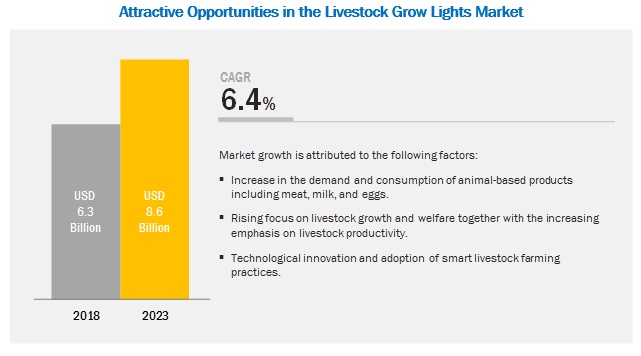
[135 Pages Report] The livestock grow lights market is projected to reach USD 8.6 billion by 2023, growing at a CAGR of 6.4% during the forecast period. This is attributed to technological innovations and the adoption of smart livestock farming practices. However, the increase in the demand and consumption of livestock-based products and the rising focus on livestock growth and welfare together with the emphasis on livestock productivity drives the demand for using grow lights in livestock barns.
By type, the LED segment is projected to witness the fastest growth in the livestock grow lights market during the forecast period.
The LED segment is projected to witness the fastest growth due to its significant energy savings and longer durability properties. In addition, it is more energy-efficient with one-fifth of the power consumption of incandescent bulbs. LED grow lights provide a wide range of spectrum from blue to red that can be customized to the desired spectrum as per the spectral sensitivity of the livestock. By optimizing different spectrum levels and radiation, farmers could create lighting environment that is best suited for their livestock�s wellbeing.
The cattle segment is projected to account for the largest market share during the forecast period
Based on the livestock segment, the market is estimated to be dominated by the cattle segment in 2018. In dairy farms, grow lights help in improving the output of milk production from dairy cattle; whereas in beef cattle, grow lights are used to stimulate muscle growth to increase meat production. Further, the constantly rising demand for dairy & dairy-based products including milk, cheese, yogurt, and butter in both, developed and developing economies are projected to drive the demand for grow lights in cattle farms.
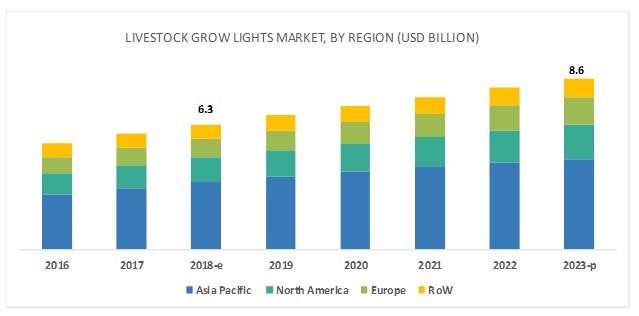
Asia Pacific is projected to account for the largest market share during the forecast period.
The Asia Pacific market accounted for the largest share in the livestock grow lights market. The large market share in this region is attributed to the presence of large livestock population (FAO STATISTICS 2016) and their growth. Furthermore, the rising number of livestock farms and the growing size of existing farms are also projected to contribute to the large market of the Asia Pacific region.
Key Market Players
The major vendors in the global market are OSRAM (Germany), Signify Holding (Netherlands), DeLaval (Sweden), Big Dutchman (Germany), Uni-light LED (Sweden), Once Inc. (US), AGRILIGHT BV (Netherlands), Aruna Lighting (Netherlands), HATO BV (Netherlands), Shenzhen Hontech-Wins (China), CBM Lighting (Canada), Fienhage Poultry Solutions (Germany), SUNBIRD (South Africa), ENIM UAB (Lithuania), and Greengage Lighting (UK). These players have broad industry coverage and strong operational and financial strength; they have grown organically and inorganically in the recent past. The industry players, such as Once Inc. (US) launched AgriShift HL-UVA, a 3-Watt LED in January 2017, which provides stimulus for feeding and promotes animal health. Moreover, key industry players such as Big Dutchman (Germany) launched Zeus in October 2016, the first LED lamp with replaceable parts, which is cost-efficient for the poultry farmers.
Get online access to the report on the World's First Market Intelligence Cloud
- Easy to Download Historical Data & Forecast Numbers
- Company Analysis Dashboard for high growth potential opportunities
- Research Analyst Access for customization & queries
- Competitor Analysis with Interactive dashboard
- Latest News, Updates & Trend analysis
Request Sample Scope of the Report
Get online access to the report on the World's First Market Intelligence Cloud
- Easy to Download Historical Data & Forecast Numbers
- Company Analysis Dashboard for high growth potential opportunities
- Research Analyst Access for customization & queries
- Competitor Analysis with Interactive dashboard
- Latest News, Updates & Trend analysis

Report Metric |
Details |
|
Market size available for years |
2016-2023 |
|
Base year considered |
2017 |
|
Forecast period |
2018-2023 |
|
Forecast units |
Value (USD Million) & Volume (Thousand units) |
|
Segments covered |
Type, Livestock, Installation type, and Region |
|
Geographies covered |
North America, Europe, Asia Pacific, and RoW |
|
Companies covered |
OSRAM (Germany), Signify Holding (Netherlands), DeLaval (Sweden), Big Dutchman (Germany), Uni-light LED (Sweden), Once Inc. (US), AGRILIGHT BV (Netherlands), Aruna Lighting (Netherlands), HATO BV (Netherlands), Shenzhen Hontech-Wins (China), CBM Lighting (Canada), Fienhage Poultry Solutions (Germany), SUNBIRD (South Africa), ENIM UAB (Lithuania), and Greengage Lighting (UK) |
This research report categorizes the livestock grow lights market based on type, livestock, installation type, color type, and region.
On the basis of type, the market has been segmented as follows:
- Fluorescent
- LED
- Incandescent
- HID
On the basis of livestock, the market has been segmented as follows:
- Cattle
- Dairy cattle
- Beef cattle
- Poultry
- Broilers
- Layers
- Turkey
- Swine
- Starter
- Sow
- Grower
- Others (horse, sheep, and goat)
On the basis of installation type, the market has been segmented as follows:
- Retrofit
- New installation
On the basis of color type, the market has been segmented as follows (qualitative):
- Green
- Red
- White
- Blue
On the basis of region, the market has been segmented as follows:
- North America
- Europe
- Asia Pacific
- RoW (South America, Africa, and the Middle East)
Key Questions addressed by the report:
- Who are the major market players in livestock grow lights market?
- What are the regional growth trends and the largest revenue-generating regions for livestock grow lights?
- Which are the major regions that are projected to witness a significant growth for livestock grow lights?
- What are the major types of livestock grow lights that are projected to gain maximum market revenue and share during the forecast period?
- Which is the major type of livestock where grow lights are used that will be accounting for majority of the revenue over the forecast period?
To speak to our analyst for a discussion on the above findings, click Speak to Analyst
Table of Contents
1 Introduction (Page No. - 15)
1.1 Objectives of the Study
1.2 Market Definition
1.3 Market Segmentation
1.4 Regions Covered
1.5 Periodization Considered for the Study
1.6 Currency Considered
1.7 Volume Unit Considered
1.8 Stakeholders
2 Research Methodology (Page No. - 19)
2.1 Research Data
2.1.1 Secondary Data
2.1.1.1 Key Data From Secondary Sources
2.1.2 Primary Data
2.1.2.1 Key Data From Primary Sources
2.1.2.2 Key Data From Primary Sources
2.2 Market Size Estimation
2.2.1 Bottom-Up Approach
2.3 Data Triangulation
2.4 Assumptions for the Study
2.5 Limitations of the Study
3 Executive Summary (Page No. - 28)
4 Premium Insights (Page No. - 33)
4.1 Attractive Opportunities in the Market
4.2 Livestock Grow Lights Market: Major Countries
4.3 Asia Pacific: Livestock Grow Lights Market, By Type & Country
4.4 Livestock Grow Lights Market, By Livestock & Region
4.5 Market, By Type & Region
4.6 Market, By Installation Type
5 Market Overview (Page No. - 38)
5.1 Introduction
5.2 Market Dynamics
5.2.1 Drivers
5.2.1.1 Increase in Demand and Consumption of Livestock-Based Products
5.2.1.2 Technological Innovations and Adoption of Smart Livestock Farming Practices
5.2.1.3 Rise in Focus on Livestock Growth and Welfare Together With the Emphasis on Livestock Productivity
5.2.2 Restraints
5.2.2.1 Lack in Awareness About the Adoption of Smart Technology for Livestock Farming in Developing Countries
5.2.3 Opportunities
5.2.3.1 Increase in the Number of Commercial Livestock Farms, Globally
5.2.4 Challenges
5.2.4.1 High Cost Associated With Fixtures of LED Lights in Livestock Farms
5.3 Value Chain: Livestock Grow Lights Market
6 Livestock Grow Lights Market, By Type (Page No. - 44)
6.1 Introduction
6.2 Light-Emitting Diode (LED)
6.2.1 High Energy Efficiency With Low Maintenance Cost Propels the Market Growth for LED
6.3 Fluorescent
6.3.1 Low Cost of Fluorescent Lighting has Driven the Growth of This Market Segment
6.4 Incandescent
6.4.1 Discontinued Usage of Incandescent Lights in Livestock Farms
6.5 High-Intensity Discharge (Hid)
6.5.1 these Lights are Not Suitable for Short Period of Lighting Operations
7 Livestock Grow Lights Market, By Livestock (Page No. - 51)
7.1 Introduction
7.2 Poultry
7.2.1 The Increasing Consumption of Chicken & Egg is Projected to Encourage Poultry Farming, Which in Turn is Projected to Drive the Market Growth
7.2.2 Broilers
7.2.3 Layers
7.2.4 Turkey
7.3 Cattle
7.3.1 The Rising Demand for Milk-Based Products in Emerging Economies is Projected to Drive the Growth of the Market
7.3.2 Dairy Cattle
7.3.3 Beef Cattle
7.4 Swine
7.4.1 Rising Consumption of Pork Propels the Market Growth for Livestock Grow Lights
7.4.2 Starter
7.4.3 Grower
7.4.4 Sow
7.5 Others
8 Livestock Grow Lights Market, By Installation Type (Page No. - 60)
8.1 Introduction
8.2 Retrofit
8.2.1 Low Cost of Retrofit is Driving the Market
8.3 New Installation
8.3.1 Expansion of Farms to Propel New Installation for the Market
9 Livestock Grow Lights Market, By Light Color Type (Page No. - 64)
9.1 Introduction
9.2 Green
9.3 Red
9.4 White
9.5 Blue
10 Livestock Grow Lights Market, By Region (Page No. - 65)
10.1 Introduction
10.2 North America
10.2.1 US
10.2.1.1 Accounted for the Largest Share in the North American Market
10.2.2 Canada
10.2.2.1 Unfavorable Climatic Conditions Drive the Usage of Artificial Lights
10.2.3 Mexico
10.2.3.1 Support From Government Programs for Developments in Livestock Farm Infrastructure
10.3 Europe
10.3.1 Germany
10.3.1.1 Rapid Growth in Adopting Smart Technologies in Livestock Farming Practice
10.3.2 France
10.3.2.1 The Rising Demand for Meat and Poultry Products in France is Driving the Market Growth
10.3.3 Spain
10.3.3.1 The Growth in the Swine Sector in Spain is Driving the Market Growth
10.3.4 UK
10.3.4.1 Adoption of the US-Style Intensive Factory Farming for Cattle, Poultry, and Swine to Drive the Growth
10.3.5 Italy
10.3.5.1 Focus on Cattle, and Swine Rearing is Driving the Adoption of New Lighting Technology in Italy
10.3.6 Rest of Europe
10.3.6.1 Increase in the Domestic Demand for Meat and Poultry Products Will Drive the Usage of Grow Lights in the Livestock Barns
10.4 Asia Pacific
10.4.1 China
10.4.1.1 Largest Manufacturing Base for LED Lighting Products
10.4.2 Australia & New Zealand
10.4.2.1 Variation in Climatic Conditions to Enhance the Growth of Artificial Lighting in Livestock Barns
10.4.3 Japan
10.4.3.1 Rapid Lighting Technological Advancements in Various Application Segments, Along With Early Adoption
10.4.4 India
10.4.4.1 The Developing Lighting Industry is Expected to Drive the Growth of the Market
10.4.5 Rest of Asia Pacific
10.4.5.1 Increasing Demand for Livestock-Based Products Such as Meat and Dairy & Dairy-Based Products
10.5 Rest of the World (Row)
10.5.1 South America
10.5.1.1 Livestock Farming is One of the Major Activities in This Region, Supporting the Growth of Livestock Grow Lights in Livestock Barns
10.5.2 Africa
10.5.2.1 Growing Demand for Livestock Products Such as Milk and Meat is Likely to Increase the Livestock Rearing
10.5.3 Middle East
10.5.3.1 Increasing Domestic Poultry Production, Expansion of Poultry Farms is Expected to Increase New Installation of Lighting Technology, Such as LED in Poultry Farms.
11 Competitive Landscape (Page No. - 98)
11.1 Overview
11.2 Competitive Scenario
11.3 Ranking of Key Players, 2018
11.4 New Product Launches
11.4.1 Expansions
11.4.2 Agreements and Partnerships
11.4.3 Acquisitions
12 Company Profiles (Page No. - 103)
(Business Overview, Products Offered, Recent Developments, SWOT Analysis & MnM View)*
12.1 Osram
12.2 Signify Holding
12.3 Delaval
12.4 Big Dutchman
12.5 Uni-Light LED
12.6 Once Inc.
12.7 Agrilight BV
12.8 Aruna Lighting
12.9 HATO BV
12.10 Shenzhen Hontech-Wins
12.11 CBM Lighting
12.12 Fienhage Poultry Solutions
12.13 Sunbird
12.14 Enim UAB
12.15 Greengage Lighting
*Details on Business Overview, Products Offered, Recent Developments, SWOT Analysis & MnM View Might Not Be Captured in Case of Unlisted Companies.
13 Appendix (Page No. - 128)
13.1 Discussion Guide
13.2 KnowLEDge Store: Marketsandmarkets� Subscription Portal
13.3 Available Customizations
13.4 Related Reports
13.5 Author Details
List of Tables (76 Tables)
Table 1 US Dollar Exchange Rates Considered, 2015�2017
Table 2 Market Snapshot, 2018 vs. 2023
Table 3 General Characteristics of Light Used for Indoor Lighting of Livestock Facilities
Table 4 Market Size For Livestock Grow Lights, By Type, 2016�2023 (USD Million)
Table 5 Market Size, By Type, 2016�2023 (Thousand Units)
Table 6 LED: Market Size For Livestock Grow Lights, By Region, 2016�2023 (USD Million)
Table 7 Fluorescent: Market Size For Livestock Grow Lights, By Region, 2016�2023 (USD Million)
Table 8 Incandescent: Market Size For Livestock Grow Lights, By Region, 2016�2023 (USD Million)
Table 9 High Intensity Discharge (Hid): Market Size For Livestock Grow Lights, By Region, 2016�2023 (USD Million)
Table 10 Market Size For Livestock Grow Lights, By Livestock, 2016�2023 (USD Million)
Table 11 Market Size, By Livestock, 2016�2023 (Thousand Units)
Table 12 Lighting Levels for Poultry
Table 13 Poultry Livestock Grow Lights Market Size, By Region, 2016�2023 (USD Million)
Table 14 Market Size, By Type, 2016�2023 (USD Million)
Table 15 Recommended Light Levels for Dairy
Table 16 Cattle Livestock Grow Lights Market Size, By Region, 2016�2023 (USD Million)
Table 17 Cattle Livestock Grow Light Market Size, By Type, 2016�2023 (USD Million)
Table 18 Recommended Light Intensity and Photoperiod for Swine
Table 19 Swine Livestock Grow Lights Market Size, By Region, 2016�2023 (USD Million)
Table 20 Swine Livestock Grow Lights Market Size, By Type, 2016�2023 (USD Million)
Table 21 Others Livestock Grow Lights Market Size, By Region, 2016�2023 (USD Million)
Table 22 Market Size For Livestock Grow Lights, By Installation Type, 2016�2023 (USD Million)
Table 23 Market Size For Livestock Grow Lights, By Installation Type, 2016�2023 (Thousand Units)
Table 24 Retrofit: Market Size For Livestock Grow Lights, By Region, 2016�2023 (USD Million)
Table 25 New Installation: Market Size For Livestock Grow Lights, By Region, 2016�2023 (USD Million)
Table 26 Market Size For Livestock Grow Lights, By Region, 2016�2023 (USD Million)
Table 27 Market Size, By Region, 2016�2023 (Thousand Units)
Table 28 North America: Livestock Grow Lights Market Size, By Country, 2016�2023 (USD Million)
Table 29 North America: Market Size, By Type, 2016�2023 (USD Million)
Table 30 North America: Market Size, By Type, 2016�2023 (Thousand Units)
Table 31 North America: Market Size, By Livestock, 2016�2023 (USD Million)
Table 32 North America: Market Size, By Livestock, 2016�2023 (Thousand Units)
Table 33 North America: Market Size, By Installation Type, 2016�2023 (USD Million)
Table 34 North America: Market Size, By Installation Type, 2016�2023 (Thousand Units)
Table 35 US: Market Size For Livestock Grow Lights, By Type, 2016�2023 (USD Million)
Table 36 Canada: Market Size For Livestock Grow Lights, By Type, 2016�2023 (USD Million)
Table 37 Mexico: Market Size For Livestock Grow Lights, By Type, 2016�2023 (USD Million)
Table 38 Europe: Market Size For Livestock Grow Lights, By Country, 2016�2023 (USD Million)
Table 39 Europe: Market Size, By Type, 2016�2023 (USD Million)
Table 40 Europe: Market Size, By Type, 2016�2023 (Thousand Units)
Table 41 Europe: Market Size, By Livestock, 2016�2023 (USD Million)
Table 42 Europe: Market Size, By Livestock, 2016�2023 (Thousand Units)
Table 43 Europe: Market Size, By Installation Type, 2016�2023 (USD Million)
Table 44 Europe: Market Size, By Installation Type, 2016�2023 (Thousand Units)
Table 45 Germany: Market Size For Livestock Grow Lights, By Type, 2016�2023 (USD Million)
Table 46 France: Market Size For Livestock Grow Lights, By Type, 2016�2023 (USD Million)
Table 47 Spain: Market Size For Livestock Grow Lights, By Type, 2016�2023 (USD Million)
Table 48 UK: Market Size For Livestock Grow Lights, By Type, 2016�2023 (USD Million)
Table 49 Italy: Market Size For Livestock Grow Lights, By Type, 2016�2023 (USD Million)
Table 50 Rest of Europe: Market Size For Livestock Grow Lights, By Type, 2016�2023 (USD Million)
Table 51 Asia Pacific: Livestock Grow Light Market Size, By Country/Region, 2016�2023 (USD Million)
Table 52 Asia Pacific: Market Size, By Type, 2016�2023 (USD Million)
Table 53 Asia Pacific: Market Size, By Type, 2016�2023 (Thousand Units)
Table 54 Asia Pacific: Market Size, By Livestock, 2016�2023 (USD Million)
Table 55 Asia Pacific: Market Size, By Livestock, 2016�2023 (Thousand Units)
Table 56 Asia Pacific: Market Size, By Installation Type, 2016�2023 (USD Million)
Table 57 Asia Pacific: Market Size, By Installation Type, 2016�2023 (Thousand Units)
Table 58 China: Market Size For Livestock Grow Lights, By Type, 2016�2023 (USD Million)
Table 59 Australia & New Zealand: Market Size For Livestock Grow Lights, By Type, 2016�2023 (USD Million)
Table 60 Japan: Market Size For Livestock Grow Lights, By Type, 2016�2023 (USD Million)
Table 61 India: Market Size For Livestock Grow Lights, By Type, 2016�2023 (USD Million)
Table 62 Rest of Asia Pacific: Livestock Grow Lights Market Size, By Type, 2016�2023 (USD Million)
Table 63 Row: Livestock Grow Light Market Size, By Region, 2016�2023 (USD Million)
Table 64 Row: Market Size, By Type, 2016�2023 (USD Million)
Table 65 Row: Market Size, By Type, 2016�2023 (Thousand Units)
Table 66 Row: Market Size, By Livestock, 2016�2023 (USD Million)
Table 67 Row: Market Size, By Livestock, 2016�2023 (Thousand Units)
Table 68 Row: Market Size, By Installation Type, 2016�2023 (USD Million)
Table 69 Row: Market Size, By Installation Type, 2016�2023 (Thousand Units)
Table 70 South America: Livestock Grow Lights Market Size, By Type, 2016�2023 (USD Million)
Table 71 Africa: Market Size For Livestock Grow Lights, By Type, 2016�2023 (USD Million)
Table 72 Middle East: Market Size For Livestock Grow Lights, By Type, 2016�2023 (USD Million)
Table 73 New Product Launches, 2016�2018
Table 74 Expansions, 2017�2018
Table 75 Agreements and Partnerships 2016�2017
Table 76 Acquisitions, 2017�2018
List of Figures (38 Figures)
Figure 1 Research Design
Figure 2 Bottom-Up Approach
Figure 3 Top-Down Approach
Figure 4 Data Triangulation Methodology
Figure 5 Market Size, By Type, 2018 vs. 2023 (Thousand Unit)
Figure 6 Market Size, By Livestock, 2018 vs. 2023 (USD Million)
Figure 7 Market Size, By Installation Type, 2018 vs. 2023 (USD Million)
Figure 8 Market Share (Value), By Region, 2017
Figure 9 Growth in Consumption of Livestock-Based Products and Increase in Focus on Livestock Productivity Have LED to Significant Adoption of Grow Lights
Figure 10 German Market is Projected to Grow at the Highest CAGR During the Forecast Period
Figure 11 China Accounted for the Largest Share in the Asia Pacific Market and Fluorescent Lights Dominated in Terms of Type in 2017
Figure 12 Asia Pacific to Dominate the Market Across All Types of Livestock Through to 2023
Figure 13 LED Segment to Grow at the Highest CAGR During the Forecast Period
Figure 14 The Market for New Installations is Projected to Grow at the Higher CAGR During the Forecast Period
Figure 15 Market Dynamics
Figure 16 Major Meat Producing Regions/Countries (Thousand Tonnes)
Figure 17 Major Bovine Meat Producing Regions/Countries (Thousand Tonnes)
Figure 18 Major Swine Meat Producing Regions/Countries (Thousand Tonnes)
Figure 19 Major Poultry Meat Producing Regions/Countries (Thousand Tonnes)
Figure 20 Value Chain: Livestock Grow Lights Market
Figure 21 Market Share in Terms of Value & Volume, By Type, 2018 vs. 2023
Figure 22 Market Share By Value & Volume, By Livestock, 2018 vs. 2023
Figure 23 Market Share, By Installation Type, 2018 vs. 2023 (By Value)
Figure 24 Market Share (Value), By Key Country, 2017
Figure 25 Europe: Market Snapshot
Figure 26 Asia Pacific: Market Snapshot, 2017
Figure 27 Key Developments By Leading Players in the Market, 2014-2018
Figure 28 Number of Developments Between, 2016 and 2018
Figure 29 Signify Holding, LED the Livestock Grow Lights Market in 2018
Figure 30 Osram: Company Snapshot
Figure 31 Osram: SWOT Analysis
Figure 32 Signify Holding: Company Snapshot
Figure 33 Signify Holding: SWOT Analysis
Figure 34 Delaval: Company Snapshot
Figure 35 Delaval: SWOT Analysis
Figure 36 Big Ducthman: Company Snapshot
Figure 37 Big Dutchman: SWOT Analysis
Figure 38 Uni-Light LED: SWOT Analysis
The study involved four major activities in estimating the current market size for the livestock grow lights market. Exhaustive secondary research was done to collect information on the market as well as the parent market. The next step was to validate these findings, assumptions, and sizing with industry experts across the value chain through primary research. Both the top-down and bottom-up approaches were employed to estimate the complete market size. Thereafter, market breakdown and data triangulation were used to estimate the market size of segments and subsegments.
Secondary Research
In the secondary research process, various sources were referred to, so as to identify and collect information for this study. These secondary sources included reports from the Food and Agriculture Organization (FAO), United States Department of Agriculture (USDA), Ontario Ministry of Agriculture, Food and Rural Affairs (OMAFRA), National Livestock Producers Association, International Light Association, and Maine Association of Livestock Exhibitors, annual reports, press releases & investor presentations of companies, white papers, certified publications, articles by recognized authors, regulatory bodies, trade directories, and databases.
Secondary research was mainly used to obtain key information about the industry�s supply chain, the total pool of key players, market classification, and segmentation, according to industry trends to the bottom-most level and regional markets. It was also used to obtain information about key developments from a market-oriented perspective.
Primary Research
The overall market comprises several stakeholders such as grow lights traders and distributors, livestock farms & rearers, government organization, and research institutions in the supply chain. The demand side of this market is characterized by the development of the livestock farm industries, the rise in livestock population, and an increase in the consumption of animal-based products. The supply side is characterized by advancements in technology. Various primary sources from both, the supply and demand sides of the overall market were interviewed to obtain qualitative and quantitative information.
The primary interviewees from the demand side include poultry, swine, and dairy farmers as well as research institutions involved in R&D to introduce new lighting solutions and livestock supplier associations. The primary sources from the supply side include key opinion leaders, vice presidents, and CEOs of the key manufacturing companies in the market, grow light suppliers/distributor, importers, and exporters
To know about the assumptions considered for the study, download the pdf brochure
Market Size Estimation
Both the top-down and bottom-up approaches were used to estimate and validate the total size of the market. These approaches were also used extensively to estimate the size of various subsegments in the market. The research methodology used to estimate the market size includes the following details:
- The key players were identified through extensive secondary research.
- The livestock grow lights industry�s value chain and market size, in terms of value and volume, were determined through primary and secondary research.
- All percentage share splits and breakdowns were determined using secondary sources and verified through primary sources.
- All the possible parameters that affect the market covered in this research study were accounted for, viewed in extensive detail, verified through primary research, and analyzed to obtain the final quantitative and qualitative data.
Data Triangulation
After arriving at the overall market sizes-using the market size estimation processes as explained above�the market was split into several segments and subsegments. In order to complete the overall market engineering process and arrive at the exact statistics of each market segment and its subsegments, the data triangulation and market breakdown procedures were employed, wherever applicable. The data was triangulated by studying various factors and trends from both the demand and supply sides of the livestock grow lights industry. The market size was validated using the top-down and bottom-up approaches.
Report Objectives
- Determining and projecting the size of the livestock grow lights market with respect to type, livestock, installation type, and regional markets over a five-year period ranging from 2018 to 2023
- Identifying attractive opportunities in the market by determining the largest and fastest-growing segments across regions
- Providing detailed information about key factors influencing the growth of the market (drivers, restraints, opportunities, and industry-specific challenges)
- Analyzing the micromarkets with respect to individual growth trends, future prospects, and their contribution to the total market
- Identifying and profiling key market players in the livestock grow light market
- Providing a comparative analysis of the market leaders on the basis of the following:
- Product offerings
- Business strategies
- Strengths and weaknesses
- Key financials
- Understanding the value chain, competitive landscape and identifying the major growth strategies adopted by players across the key regions
- Providing insights on key product innovations and investments in the livestock grow light market
Available Customizations
With the given market data, MarketsandMarkets offers customizations according to the client-specific scientific needs.
The following customization options are available for the report:
Type Analysis
- Further breakdown of the fluorescent segment, by subtype
Geographic Analysis
- Further breakdown of the Rest of Asia Pacific livestock grow light market, by key country
- Further breakdown of the Rest of Europe livestock grow light market, by key country
Company Information
- Analyses and profiling of additional market players (up to five)


Growth opportunities and latent adjacency in Livestock Grow Lights Market