LNG Storage Tank Market

LNG Storage Tank Market by Type (Self-Supporting, Non-Self-Supporting), Material (Steel, 9% Nickel Steel, Aluminum Alloy), Region (North America, Europe, Asia Pacific, Middle East & Africa, South America) - Global Forecast to 2027

Report Code: CH 7556 Dec, 2022, by marketsandmarkets.com

Updated on : April 01, 2024

LNG Storage Tank Market

The global LNG storage tank market was valued at USD 14.5 billion in 2022 and is projected to reach USD 20.8 billion by 2027, growing at 7.5% cagr from 2022 to 2027. Liquefied natural gas (LNG) storage tanks are specialized types of storage tanks, used for LNG storage. These tanks are generally found in-ground, above ground, and in LNG carriers or vehicles. They are made in various configurations, such as horizontal, vertical, double-walled, and insulated. LNG storage tanks are constructed with thermal insulation to reduce evaporation, prevent heat transfer, and protect structures from cryogenic temperatures.

Attractive Opportunities in the LNG Storage Tank Market
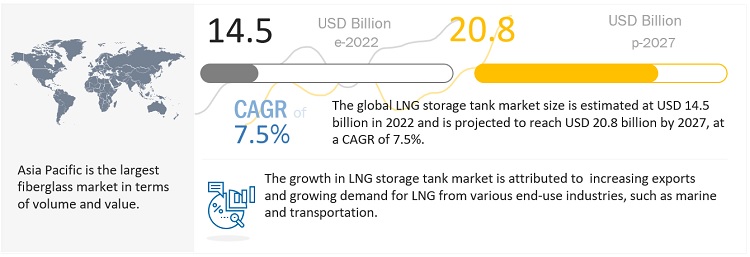
LNG Storage Tank Market

Note e-estimated; p-projected.

To know about the assumptions considered for the study, Request for Free Sample Report

LNG Storage Tank Market Dynamics

Increased number of floating storage and regasification units to drive the demand for LNG storage tanks

A floating storage and regasification unit is a key component of the LNG value chain, forming the interface between LNG carriers and local gas suppliers. Floating storage and regasification units (FSRUs) are a flexible alternative to conventional onshore LNG terminals. In 2021 the overall LNG fleet increased by 10% from 2020. According to International Gas Union, the global LNG carrier fleet consisted of 641 active vessels as of end-of-April 2022, including 45 FSRUs and five floating storage units (FSUs). The demand for floating storage and regasification units is more in regions that have a high demand for LNG and a lack of an established pipeline network. Fast-growing economies in some regions, including Asia Pacific, the Middle East, and Africa, are expected to drive the growth of new floating storage and regasification units in the near future, which, in turn, is expected to drive the demand for LNG storage tanks.

High installation cost of LNG storage tanks is a major restrain for the LNG storage tank market

A major raw material used for the manufacturing of the LNG storage tank is nickel steel (9%). The fluctuating prices of nickel steel act as a restraint to market growth. The nickel steel prices have been fluctuating continuously due to Indonesia’s ban on the export of nickel, which was effective from January 2020. Indonesia is the largest global producer and exporter of nickel, followed by the Philippines, accounting for over 20% of nickel export, globally. Owing to the announcement of the ban, there was a sudden surge in nickel prices, which resulted in an increase in the production cost of LNG storage tanks. Moreover, the US imposed 25% tariffs on steel production in China, in 2018. This was one of the reasons which led to a trade war between the US and China, resulting in the rise in prices of steel, that is the most used raw material for manufacturing LNG storage tanks.

Growing opportunities in marine transport is the an opportunity to LNG storage tank market to grow

In 2020, the International Maritime organization decided to implement a 0.50% sulfur cap decision to reduce the harmful effects of marine fuel on the environment. This gave rise to LNG as a marine fuel. LNG emits zero sulfur oxide and zero particulate matter, unlike other fuels, and is noncorrosive and non-toxic. LNG will lead to long-term, cost-effective solutions as a conventional marine fuel. Wartsila (Finland), a global leader in the marine industry, has developed and converted oil-run engines to LNG-powered engines.

LNG storage tanks are being increasingly used for intermodal freight transportation. Intermodal facilities include depots, container yards, cargo, and storage tanks, which provide more options for marine transportation and many oil & gas companies, which will boost the LNG storage tank market.

One of the major restraint for LNG storage tank market is LNG leakage and boil-off gas

LNG is stored and transported in storage tanks as a cryogenic liquid. Even though the tanks are insulated, there is still heat ingress into the tanks from the surroundings. This increases the temperature, causing the liquid to evaporate and thus creating boil-off gas. Managing the boil-off gas is very necessary to prevent the tank from being over-pressurized and avoid health and safety risks to the surroundings. There are also explosion hazards in case of leakage of gas from the tank. Thus, leakage and boiling of gas are key challenges in the LNG storage tank market.

Another key challenge is that a lot of players are involved in the LNG value chain—EPC (Engineering, Procurement, and Construction) contractors, suppliers, vendors, stakeholders, and end users, which gives rise to potential problem areas, such as delayed supply, and increase in cost.
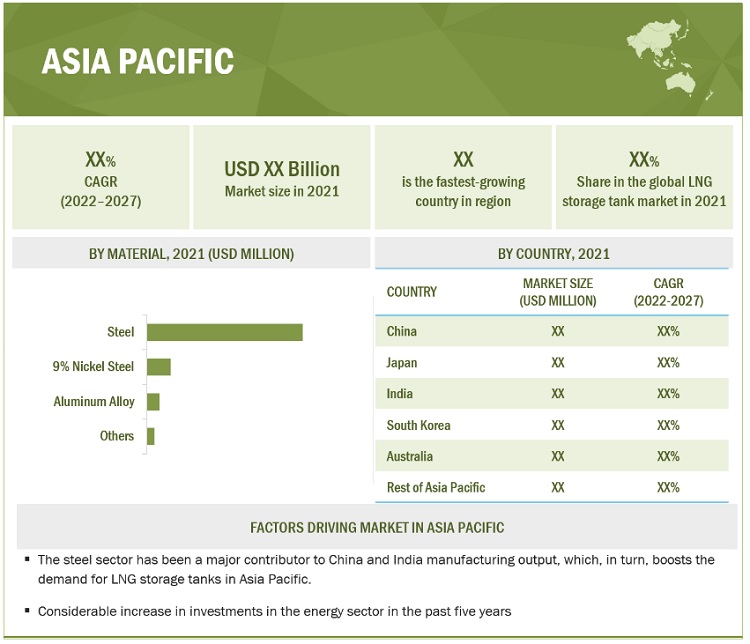
LNG Storage Tank Market by Region

To know about the assumptions considered for the study, download the pdf brochure

Asia Pacific held the largest market share in the LNG storage tank market

Asia Pacific is projected to be the fastest-growing market for LNG storage tanks, owing to a considerable increase in investments in the energy sector in the past five years, creating a high demand for small-scale LNG, which, in turn, will drive the demand for LNG storage tanks in the region. Furthermore, the growing import of small-scale LNG coupled with the growth in the Asia Pacific steel and metal manufacturing sector has been driven mainly by the domestic availability of raw materials (for instance, iron ore) and cost-effective labor. The steel sector has been a major contributor to India’s manufacturing output, which, in turn, boosts the demand for LNG storage tanks in Asia Pacific.

LNG Storage Tank Market Players

The key players in the global LNG storage tank market are:

  • Linde Plc (Ireland)
  • McDermott International Inc. (US)
  • Wartsila (Finland)
  • IHI Corporation (Japan)
  • Air Water Inc. (Japan)
  • Cimc Enric (China)
  • Chart Industries (US)
  • Isisan A.S (Turkey)
  • Cryolor (France)
  • Inox (India)
  • Carbon Energy Group (US)
  • TransTech Energy Llc. (US)
  • Others

These companies are involved in adopting various inorganic and organic strategies to increase their foothold in the LNG storage tank industry. The study includes an in-depth competitive analysis of these key players in the LNG storage tank market, with their company profiles, recent developments, and key market strategies.

LNG Storage Tank Market Report Scope

Report Metric

Details

Years considered for the study

2019–2027

Base year

2021

Forecast period

2022–2027

Units considered

Value (USD Million/Billion), Volume (Million square meter)

Segments

Type, Material type, and Region

Regions

Europe, North America, APAC, MEA, and South America

Companies

Linde Plc (Ireland), McDermott International Inc. (US), Wartsila (Finland), IHI Corporation (Japan), Air Water Inc. (Japan), Cimc Enric (China), Chart Industries (US), Isisan A.S (Turkey), Cryolor (France), Inox  (India), Carbon Energy Group (US), and TransTech Energy Llc. (US).

This research report categorizes the LNG storage tank market based on type, material type, and region.

By Type:
  • Self-Supportive
  • Non-Self-Supportive
By Material Type:
  • Steel
  • 9% Nickel Steel
  • Aluminum Alloy
  • Others (7% nickel steel, concrete)
By Region:
  • North America
  • Europe
  • APAC
  • MEA
  • South America

Recent Developments

  • In May 2022, Chart Industries completed the acquisition of Cryogenic Service Center AB (CSC). This acquisition helped the company to expand its geographical footprint along with extended service capabilities for transportable tanks, and LNG fueling stations.
  • In January 2022, CIMC ENRIC acquired Lindenau Full tank service Inc., which is an established tank service company having expertise in cryogenic, gas, and chemical tanks, and tank trailers. This acquisition will help the company to expand its network in Europe. It will provide timely after-sales services and capabilities, particularly in energy and chemical logistics.
  • In September 2021, Wartsila was planning to collaborate with Hudong-Zhonghua Shipbuilding (HZS) and ABS to develop a future-proof, flexible LNG carrier vessel concept (LNGC).

Frequently Asked Questions (FAQ):

To speak to our analyst for a discussion on the above findings, click Speak to Analyst

TABLE OF CONTENTS
 
1 INTRODUCTION (Page No. - 23)
    1.1 STUDY OBJECTIVES 
    1.2 MARKET DEFINITION 
    1.3 MARKET SCOPE 
           1.3.1 MARKET SEGMENTATION
           1.3.2 REGIONAL SCOPE
           1.3.3 YEARS CONSIDERED
    1.4 CURRENCY CONSIDERED 
    1.5 UNITS CONSIDERED 
    1.6 LIMITATIONS 
    1.7 STAKEHOLDERS 
    1.8 IMPACT OF SLOWDOWN 
 
2 RESEARCH METHODOLOGY (Page No. - 27)
    2.1 RESEARCH DATA 
          FIGURE 1 LNG STORAGE TANK MARKET: RESEARCH DESIGN
           2.1.1 SECONDARY DATA
                    2.1.1.1 Key data from secondary sources
           2.1.2 PRIMARY DATA
                    2.1.2.1 Key data from primary sources
                    2.1.2.2 Breakdown of primary interviews
    2.2 BASE NUMBER CALCULATION 
           2.2.1 SUPPLY-SIDE APPROACH
    2.3 MARKET SIZE ESTIMATION 
           2.3.1 MARKET SIZE ESTIMATION METHODOLOGY: BOTTOM-UP APPROACH
           2.3.2 MARKET SIZE ESTIMATION METHODOLOGY: TOP-DOWN APPROACH
    2.4 DATA TRIANGULATION 
          FIGURE 2 LNG STORAGE TANK MARKET: DATA TRIANGULATION
    2.5 RESEARCH ASSUMPTIONS 
 
3 EXECUTIVE SUMMARY (Page No. - 34)
    FIGURE 3 SELF-SUPPORTING TYPE TO DOMINATE OVERALL LNG STORAGE TANK MARKET
    FIGURE 4 STEEL SEGMENT TO DOMINATE LNG STORAGE TANK MARKET
    FIGURE 5 ASIA PACIFIC WAS LARGEST MARKET FOR LNG STORAGE TANKS
 
4 PREMIUM INSIGHTS (Page No. - 37)
    4.1 ATTRACTIVE OPPORTUNITIES FOR PLAYERS IN LNG STORAGE TANK MARKET 
          FIGURE 6 GROWING LNG EXPORTS TO DRIVE MARKET DURING FORECAST PERIOD
    4.2 LNG STORAGE TANK MARKET, BY REGION AND MATERIAL 
          FIGURE 7 ASIA PACIFIC WAS LARGEST LNG STORAGE TANK MARKET
    4.3 LNG STORAGE TANK MARKET IN ASIA PACIFIC, BY COUNTRY, 2021 
          FIGURE 8 CHINA ACCOUNTED FOR LARGEST MARKET SHARE IN ASIA PACIFIC
    4.4 LNG STORAGE TANK MARKET, BY COUNTRY 
          FIGURE 9 INDIA TO BE FASTEST-GROWING MARKET BETWEEN 2022 AND 2027
 
5 MARKET OVERVIEW (Page No. - 39)
    5.1 INTRODUCTION 
    5.2 MARKET DYNAMICS 
          FIGURE 10 DRIVERS, RESTRAINTS, OPPORTUNITIES, AND CHALLENGES IN LNG STORAGE TANK MARKET
           5.2.1 DRIVERS
                    5.2.1.1 Rise in LNG trade worldwide
                    5.2.1.2 Increase in number of floating storage and regasification units
           5.2.2 RESTRAINTS
                    5.2.2.1 High installation cost of LNG storage tanks
           5.2.3 OPPORTUNITIES
                    5.2.3.1 Growing opportunities in marine transport
                    5.2.3.2 Increasing spending on infrastructure
           5.2.4 CHALLENGES
                    5.2.4.1 LNG leakage and boil-off gas
    5.3 PORTER’S FIVE FORCES ANALYSIS 
          FIGURE 11 LNG STORAGE TANK MARKET: PORTER’S FIVE FORCES ANALYSIS
           5.3.1 BARGAINING POWER OF SUPPLIERS
           5.3.2 THREAT OF NEW ENTRANTS
           5.3.3 THREAT OF SUBSTITUTES
           5.3.4 BARGAINING POWER OF BUYERS
           5.3.5 INTENSITY OF COMPETITIVE RIVALRY
    5.4 MACROECONOMIC INDICATORS 
           5.4.1 TRENDS AND FORECAST OF GDP
                    TABLE 1 TRENDS AND FORECAST OF GDP, 2019–2027 (USD BILLION)
           5.4.2 MAJOR STEEL-PRODUCING COUNTRIES
                    TABLE 2 CRUDE STEEL PRODUCTION, 2020 VS. 2021 (MILLION TONS)
 
6 LNG STORAGE TANK MARKET, BY TYPE (Page No. - 47)
    6.1 INTRODUCTION 
          FIGURE 12 SELF-SUPPORTING TANKS TO BE LARGER TYPE OF LNG STORAGE TANKS
          TABLE 3 LNG STORAGE TANK MARKET SIZE, BY TYPE, 2020–2027 (USD MILLION)
          TABLE 4 LNG STORAGE TANK MARKET SIZE, BY TYPE, 2020–2027 (MILLION SQUARE METER)
    6.2 SELF-SUPPORTING 
          TABLE 5 SELF-SUPPORTING STORAGE TANK MARKET SIZE, BY REGION, 2020–2027 (USD MILLION)
          TABLE 6 SELF-SUPPORTING STORAGE TANK MARKET SIZE, BY REGION, 2020–2027 (MILLION SQUARE METER)
           6.2.1 SINGLE CONTAINMENT STORAGE TANKS
                    6.2.1.1 Ability to maintain cryogenic temperature to drive market
                                TABLE 7 SINGLE CONTAINMENT: SELF-SUPPORTING LNG STORAGE TANK MARKET SIZE, BY REGION, 2020–2027 (USD MILLION)
                                TABLE 8 SINGLE CONTAINMENT: SELF-SUPPORTING LNG STORAGE TANK MARKET SIZE, BY REGION, 2020–2027 (MILLION SQUARE METER)
           6.2.2 DOUBLE CONTAINMENT STORAGE TANKS
                    6.2.2.1 Excellent mechanical property to drive market
                                TABLE 9 DOUBLE CONTAINMENT: SELF-SUPPORTING LNG STORAGE TANK MARKET SIZE, REGION, 2020–2027 (USD MILLION)
                                TABLE 10 DOUBLE CONTAINMENT: SELF-SUPPORTING LNG STORAGE TANK MARKET SIZE, REGION, 2020–2027 (MILLION SQUARE METER)
           6.2.3 FULL CONTAINMENT STORAGE TANKS
                    6.2.3.1 Growing demand for LNG to drive market
                                TABLE 11 FULL CONTAINMENT: SELF-SUPPORTING LNG STORAGE TANK MARKET SIZE, BY REGION, 2020–2027 (USD MILLION)
                                TABLE 12 FULL CONTAINMENT: SELF-SUPPORTING LNG STORAGE TANK MARKET SIZE, BY REGION, 2020–2027 (MILLION SQUARE METER)
    6.3 NON-SELF–SUPPORTING TANKS 
          TABLE 13 NON-SELF-SUPPORTING: LNG STORAGE TANK MARKET SIZE, BY REGION, 2020–2027 (USD MILLION)
          TABLE 14 NON-SELF-SUPPORTING: LNG STORAGE TANK MARKET SIZE, BY REGION, 2020–2027 (MILLION SQUARE METER)
           6.3.1 MEMBRANE TANK
                    6.3.1.1 Growing demand for LNG carriers in marine industry to drive market
                                TABLE 15 MEMBRANE TANK: NON-SELF-SUPPORTING LNG STORAGE TANK MARKET SIZE, BY REGION, 2020–2027 (USD MILLION)
                                TABLE 16 MEMBRANE TANK: NON-SELF-SUPPORTING LNG STORAGE TANK MARKET SIZE, BY REGION, 2020–2027 (MILLION SQUARE METER)
 
7 LNG STORAGE TANK MARKET, BY MATERIAL (Page No. - 55)
    7.1 INTRODUCTION 
          FIGURE 13 STEEL TO BE MOST USED MATERIAL FOR LNG STORAGE TANKS
          TABLE 17 LNG STORAGE TANK MARKET SIZE, BY MATERIAL, 2020–2027 (USD MILLION)
          TABLE 18 LNG STORAGE TANK MARKET SIZE, BY MATERIAL, 2020–2027 (MILLION SQUARE METER)
    7.2 STEEL 
           7.2.1 GROWING APPLICATION OF LNG TANKS IN SHIPS TO DRIVE DEMAND
                    TABLE 19 STEEL: LNG STORAGE TANK MARKET SIZE, BY REGION, 2020–2027 (USD MILLION)
                    TABLE 20 STEEL: LNG STORAGE TANK MARKET SIZE, BY REGION, 2020–2027 (MILLION SQUARE METER)
    7.3 9% NICKEL STEEL 
           7.3.1 GROWING DEMAND FOR LNG STORAGE TANKS IN ENERGY INDUSTRY TO BOOST MARKET
                    TABLE 21 9% NICKEL STEEL: LNG STORAGE TANK MARKET SIZE, BY REGION, 2020–2027 (USD MILLION)
                    TABLE 22 9% NICKEL STEEL: LNG STORAGE TANK MARKET SIZE, BY REGION, 2020–2027 (MILLION SQUARE METER)
    7.4 ALUMINUM ALLOY 
           7.4.1 GROWING USE OF LNG-FUELED SHIPS TO DRIVE DEMAND
                    TABLE 23 ALUMINUM ALLOY: LNG STORAGE TANK MARKET SIZE, BY REGION, 2020–2027 (USD MILLION)
                    TABLE 24 ALUMINUM ALLOY: LNG STORAGE TANK MARKET SIZE, BY REGION, 2020–2027 (MILLION SQUARE METER)
    7.5 OTHERS 
          TABLE 25 OTHER MATERIALS: LNG STORAGE TANK MARKET SIZE, BY REGION, 2020–2027 (USD MILLION)
          TABLE 26 OTHER MATERIALS: LNG STORAGE TANK MARKET SIZE, BY REGION, 2020–2027 (MILLION SQUARE METER)
 
8 LNG STORAGE TANK MARKET, BY REGION (Page No. - 61)
    8.1 INTRODUCTION 
          FIGURE 14 ASIA PACIFIC TO GROW AT HIGHEST RATE DURING FORECAST PERIOD
          TABLE 27 LNG STORAGE TANK MARKET SIZE, BY REGION, 2020–2027 (USD MILLION)
          TABLE 28 LNG STORAGE TANK MARKET SIZE, BY REGION, 2020–2027 (MILLION SQUARE METER)
          TABLE 29 LNG STORAGE TANK MARKET SIZE, BY TYPE, 2020–2027 (USD MILLION)
          TABLE 30 LNG STORAGE TANK MARKET SIZE, BY TYPE, 2020–2027 (MILLION SQUARE METER)
          TABLE 31 LNG STORAGE TANK MARKET SIZE, BY MATERIAL, 2020–2027 (USD MILLION)
          TABLE 32 LNG STORAGE TANK MARKET SIZE, BY MATERIAL, 2020–2027 (MILLION SQUARE METER)
    8.2 ASIA PACIFIC 
          FIGURE 15 ASIA PACIFIC: LNG STORAGE TANK MARKET SNAPSHOT
          TABLE 33 ASIA PACIFIC: LNG STORAGE TANK MARKET SIZE, BY TYPE, 2020–2027 (USD MILLION)
          TABLE 34 ASIA PACIFIC: LNG STORAGE TANK MARKET SIZE, BY TYPE, 2020–2027 (MILLION SQUARE METER)
          TABLE 35 ASIA PACIFIC: LNG STORAGE TANK MARKET SIZE, BY MATERIAL, 2020–2027 (USD MILLION)
          TABLE 36 ASIA PACIFIC: LNG STORAGE TANK MARKET SIZE, BY MATERIAL, 2020–2027 (MILLION SQUARE METER)
          TABLE 37 ASIA PACIFIC: LNG STORAGE TANK MARKET SIZE, BY COUNTRY, 2020–2027 (USD MILLION)
          TABLE 38 ASIA PACIFIC: LNG STORAGE TANK MARKET SIZE, BY COUNTRY, 2020–2027 (MILLION SQUARE METER)
           8.2.1 CHINA
                    8.2.1.1 High demand for LNG in energy and power industries to drive market
                                TABLE 39 CHINA: LNG STORAGE TANK MARKET SIZE, BY MATERIAL, 2020–2027 (USD MILLION)
                                TABLE 40 CHINA: LNG STORAGE TANK MARKET SIZE, BY MATERIAL, 2020–2027 (MILLION SQUARE METER)
           8.2.2 JAPAN
                    8.2.2.1 Rising imports of natural gas and increase in investments in energy industry to drive market
                                TABLE 41 JAPAN: LNG STORAGE TANK MARKET SIZE, BY MATERIAL, 2020–2027 (USD MILLION)
                                TABLE 42 JAPAN: LNG STORAGE TANK MARKET SIZE, BY MATERIAL, 2020–2027 (MILLION SQUARE METER)
           8.2.3 INDIA
                    8.2.3.1 Increasing demand for LNG storage tanks from energy and power industries to drive market
                                TABLE 43 INDIA: LNG STORAGE TANK MARKET SIZE, BY MATERIAL, 2020–2027 (USD MILLION)
                                TABLE 44 INDIA: LNG STORAGE TANK MARKET SIZE, BY MATERIAL, 2020–2027 (MILLION SQUARE METER)
           8.2.4 SOUTH KOREA
                    8.2.4.1 Growing LNG imports to drive demand
                                TABLE 45 SOUTH KOREA: LNG STORAGE TANK MARKET SIZE, BY MATERIAL, 2020–2027 (USD MILLION)
                                TABLE 46 SOUTH KOREA: LNG STORAGE TANK MARKET SIZE, BY MATERIAL, 2020–2027 (MILLION SQUARE METER)
           8.2.5 AUSTRALIA
                    8.2.5.1 Investments from oil & gas giants to drive demand
                                TABLE 47 AUSTRALIA: LNG STORAGE TANK MARKET SIZE, BY MATERIAL, 2020–2027 (USD MILLION)
                                TABLE 48 AUSTRALIA: LNG STORAGE TANK MARKET SIZE, BY MATERIAL, 2020–2027 (MILLION SQUARE METER)
           8.2.6 REST OF ASIA PACIFIC
                    TABLE 49 REST OF ASIA PACIFIC: LNG STORAGE TANK MARKET SIZE, BY MATERIAL, 2020–2027 (USD MILLION)
                    TABLE 50 REST OF ASIA PACIFIC: LNG STORAGE TANK MARKET SIZE, BY MATERIAL, 2020–2027 (MILLION SQUARE METER)
    8.3 NORTH AMERICA 
          FIGURE 16 NORTH AMERICA: LNG STORAGE TANK MARKET SNAPSHOT
          TABLE 51 NORTH AMERICA: LNG STORAGE TANK MARKET SIZE, BY TYPE, 2020–2027 (USD MILLION)
          TABLE 52 NORTH AMERICA: LNG STORAGE TANK MARKET SIZE, BY TYPE, 2020–2027 (MILLION SQUARE METER)
          TABLE 53 NORTH AMERICA: LNG STORAGE TANK MARKET SIZE, BY MATERIAL, 2020–2027 (USD MILLION)
          TABLE 54 NORTH AMERICA: LNG STORAGE TANK MARKET SIZE, BY MATERIAL, 2020–2027 (MILLION SQUARE METER)
          TABLE 55 NORTH AMERICA: LNG STORAGE TANK MARKET SIZE, BY COUNTRY, 2020–2027 (USD MILLION)
          TABLE 56 NORTH AMERICA: LNG STORAGE TANK MARKET SIZE, BY COUNTRY, 2020–2027 (MILLION SQUARE METER)
           8.3.1 US
                    8.3.1.1 Increasing production and export of natural gas to drive market
                                TABLE 57 US: LNG STORAGE TANK MARKET SIZE, BY MATERIAL, 2020–2027 (USD MILLION)
                                TABLE 58 US: LNG STORAGE TANK MARKET SIZE, BY MATERIAL, 2020–2027 (MILLION SQUARE METER)
           8.3.2 CANADA
                    8.3.2.1 Aggressive economic expansion to boost market
                                TABLE 59 CANADA: LNG STORAGE TANK MARKET SIZE, BY MATERIAL, 2020–2027 (USD MILLION)
                                TABLE 60 CANADA: LNG STORAGE TANK MARKET SIZE, BY MATERIAL, 2020–2027 (MILLION SQUARE METER)
           8.3.3 MEXICO
                    8.3.3.1 Rapid reforms related to energy industry to drive market
                                TABLE 61 MEXICO: LNG STORAGE TANK MARKET SIZE, BY MATERIAL, 2020–2027 (USD MILLION)
                                TABLE 62 MEXICO: LNG STORAGE TANK MARKET SIZE, BY MATERIAL, 2020–2027 (MILLION SQUARE METER)
    8.4 EUROPE 
          FIGURE 17 EUROPE: LNG STORAGE TANK MARKET SNAPSHOT
          TABLE 63 EUROPE: LNG STORAGE TANK MARKET SIZE, BY TYPE, 2020–2027 (USD MILLION)
          TABLE 64 EUROPE: LNG STORAGE TANK MARKET SIZE, BY TYPE, 2020–2027 (MILLION SQUARE METER)
          TABLE 65 EUROPE: LNG STORAGE TANK MARKET SIZE, BY MATERIAL, 2020–2027 (USD MILLION)
          TABLE 66 EUROPE: LNG STORAGE TANK MARKET SIZE, BY MATERIAL, 2020–2027 (MILLION SQUARE METER)
          TABLE 67 EUROPE: LNG STORAGE TANK MARKET SIZE, BY COUNTRY, 2020–2027 (USD MILLION)
          TABLE 68 EUROPE: LNG STORAGE TANK MARKET SIZE, BY COUNTRY, 2020–2027 (MILLION SQUARE METER)
           8.4.1 GERMANY
                    8.4.1.1 Increased focus on energy generation from renewable sources to drive demand
                                TABLE 69 GERMANY: LNG STORAGE TANK MARKET SIZE, BY MATERIAL, 2020–2027 (USD MILLION)
                                TABLE 70 GERMANY: LNG STORAGE TANK MARKET SIZE, BY MATERIAL, 2020–2027 (MILLION SQUARE METER)
           8.4.2 FRANCE
                    8.4.2.1 Increasing imports and growing usage of LNG in power industry to drive demand
                                TABLE 71 FRANCE: LNG STORAGE TANK MARKET SIZE, BY MATERIAL, 2020–2027 (USD MILLION)
                                TABLE 72 FRANCE: LNG STORAGE TANK MARKET SIZE, BY MATERIAL, 2020–2027 (MILLION SQUARE METER)
           8.4.3 RUSSIA
                    8.4.3.1 Growing LNG exports to drive market
                                TABLE 73 RUSSIA: LNG STORAGE TANK MARKET SIZE, BY MATERIAL, 2020–2027 (USD MILLION)
                                TABLE 74 RUSSIA: LNG STORAGE TANK MARKET SIZE, BY MATERIAL, 2020–2027 (MILLION SQUARE METER)
           8.4.4 UK
                    8.4.4.1 Higher LNG consumption to boost LNG storage tank market
                                TABLE 75 UK: LNG STORAGE TANK MARKET SIZE, BY MATERIAL, 2020–2027 (USD MILLION)
                                TABLE 76 UK: LNG STORAGE TANK MARKET SIZE, BY MATERIAL, 2020–2027 (MILLION SQUARE METER)
           8.4.5 ITALY
                    8.4.5.1 Growing transportation industry to drive demand
                                TABLE 77 ITALY: LNG STORAGE TANK MARKET SIZE, BY MATERIAL, 2020–2027 (USD MILLION)
                                TABLE 78 ITALY: LNG STORAGE TANK MARKET SIZE, BY MATERIAL, 2020–2027 (MILLION SQUARE METER)
           8.4.6 REST OF EUROPE
                    TABLE 79 REST OF EUROPE: LNG STORAGE TANK MARKET SIZE, BY MATERIAL, 2020–2027 (USD MILLION)
                    TABLE 80 REST OF EUROPE: LNG STORAGE TANK MARKET SIZE, BY MATERIAL, 2020–2027 (MILLION SQUARE METER)
    8.5 MIDDLE EAST & AFRICA 
          FIGURE 18 MIDDLE EAST & AFRICA: LNG STORAGE TANK MARKET SNAPSHOT
          TABLE 81 MIDDLE EAST & AFRICA: LNG STORAGE TANK MARKET SIZE, BY TYPE, 2020–2027 (USD MILLION)
          TABLE 82 MIDDLE EAST & AFRICA: LNG STORAGE TANK MARKET SIZE, BY TYPE, 2020–2027 (MILLION SQUARE METER)
          TABLE 83 MIDDLE EAST & AFRICA: LNG STORAGE TANK MARKET SIZE, BY MATERIAL, 2020–2027 (USD MILLION)
          TABLE 84 MIDDLE EAST & AFRICA: LNG STORAGE TANK MARKET SIZE, BY MATERIAL, 2020–2027 (MILLION SQUARE METER)
          TABLE 85 MIDDLE EAST & AFRICA: LNG STORAGE TANK MARKET SIZE, BY COUNTRY, 2020–2027 (USD MILLION)
          TABLE 86 MIDDLE EAST & AFRICA: LNG STORAGE TANK MARKET SIZE, BY COUNTRY, 2020–2027 (MILLION SQUARE METER)
           8.5.1 QATAR
                    8.5.1.1 Increased usage of LNG in energy industry to boost growth
                                TABLE 87 QATAR: LNG STORAGE TANK MARKET SIZE, BY MATERIAL, 2020–2027 (USD MILLION)
                                TABLE 88 QATAR: LNG STORAGE TANK MARKET SIZE, BY MATERIAL, 2020–2027 (MILLION SQUARE METER)
           8.5.2 SAUDI ARABIA
                    8.5.2.1 Expansion into LNG market to drive LNG storage tank market
                                TABLE 89 SAUDI ARABIA: LNG STORAGE TANK MARKET SIZE, BY MATERIAL, 2020–2027 (USD MILLION)
                                TABLE 90 SAUDI ARABIA: LNG STORAGE TANK MARKET SIZE, BY MATERIAL, 2020–2027 (MILLION SQUARE METER)
           8.5.3 SOUTH AFRICA
                    8.5.3.1 Development of new LNG terminals and bunkering facilities to drive demand
                                TABLE 91 SOUTH AFRICA: LNG STORAGE TANK MARKET SIZE, BY MATERIAL, 2020–2027 (USD MILLION)
                                TABLE 92 SOUTH AFRICA: LNG STORAGE TANK MARKET SIZE, BY MATERIAL, 2020–2027 (MILLION SQUARE METER)
           8.5.4 REST OF MIDDLE EAST & AFRICA
                    TABLE 93 REST OF MIDDLE EAST & AFRICA: LNG STORAGE TANK MARKET SIZE, BY MATERIAL, 2020–2027 (USD MILLION)
                    TABLE 94 REST OF MIDDLE EAST & AFRICA: LNG STORAGE TANK MARKET SIZE, BY MATERIAL, 2020–2027 (MILLION SQUARE METER)
    8.6 SOUTH AMERICA 
          FIGURE 19 SOUTH AMERICA: LNG STORAGE TANK MARKET SNAPSHOT
          TABLE 95 SOUTH AMERICA: LNG STORAGE TANK MARKET SIZE, BY TYPE, 2020–2027 (USD MILLION)
          TABLE 96 SOUTH AMERICA: LNG STORAGE TANK MARKET SIZE, BY TYPE, 2020–2027 (MILLION SQUARE METER)
          TABLE 97 SOUTH AMERICA: LNG STORAGE TANK MARKET SIZE, BY MATERIAL, 2020–2027 (USD MILLION)
          TABLE 98 SOUTH AMERICA: LNG STORAGE TANK MARKET SIZE, BY MATERIAL, 2020–2027 (MILLION SQUARE METER)
          TABLE 99 SOUTH AMERICA: LNG STORAGE TANK MARKET SIZE, BY COUNTRY, 2020–2027 (USD MILLION)
          TABLE 100 SOUTH AMERICA: LNG STORAGE TANK MARKET SIZE, BY COUNTRY, 2020–2027 (MILLION SQUARE METER)
           8.6.1 BRAZIL
                    8.6.1.1 Rapidly expanding economy to drive LNG storage tank market
                                TABLE 101 BRAZIL: LNG STORAGE TANK MARKET SIZE, BY MATERIAL, 2020–2027 (USD MILLION)
                                TABLE 102 BRAZIL: LNG STORAGE TANK MARKET SIZE, BY MATERIAL, 2020–2027 (MILLION SQUARE METER)
           8.6.2 ARGENTINA
                    8.6.2.1 Increased investments in LNG terminals to drive LNG storage tank market
                                TABLE 103 ARGENTINA: LNG STORAGE TANK MARKET SIZE, BY MATERIAL, 2020–2027 (USD MILLION)
                                TABLE 104 ARGENTINA: LNG STORAGE TANK MARKET SIZE, BY MATERIAL, 2020–2027 (MILLION SQUARE METER)
           8.6.3 REST OF SOUTH AMERICA
                    TABLE 105 REST OF SOUTH AMERICA: LNG STORAGE TANK MARKET SIZE, BY MATERIAL, 2020–2027 (USD MILLION)
                    TABLE 106 REST OF SOUTH AMERICA: LNG STORAGE TANK MARKET SIZE, BY MATERIAL, 2020–2027 (MILLION SQUARE METER)
 
 
9 COMPETITIVE LANDSCAPE (Page No. - 99)
    9.1 INTRODUCTION 
    9.2 MARKET SHARE ANALYSIS 
          FIGURE 20 SHARES OF TOP COMPANIES IN LNG STORAGE TANK MARKET
          TABLE 107 INTENSITY OF COMPETITIVE RIVALRY: LNG STORAGE TANK MARKET
    9.3 MARKET RANKING 
          FIGURE 21 RANKING OF TOP-FIVE PLAYERS IN LNG STORAGE TANK MARKET
    9.4 COMPETITIVE SCENARIO 
          TABLE 108 LNG STORAGE TANK MARKET: NEW PRODUCT LAUNCH/DEVELOPMENT, 2015–2022
          TABLE 109 LNG STORAGE TANK MARKET: DEALS, 2015–2022
          TABLE 110 LNG STORAGE TANK MARKET: OTHER DEVELOPMENTS, 2015–2021
    9.5 COMPANY EVALUATION MATRIX 
           9.5.1 STAR PLAYERS
           9.5.2 PERVASIVE PLAYERS
           9.5.3 PARTICIPANTS
           9.5.4 EMERGING LEADERS
                    FIGURE 22 LNG STORAGE TANK MARKET (GLOBAL): COMPANY EVALUATION MATRIX, 2021
           9.5.5 STRENGTH OF PRODUCT PORTFOLIO
                    FIGURE 23 PRODUCT PORTFOLIO ANALYSIS OF TOP PLAYERS IN LNG STORAGE TANK MARKET
           9.5.6 BUSINESS STRATEGY EXCELLENCE
                    FIGURE 24 BUSINESS STRATEGY EXCELLENCE OF TOP PLAYERS IN LNG STORAGE TANK MARKET
 
10 COMPANY PROFILES (Page No. - 109)
(Business overview, Products/Services/Solutions offered, New product development, Deals, MNM view)*
     10.1 KEY COMPANIES 
             10.1.1 LINDE PLC
                        TABLE 111 LINDE PLC: BUSINESS OVERVIEW
                        FIGURE 25 LINDE PLC: COMPANY SNAPSHOT
             10.1.2 MCDERMOTT INTERNATIONAL INC.
                        TABLE 112 MCDERMOTT INTERNATIONAL INC.: COMPANY OVERVIEW
             10.1.3 WARTSILA
                        TABLE 113 WARTSILA: COMPANY OVERVIEW
                        FIGURE 26 WARTSILA: COMPANY SNAPSHOT
             10.1.4 IHI CORPORATION
                        TABLE 114 IHI CORPORATION: COMPANY OVERVIEW
                        FIGURE 27 IHI CORPORATION: COMPANY SNAPSHOT
             10.1.5 AIR WATER INC.
                        TABLE 115 AIR WATER INC.: COMPANY OVERVIEW
                        FIGURE 28 AIR WATER INC.: COMPANY SNAPSHOT
             10.1.6 CIMC ENRIC
                        TABLE 116 CIMC ENRIC: COMPANY OVERVIEW
                        FIGURE 29 CIMC ENRIC: COMPANY SNAPSHOT
             10.1.7 CHART INDUSTRIES
                        TABLE 117 CHART INDUSTRIES: COMPANY OVERVIEW
                        FIGURE 30 CHART INDUSTRIES: COMPANY SNAPSHOT
             10.1.8 ISISAN A.S.
                        TABLE 118 ISISAN A.S.: COMPANY OVERVIEW
             10.1.9 CRYOLOR
                        TABLE 119 CRYOLOR: COMPANY OVERVIEW
             10.1.10 INOX INDIA
                        TABLE 120 INOX INDIA: COMPANY OVERVIEW
     10.2 OTHER COMPANIES 
             10.2.1 VIJAY TANKS AND VESSELS LTD.
             10.2.2 CORBAN ENERGY GROUP
             10.2.3 LUXI NEW ENERGY EQUIPMENT GROUP CO. LTD.
             10.2.4 VINCI CONSTRUCTION
             10.2.5 MHI ENGINEERING AND INTERNATIONAL PROJECT INDIA LTD.
             10.2.6 LLOYDS ENERGY
             10.2.7 TRANSTECH ENERGY LLC.
             10.2.8 CRYOCAN
             10.2.9 CRYOGAS EQUIPMENT PVT. LTD.
             10.2.10 WHESSOE
             10.2.11 BECHTEL
             10.2.12 KARBONSAN
             10.2.13 SENER GROUP
             10.2.14 MAVERICK ENGINEERING INC.
             10.2.15 CRYOTEKNIK
 
*Details on Business overview, Products/Services/Solutions offered, New product development, Deals, MNM view might not be captured in case of unlisted companies.
 
11 APPENDIX (Page No. - 137)
     11.1 DISCUSSION GUIDE 
     11.2 KNOWLEDGESTORE: MARKETSANDMARKETS’ SUBSCRIPTION PORTAL 
     11.3 CUSTOMIZATION OPTIONS 
     11.4 RELATED REPORTS 
     11.5 AUTHOR DETAILS 

The study involves two major activities in estimating the current size of the LNG storage tank market. Exhaustive secondary research was done to collect information on the market, the peer market, and the parent market. The next step was to validate these findings, assumptions, and sizing with industry experts across the value chain through primary research. Both the top-down and bottom-up approaches were employed to estimate the total market size. After that, market breakdown and data triangulation procedures were used to determine the extent of market segments and sub-segments.

Secondary Research

In the secondary research process, various secondary sources, such as Hoovers, Bloomberg BusinessWeek, and Factiva, were referred to identify and collect information for this study. These secondary sources included annual reports, press releases & investor presentations of companies, white papers, certified publications, articles by recognized authors, gold standard & silver standard websites, regulatory bodies, trade directories, and databases.

Primary Research

The LNG storage tank market comprises several stakeholders, such as raw material suppliers, end-product manufacturers, and regulatory organizations in the supply chain. The demand side is characterized by developments in the LNG storage tank market. The supply side is characterized by market consolidation activities undertaken by the manufacturers. Various primary sources from both the supply and demand sides of the market were interviewed to obtain qualitative and quantitative information.

Following is the breakdown of primary respondents:
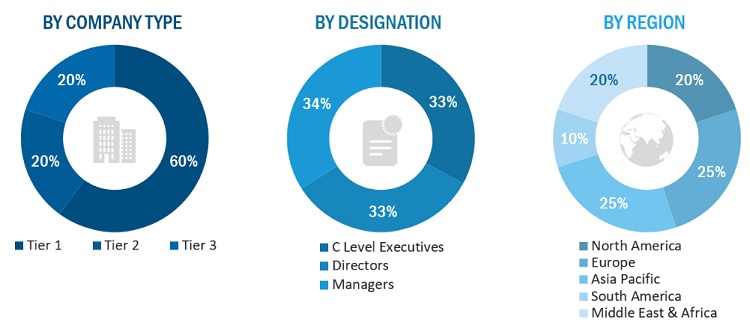
LNG Storage Tank Market Size, and Share

Notes: Tiers of companies are selected based on their ownership and revenues in 2021.

Others include sales managers, marketing managers, and product managers.

Source: Secondary Research, Expert Interviews, and MarketsandMarkets Analysis

To know about the assumptions considered for the study, download the pdf brochure

Market Size Estimation

Both the top-down and bottom-up approaches were used to estimate and validate the total LNG storage tank market. These methods were also used extensively to determine the size of various sub-segments in the market. The research methodology used to estimate the market size included the following:

  • The key players in the industry and markets were identified through extensive secondary research.
  • The industry’s supply chain and market size, in terms of value, were determined through primary and secondary research processes.
  • All percentage shares, splits, and breakdowns were determined using secondary sources and verified through primary sources.

Data Triangulation

After arriving at the overall LNG storage tank market size using the market size estimation processes as explained above, the market was split into several segments and sub-segments. To complete the whole market engineering process and arrive at the exact statistics of each market segment and subsegment, the data triangulation, and market breakdown procedures were employed, wherever applicable. The data was triangulated by studying various factors and trends from both the demand and supply side.

Report Objectives

  • To analyze and forecast the global LNG storage tank market size, in terms of volume and value
  • To provide detailed information about the key factors (drivers, restraints, opportunities, and challenges) influencing the growth of the market
  • To analyze the market segmentation and forecast the market size based on type, and material type
  • To analyze and forecast the market size based on five main regions, namely, Asia Pacific (APAC), Europe, North America, Middle East & Africa (MEA), and South America
  • To analyze the market with respect to individual growth trends, prospects, and contribution of submarkets to the total market
  • To analyze the market opportunities and the competitive landscape for stakeholders and market leaders
  • To analyze competitive developments such as expansions, partnership, agreement, new product/technology launch, joint venture, contract, and merger & acquisition in the market
  • To profile key players and comprehensively analyze their market share and core competencies

Available Customizations

With the given market data, MarketsandMarkets offers customizations according to the company’s specific needs.

The following customization options are available for the report:

Product Analysis

  • Product matrix, which gives a detailed comparison of the product portfolio of each company

Regional Analysis

  • Further breakdown of Rest of APAC LNG storage tank market
  • Further breakdown of Rest of European LNG storage tank market
  • Further breakdown of Rest of North American LNG storage tank market
  • Further breakdown of Rest of MEA LNG storage tank market
  • Further breakdown of Rest of South American LNG storage tank market  

Company Information

  • Detailed analysis and profiling of additional market players (up to 10)
Custom Market Research Services

We will customize the research for you, in case the report listed above does not meet with your exact requirements. Our custom research will comprehensively cover the business information you require to help you arrive at strategic and profitable business decisions.

Request Customization

Instant Answers with GPT - Ask Now!

Ask real questions. Get complete answers !
Report Code
CH 7556
Published ON
Dec, 2022
Choose License Type
BUY NOW
  • SHARE
X
Request Customization
Speak to Analyst
Speak to Analyst
OR FACE-TO-FACE MEETING
PERSONALIZE THIS RESEARCH
  • Triangulate with your Own Data
  • Get Data as per your Format and Definition
  • Gain a Deeper Dive on a Specific Application, Geography, Customer or Competitor
  • Any level of Personalization
REQUEST A FREE CUSTOMIZATION
LET US HELP YOU!
  • What are the Known and Unknown Adjacencies Impacting the LNG Storage Tank Market
  • What will your New Revenue Sources be?
  • Who will be your Top Customer; what will make them switch?
  • Defend your Market Share or Win Competitors
  • Get a Scorecard for Target Partners
CUSTOMIZED WORKSHOP REQUEST
+1-888-600-6441
  • Call Us
  • +1-888-600-6441 (Corporate office hours)
  • +1-888-600-6441 (US/Can toll free)
  • +44-800-368-9399 (UK office hours)
CONNECT WITH US
ABOUT TRUST ONLINE
©2024 MarketsandMarkets Research Private Ltd. All rights reserved
DMCA.com Protection Status Website Feedback