Low Temperature Powder Coatings Market by Substrate (Metal, Non-metal), Resin (Hybrid, Polyester, Epoxy), and End-Use (Furniture, Appliances, Automotive, Medical, Retail, Electronics), and Region - Global Forecast to 2027
Updated on : March 20, 2024
Low Temperature Powder Coatings Market
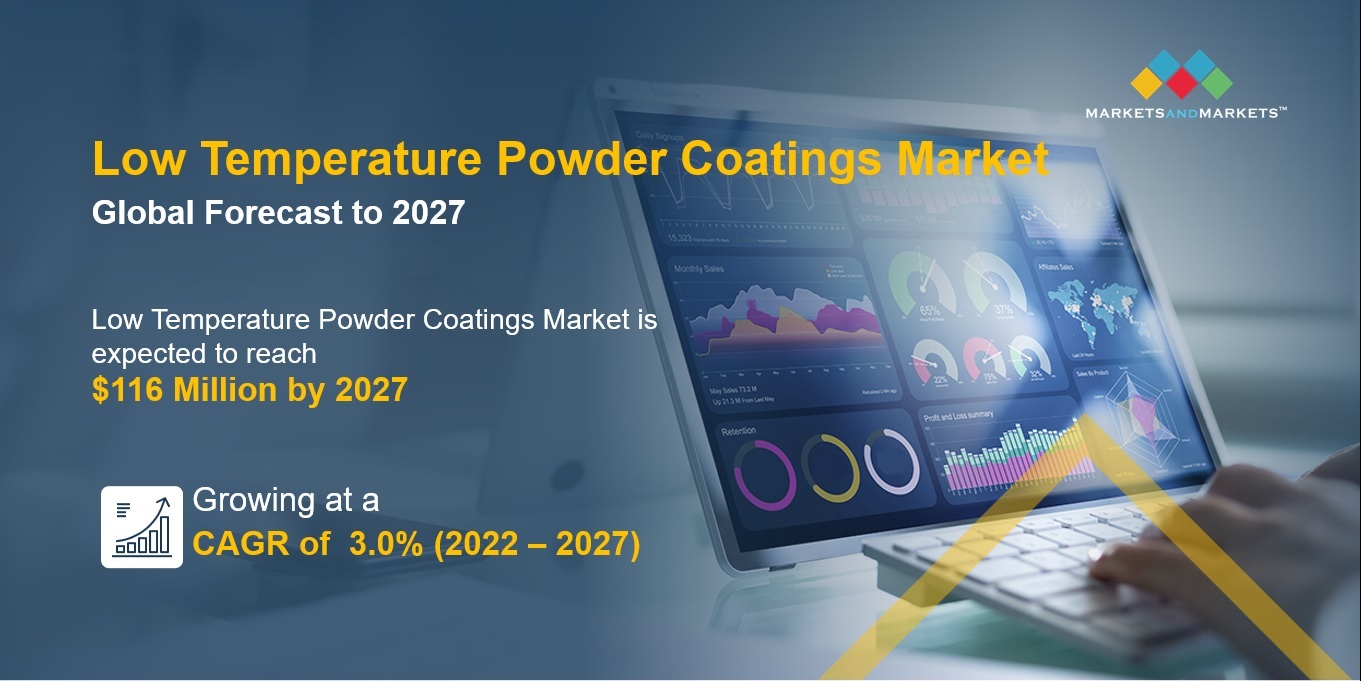
The global low temperature powder coatings market was valued at USD 97 million in 2021 and is projected to reach USD 116 million by 2027, growing at 3.0% cagr from 2022 to 2027. The market is projected to exhibit high growth in the future due to the increasing demand from various applications.
Attractive Opportunities in the Low Temperature Powder Coatings Market
Note: e-estimated p-projected.
Source: Expert Interviews, Secondary Sources, and MarketsandMarkets Analysis
As low temperature powder coatings technology advances, it is anticipated that it will eventually supplant current coating technologies. As low temperature powder coating is increasingly used in a range of end use industries, including automotive and electronics, the global market for these coatings is expected to grow. Low temperature powder coating is highly sought after in the furniture sector for the surface finishing of products made of steel and aluminium, such as site furnishings, MDF furniture, and garden furniture.
To know about the assumptions considered for the study, Request for Free Sample Report
Low Temperature Powder Coatings Market Dynamics
Driver: Increase in energy savings due to reduction in cure temperature
low temperature powder coatings can meet the same performance standards as conventional high-performance coatings while using significantly less energy Due to the lower cure temperature. The cost of energy is influencing buying decisions, and consumers nowadays are considering a combination of factors, such as sustainability, energy-saving, and total product life cycle costs.
Restraint: High-priced product in price competitive market
In a price-competitive market, it is tough to reach out to clients with a new product whose market price is higher than the existing ones. A similar market scenario occurs for low temperature powder coatings, as these coatings are relatively expensive when compared to liquid coatings, which are currently available and dominate the market.
Opportunity: Increasing demand for composites in automotive and aerospace industries
Given that the weight of an electric vehicle is inversely correlated with its range, there is a greater demand for lightweight materials. UV-cured powder coatings are now a practical finishing method due to the demand for metals, polymers, composites, and carbon fibre. Solvents have been eliminated by this technique, which has benefited the market. As more composites are employed to reduce weight, the aircraft sector has a demand for these materials. Here, low-temperature UV-cured powder coatings are ideal for these substrates.
Challenge: High humidity and complex shape of substrates affect performance of coatings
The key issue for end users of low temperature powder coatings is preserving the effectiveness of these coatings in humid environments. Powder adhesion to substrates is frequently hampered by humid circumstances, which encourage clumping. Similar to this, it can be challenging to provide enough coverage of all the sections due to the different geometries of various substrate. The physical restrictions of the curing oven's dimensions, which make it difficult to efficiently cover large products, could be a problem for both manufacturers and users.
Appliances is projected to account for the second-largest share for end use industry in the low temperature powder coatings market, in 2027, in terms of volume.
Low temperature powder coatings is used in a large number of applications, including appliances such as Cookers, freezers, radiator, heater, washing machine and other similar equipment. Low temperature powder coatings provide appealing look, chemical and abrasion resistance. the appliance industry uses powder coatings on both front and side panels of refrigerators, dryers drum, washer tops and lids, dishwasher racks. Low temperature powder coatings are widely used in the appliance industry, which will fuel their market growth throughout the forecast period.
The polyester segment of the resin is projected to register the second highest CAGR during the forecast period.
The polyester resin has excellent outdoor durability and it has also a balanced chemical and wear resistance. Polyester is easy to cure and has a low viscosity. Polyester is high chemical resistance and are especially resistant to solvents. These resins have a wide range of uses and chemistries, including polyester/TGIC, polyester/TGIC-free, super-durable polyester, and polyester-acrylic Hybrid. The application of polyester resin includes automotive wheels, lawn furniture, air conditioners, and air conditioner cabinets. These applications are the factors to drive the market in the forecast period.
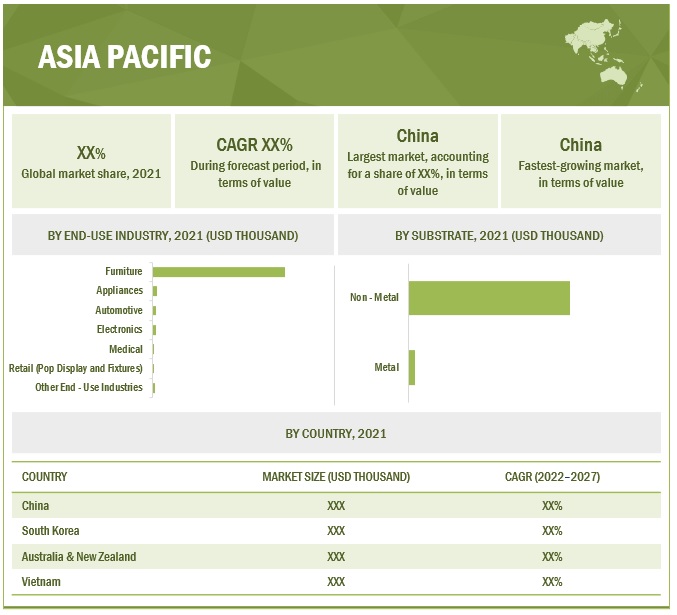
The low temperature powder coatings market in China is expected to account for the largest share of in the low temperature powder coatings market during the forecast period, in terms of value.
In this report, the Asia pacific region is segmented into China, South Korea, Australia & New Zealand, Vietnam, and Rest of Asia Pacific. The continuous rise in the manufacturing of products for consumption and also for exports is driving the demand for low temperature powder coatings in the region. China is an industry hub, with increasing demand for quality products, rising population, and growing end-use industries. The rapid growth of the economy, increasing innovation, and industry consolidations are expected to contribute to the high growth of the low temperature powder coatings market in the region.
To know about the assumptions considered for the study, download the pdf brochure
Low Temperature Powder Coatings Market Players
PPG Industries Inc. (US), Sherwin-Williams Company (US) are some of the players operating in the low temperature powder coatings market.
Please visit 360Quadrants to see the vendor listing of Top paint and coating companies
Low Temperature Powder Coatings Market Report Scope
|
Report Metric |
Details |
|
Market Size Value in 2021 |
USD 97 Million |
|
Revenue Forecast in 2027 |
USD 116 Million |
|
CAGR |
3.0% |
|
Years considered for the study |
2018–2027 |
|
Base year |
2021 |
|
Forecast period |
2022–2027 |
|
Units considered |
Value (USD Million) and Volume (Kiloton) |
|
Segments |
Substrate, Resin, End – Use Industry, and Region |
|
Regions |
Asia Pacific, Europe, North America, and Rest of the World |
|
Companies |
PPG Industries Inc. (US), Sherwin-Williams Company (US) |
This research report categorizes the low temperature powder coatings market based on substrate, resin, end – use industry, and region.
Based on substrate type:
- Metal
- Non-metal
Based on resin type:
- Hybrid
- Polyester
- Epoxy
- Others
Based on end – use industry:
- Furniture
- Appliances
- Automotive
- Medical
- Retail
- Electronics
- Others
Based on region:
- Asia Pacific
- North America
- Europe
- Rest of the World
Recent Developments
- In February 2021, PPG announced the expansion of company acquired VersaFlex, which specializes in polyurea, epoxy and polyurethane coatings for water and wastewater infrastructure, flooring, transportation infrastructure, and industrial applications.
- In October 2021, Sherwin-Williams invested in a 600,000 sq. ft. R&D Center in Brecksville, Ohio. The new facility will support product development, coatings research, color technology and process engineering.
Frequently Asked Questions (FAQ):
What is the mid-to-long term impact of the developments undertaken in the industry?
Continuous developments in the market, including new product launches, mergers & acquisitions, investments & expansions, and partnership and agreement are expected to help the market grow. New product launches/developments, mergers & acquisitions, and investments & expansions are some of the key strategies adopted by the players to achieve growth in the low temperature powder coatings market.
What are the upcoming technologies used in the low temperature powder coatings industry?
During the manufacture of low temperature powder coatings, technologies that do not release VOC fumes or minimal release of VOC fumes are preferred.
Which segment has the potential to register the highest market share?
Furniture segment to register the highest market share of low temperature powder coatings market. The performance and appearance characteristics of coatings such as scratch resistance, appealing look and chemical resistant have led to the high demand for low temperature powder coatings in furniture applications.
What is the current competitive landscape in the low temperature powder coatings market in terms of new technologies, production, and sales?
The competitive landscape of the polyurea coatings market includes the important growth strategies adopted by the key players between 2018 and 2022. PPG Industries Inc. (US), Axalta coating systems (US), Sherwin-Williams Company (US) are the leading players in the low temperature powder coatings market.
What will be the growth prospects of the low temperature powder coatings market?
The drivers of market growth are identified as the Increasing adoption for low temperature powder coating across end-use sectors .
To speak to our analyst for a discussion on the above findings, click Speak to Analyst
TABLE OF CONTENTS
1 INTRODUCTION (Page No. - 38)
1.1 STUDY OBJECTIVES
1.2 MARKET DEFINITION
1.3 MARKET INCLUSIONS & EXCLUSIONS, BY RESIN
1.4 MARKET INCLUSIONS & EXCLUSIONS, BY END-USE INDUSTRY
1.5 STUDY SCOPE
1.5.1 MARKET SCOPE
FIGURE 1 LOW TEMPERATURE POWDER COATINGS: MARKET SEGMENTATION
1.5.2 REGIONAL SCOPE
1.5.3 YEARS CONSIDERED
1.6 CURRENCY
1.7 UNITS CONSIDERED
1.8 LIMITATIONS
1.9 STAKEHOLDERS
2 RESEARCH METHODOLOGY (Page No. - 42)
2.1 RESEARCH DATA
FIGURE 2 LOW TEMPERATURE POWDER COATINGS MARKET: RESEARCH DESIGN
2.1.1 SECONDARY DATA
2.1.1.1 Key data from secondary sources
2.1.2 PRIMARY DATA
2.1.2.1 List of key primary interview participants
2.1.2.2 Key industry insights
2.1.2.3 Breakdown of primary interviews
2.2 MARKET SIZE ESTIMATION
2.2.1 TOP-DOWN APPROACH
FIGURE 3 MARKET SIZE ESTIMATION: TOP-DOWN APPROACH
FIGURE 4 LOW TEMPERATURE POWDER COATINGS MARKET SIZE ESTIMATION: BY VALUE
FIGURE 5 MARKET ESTIMATION, BY REGION
FIGURE 6 MARKET, BY RESIN
2.2.2 BOTTOM-UP APPROACH
FIGURE 7 MARKET ESTIMATION, BY END-USE INDUSTRY
2.3 MARKET FORECAST APPROACH
2.3.1 SUPPLY-SIDE FORECAST
FIGURE 8 MARKET: SUPPLY-SIDE FORECAST
FIGURE 9 METHODOLOGY FOR SUPPLY-SIDE SIZING OF LOW TEMPERATURE POWDER COATINGS MARKET
2.3.2 DEMAND-SIDE FORECAST
FIGURE 10 MARKET: DEMAND-SIDE FORECAST
2.4 FACTOR ANALYSIS
FIGURE 11 FACTOR ANALYSIS OF MARKET
2.5 DATA TRIANGULATION
FIGURE 12 MARKET: DATA TRIANGULATION
2.6 ASSUMPTIONS
2.7 STUDY LIMITATIONS
2.8 GROWTH RATE ASSUMPTIONS/GROWTH FORECAST
3 EXECUTIVE SUMMARY (Page No. - 54)
TABLE 1 LOW TEMPERATURE POWDER COATINGS MARKET SNAPSHOT, 2021 VS. 2027
FIGURE 13 NON-METAL SEGMENT TO HOLD LARGER SHARE OF MARKET IN 2021
FIGURE 14 HYBRID RESIN SEGMENT TO ACCOUNT FOR LARGEST MARKET SIZE IN 2022
FIGURE 15 FURNITURE SEGMENT TO BE FASTEST-GROWING END-USE INDUSTRY
FIGURE 16 APAC TO ACCOUNT FOR LARGEST MARKET SHARE IN 2021
4 PREMIUM INSIGHTS (Page No. - 58)
4.1 ATTRACTIVE OPPORTUNITIES IN LOW TEMPERATURE POWDER COATINGS MARKET
FIGURE 17 HIGH DEMAND FROM FURNITURE INDUSTRY TO DRIVE MARKET
4.2 MARKET, BY SUBSTRATE
FIGURE 18 NON-METAL SEGMENT TO DOMINATE OVERALL LOW TEMPERATURE POWDER COATINGS MARKET
4.3 MARKET, DEVELOPED VS. DEVELOPING COUNTRIES
FIGURE 19 MARKETS IN DEVELOPED COUNTRIES TO GROW FASTER THAN DEVELOPING COUNTRIES
4.4 MARKET IN ASIA PACIFIC, BY END-USE INDUSTRY AND COUNTRY
FIGURE 20 POLAND TO ACCOUNT FOR LARGEST MARKET SHARE IN EUROPE
4.5 MARKET, BY KEY COUNTRY
FIGURE 21 SPAIN TO REGISTER HIGHEST CAGR DURING FORECAST PERIOD
5 MARKET OVERVIEW (Page No. - 61)
5.1 INTRODUCTION
5.2 VALUE CHAIN ANALYSIS
FIGURE 22 LOW TEMPERATURE POWDER COATINGS: VALUE CHAIN ANALYSIS
TABLE 2 LOW TEMPERATURE POWDER COATINGS MARKET: SUPPLY CHAIN ECOSYSTEM
5.3 MARKET DYNAMICS
FIGURE 23 OVERVIEW OF FACTORS GOVERNING MARKET
5.3.1 DRIVERS
5.3.1.1 Increase in energy savings due to reduction in cure temperature
5.3.1.2 Increasing adoption for low temperature powder coating across end-use sectors
5.3.2 RESTRAINTS
5.3.2.1 High-priced product in price-competitive market
5.3.2.2 Difficulty in maintaining storage stability while enabling low temperature curing
5.3.2.3 Requirement of refrigerated storage or transport to extend shelf life
5.3.3 OPPORTUNITIES
5.3.3.1 Low temperature powder coatings suitable for temperature-sensitive components
5.3.3.2 Increasing demand for composites in automotive and aerospace industries
5.3.3.3 Technological advancements
5.3.4 CHALLENGES
5.3.4.1 High humidity and complex shape of substrates affect performance of coatings
5.3.4.2 Mature market of MDF in developed regions to stymie demand for low temperature powder coatings
5.4 PORTER’S FIVE FORCES ANALYSIS
FIGURE 24 LOW TEMPERATURE POWDER COATINGS MARKET: PORTER’S FIVE FORCES ANALYSIS
TABLE 3 MARKET: PORTER’S FIVE FORCES ANALYSIS
5.4.1 THREAT FROM SUBSTITUTES
5.4.2 BARGAINING POWER OF BUYERS
5.4.3 THREAT FROM NEW ENTRANTS
5.4.4 BARGAINING POWER OF SUPPLIERS
5.4.5 INTENSITY OF COMPETITIVE RIVALRY
5.5 KEY STAKEHOLDERS & BUYING CRITERIA
5.5.1 KEY STAKEHOLDERS IN BUYING PROCESS
FIGURE 25 INFLUENCE OF STAKEHOLDERS IN BUYING PROCESS
TABLE 4 INFLUENCE OF STAKEHOLDERS IN BUYING PROCESS FOR TOP INDUSTRIES (%)
5.5.2 BUYING CRITERIA
FIGURE 26 KEY BUYING CRITERIA FOR LOW TEMPERATURE POWDER COATINGS
TABLE 5 KEY BUYING CRITERIA FOR LOW TEMPERATURE POWDER COATINGS
5.6 MACROECONOMIC INDICATORS
5.6.1 INTRODUCTION
5.6.2 GDP TRENDS AND FORECASTS
TABLE 6 GDP TRENDS AND FORECASTS, PERCENTAGE CHANGE
5.7 INDUSTRY TRENDS
5.7.1 TRENDS AND FORECASTS OF GLOBAL AUTOMOTIVE INDUSTRY
TABLE 7 TRENDS AND FORECASTS OF GLOBAL AUTOMOTIVE INDUSTRY
5.8 PAINTS & COATINGS ECOSYSTEM AND INTERCONNECTED MARKETS
TABLE 8 POWDER COATINGS MARKET: SUPPLY CHAIN
FIGURE 27 PAINTS & COATINGS: ECOSYSTEM
5.9 REVENUE SHIFT AND NEW REVENUE POCKETS FOR LOW TEMPERATURE POWDER COATING MANUFACTURERS
FIGURE 28 REVENUE SHIFT IN LOW TEMPERATURE POWDER COATINGS MARKET
5.10 TRENDS/DISRUPTIONS IMPACTING CUSTOMERS’ BUSINESSES
5.10.1 TRENDS AND FORECASTS OF GLOBAL APPLIANCES INDUSTRY
FIGURE 29 TRENDS AND FORECASTS OF GLOBAL APPLIANCES INDUSTRY, 2018–2025 (USD TRILLION)
FIGURE 30 TRENDS AND FORECASTS OF GLOBAL APPLIANCES DISTRIBUTION CHANNEL
5.10.2 TRENDS AND FORECASTS OF GLOBAL FURNITURE INDUSTRY
FIGURE 31 TRENDS AND FORECASTS OF GLOBAL FURNITURE INDUSTRY, 2018–2025 (USD BILLION)
FIGURE 32 TRENDS AND FORECASTS OF GLOBAL FURNITURE INDUSTRY DISTRIBUTION CHANNEL
5.10.3 TRENDS AND FORECASTS OF GLOBAL CONSTRUCTION INDUSTRY
FIGURE 33 GLOBAL SPENDING IN CONSTRUCTION INDUSTRY, 2018–2035 (USD TRILLION)
5.11 TECHNOLOGY ANALYSIS
5.12 PRICING ANALYSIS
FIGURE 34 PRICING ANALYSIS OF LOW TEMPERATURE POWDER COATINGS MARKET, BY REGION, 2021 (USD/KG)
5.12.1 AVERAGE SELLING PRICES, BY END-USE INDUSTRY
FIGURE 35 AVERAGE SELLING PRICES, BY END-USE INDUSTRY, 2021 (USD/KG)
5.13 PATENT ANALYSIS
5.13.1 METHODOLOGY
5.13.2 PUBLICATION TRENDS
FIGURE 36 PUBLICATION TRENDS, 2013–2022
5.13.3 INSIGHTS
5.13.4 JURISDICTION ANALYSIS
FIGURE 37 JURISDICTION ANALYSIS OF REGISTERED PATENTS, 2013–2022
5.13.5 TOP APPLICANTS
FIGURE 38 NUMBER OF PATENTS, BY COMPANY, 2013–2022
5.14 SUPPLY CHAIN CRISES SINCE PANDEMIC
5.15 GLOBAL SCENARIOS
5.15.1 RUSSIA-UKRAINE WAR
5.15.2 CHINA
5.15.2.1 China’s debt problem
5.15.2.2 Australia-China trade war
5.15.2.3 Environmental commitments
5.15.3 EUROPE
5.15.3.1 Political instability in Germany
5.15.3.2 Energy crisis in Europe
5.15.3.3 Manpower issues in the UK
5.16 IMPORT-EXPORT ANALYSIS
TABLE 9 COUNTRY-WISE IMPORT DATA FOR PAINTS AND VARNISHES, 2021
TABLE 10 COUNTRY-WISE EXPORT DATA FOR PAINTS AND VARNISHES, 2021
5.17 GLOBAL REGULATORY FRAMEWORK
5.17.1 LEGISLATIVE & REGULATORY POLICY UPDATE
TABLE 11 INTERNATIONALLY RECOGNIZED TEST METHODS
TABLE 12 LIST OF RELEVANT STANDARDS
5.18 KEY CONFERENCES & EVENTS IN 2022–2023
TABLE 13 LOW TEMPERATURE POWDER COATINGS MARKET: DETAILED LIST OF CONFERENCES & EVENTS
6 LOW TEMPERATURE POWDER COATINGS MARKET, BY SUBSTRATE (Page No. - 96)
6.1 INTRODUCTION
FIGURE 39 NON-METAL SEGMENT TO BE LARGEST SUBSTRATE SEGMENT
TABLE 14 MARKET, BY SUBSTRATE, 2018–2021 (TON)
TABLE 15 MARKET, BY SUBSTRATE, 2022–2027 (TON)
TABLE 16 MARKET, BY SUBSTRATE, 2018–2021 (THOUSAND USD)
TABLE 17 MARKET, BY SUBSTRATE, 2022–2027 (THOUSAND USD)
6.2 NON-METAL
6.2.1 MEDIUM-DENSITY FIBERBOARD TO DRIVE DEMAND FOR LOW TEMPERATURE POWDER COATINGS
TABLE 18 NON-METAL SUBSTRATE: MARKET, BY REGION, 2018–2021 (TON)
TABLE 19 NON-METAL SUBSTRATE: MARKET, BY REGION, 2022–2027 (TON)
TABLE 20 NON-METAL SUBSTRATE: MARKET, BY REGION, 2018–2021 (THOUSAND USD)
TABLE 21 NON-METAL SUBSTRATE: MARKET, BY REGION, 2022–2027 (THOUSAND USD)
6.2.2 WOOD
TABLE 22 WOOD SUBSTRATE: MARKET, BY REGION, 2018–2021 (TON)
TABLE 23 WOOD SUBSTRATE: MARKET, BY REGION, 2022–2027 (TON)
TABLE 24 WOOD SUBSTRATE: MARKET, BY REGION, 2018–2021 (THOUSAND USD)
TABLE 25 WOOD SUBSTRATE: MARKET, BY REGION, 2022–2027 (THOUSAND USD)
6.2.3 PLASTICS, COMPOSITES, AND GLASS
TABLE 26 PLASTICS, COMPOSITES, AND GLASS SUBSTRATE: LOW TEMPERATURE POWDER COATINGS MARKET, BY REGION, 2018–2021 (TON)
TABLE 27 PLASTICS, COMPOSITES, AND GLASS SUBSTRATE: MARKET, BY REGION, 2022–2027 (TON)
TABLE 28 PLASTICS, COMPOSITES, AND GLASS SUBSTRATE: MARKET, BY REGION, 2018–2021 (THOUSAND USD)
TABLE 29 PLASTICS, COMPOSITES, AND GLASS SUBSTRATE: MARKET, BY REGION, 2022–2027 (THOUSAND USD)
6.3 METAL
6.3.1 ASIA PACIFIC REGION TO DRIVE DEMAND FOR LOW TEMPERATURE POWDER COATINGS
TABLE 30 METAL SUBSTRATE: LOW TEMPERATURE POWDER COATINGS MARKET, BY REGION, 2018–2021 (TON)
TABLE 31 METAL SUBSTRATE: MARKET, BY REGION, 2022–2027 (TON)
TABLE 32 METAL SUBSTRATE: MARKET, BY REGION, 2018–2021 (THOUSAND USD)
TABLE 33 METAL SUBSTRATE: MARKET, BY REGION, 2022–2027 (THOUSAND USD)
7 LOW TEMPERATURE POWDER COATINGS MARKET, BY RESIN (Page No. - 106)
7.1 INTRODUCTION
FIGURE 40 HYBRID SEGMENT TO ACCOUNT FOR LARGEST SHARE DURING FORECAST PERIOD
7.1.1 THERMOSETTING POWDER COATING CHEMISTRY
TABLE 34 THERMOSETTING POWDER COATING CHEMISTRY
7.1.2 UV CURABLE POWDER COATING CHEMISTRY
TABLE 35 UV CURABLE POWDER COATING CHEMISTRY
TABLE 36 LOW TEMPERATURE POWDER COATINGS MARKET, BY RESIN, 2018–2021 (TON)
TABLE 37 MARKET, BY RESIN, 2022–2027 (TON)
TABLE 38 MARKET, BY RESIN, 2018–2021 (THOUSAND USD)
TABLE 39 MARKET, BY RESIN, 2022–2027 (THOUSAND USD)
7.2 HYBRID
7.2.1 FEWER DURABILITY REQUIREMENTS TO DRIVE DEMAND FOR HYBRID DESIGNS FOR INDOOR APPLICATIONS
TABLE 40 HYBRID: LOW TEMPERATURE POWDER COATINGS MARKET, BY REGION, 2018–2021 (TON)
TABLE 41 HYBRID: MARKET, BY REGION, 2022–2027 (TON)
TABLE 42 HYBRID: MARKET, BY REGION, 2018–2021 (THOUSAND USD)
TABLE 43 HYBRID: MARKET, BY REGION, 2022–2027 (THOUSAND USD)
7.3 POLYESTER
7.3.1 GOOD-TO-EXCELLENT OUTDOOR DURABILITY AND BALANCE OF CHEMICAL AND WEAR RESISTANCE
TABLE 44 POLYESTER: LOW TEMPERATURE POWDER COATINGS MARKET, BY REGION, 2018–2021 (TON)
TABLE 45 POLYESTER: MARKET, BY REGION, 2022–2027 (TON)
TABLE 46 POLYESTER: MARKET, BY REGION, 2018–2021 (THOUSAND USD)
TABLE 47 POLYESTER: MARKET, BY REGION, 2022–2027 (THOUSAND USD)
7.4 EPOXY
7.4.1 EXCELLENT CHEMICAL RESISTANCE, HARDNESS, AND WEAR RESISTANCE
TABLE 48 EPOXY: LOW TEMPERATURE POWDER COATINGS MARKET, BY REGION, 2018–2021 (TON)
TABLE 49 EPOXY: MARKET, BY REGION, 2022–2027 (TON)
TABLE 50 EPOXY: MARKET, BY REGION, 2018–2021 (THOUSAND USD)
TABLE 51 EPOXY: MARKET, BY REGION, 2022–2027 (THOUSAND USD)
7.5 OTHER RESINS
TABLE 52 OTHER RESINS: LOW TEMPERATURE POWDER COATINGS MARKET, BY REGION, 2018–2021 (TON)
TABLE 53 OTHER RESINS: MARKET, BY REGION, 2022–2027 (TON)
TABLE 54 OTHER RESINS: MARKET, BY REGION, 2018–2021 (THOUSAND USD)
TABLE 55 OTHER RESINS: MARKET, BY REGION, 2022–2027 (THOUSAND USD)
7.5.1 ACRYLIC
7.5.2 POLYURETHANE
8 LOW TEMPERATURE POWDER COATINGS MARKET, BY END-USE INDUSTRY (Page No. - 117)
8.1 INTRODUCTION
FIGURE 41 FURNITURE SEGMENT TO BE LARGEST END USER OF LOW TEMPERATURE POWDER COATINGS
TABLE 56 LOW TEMPERATURE POWDER COATINGS MARKET, BY END-USE INDUSTRY, 2018–2021 (TON)
TABLE 57 MARKET, BY END-USE INDUSTRY, 2022–2027 (TON)
TABLE 58 MARKET, BY END-USE INDUSTRY, 2018–2021 (THOUSAND USD)
TABLE 59 MARKET, BY END-USE INDUSTRY, 2022–2027 (THOUSAND USD)
8.2 FURNITURE
8.2.1 HIGH DEMAND FOR MDF-BASED FURNITURE
TABLE 60 FURNITURE: LOW TEMPERATURE POWDER COATINGS MARKET, BY REGION, 2018–2021 (TON)
TABLE 61 FURNITURE: MARKET, BY REGION, 2022–2027 (TON)
TABLE 62 FURNITURE: MARKET, BY REGION, 2018–2021 (THOUSAND USD)
TABLE 63 FURNITURE: MARKET, BY REGION, 2022–2027 (THOUSAND USD)
8.3 APPLIANCES
8.3.1 INCREASE IN PER CAPITA INCOME AND CONSUMER SPENDING ON APPLIANCES
TABLE 64 APPLIANCES: LOW TEMPERATURE POWDER COATINGS MARKET, BY REGION, 2018–2021 (TON)
TABLE 65 APPLIANCES: MARKET, BY REGION, 2022–2027 (TON)
TABLE 66 APPLIANCES: MARKET, BY REGION, 2018–2021 (THOUSAND USD)
TABLE 67 APPLIANCES: MARKET, BY REGION, 2022–2027 (THOUSAND USD)
8.4 AUTOMOTIVE
8.4.1 GREATER DEMAND FOR COMPOSITES IN AUTOMOTIVE INDUSTRY TO OFFER LUCRATIVE OPPORTUNITIES
TABLE 68 AUTOMOTIVE: LOW TEMPERATURE POWDER COATINGS MARKET, BY REGION, 2018–2021 (TON)
TABLE 69 AUTOMOTIVE: MARKET, BY REGION, 2022–2027 (TON)
TABLE 70 AUTOMOTIVE: MARKET, BY REGION, 2018–2021 (THOUSAND USD)
TABLE 71 AUTOMOTIVE: MARKET, BY REGION, 2022–2027 (THOUSAND USD)
8.5 MEDICAL
8.5.1 NEW APPLICATIONS IN MEDICAL INDUSTRY TO BOOST DEMAND FOR LOW TEMPERATURE POWDER COATINGS
TABLE 72 MEDICAL: LOW TEMPERATURE POWDER COATINGS MARKET, BY REGION, 2018–2021 (TON)
TABLE 73 MEDICAL: MARKET, BY REGION, 2022–2027 (TON)
TABLE 74 MEDICAL: MARKET, BY REGION, 2018–2021 (THOUSAND USD)
TABLE 75 MEDICAL: MARKET, BY REGION, 2022–2027 (THOUSAND USD)
8.6 RETAIL
8.6.1 HIGHER USE OF POP DISPLAYS AND STORE FIXTURES TO FUEL MARKET IN RETAIL INDUSTRY
TABLE 76 RETAIL: MARKET, BY REGION, 2018–2021 (TON)
TABLE 77 RETAIL: MARKET, BY REGION, 2022–2027 (TON)
TABLE 78 RETAIL: MARKET, BY REGION, 2018–2021 (THOUSAND USD)
TABLE 79 RETAIL: LOW TEMPERATURE POWDER COATINGS MARKET, BY REGION, 2022–2027 (THOUSAND USD)
8.7 ELECTRONICS
8.7.1 DEMAND FOR HIGHLY EFFICIENT PROTECTIVE COATING TO SPUR MARKET GROWTH
TABLE 80 ELECTRONICS: LOW TEMPERATURE POWDER COATINGS MARKET, BY REGION, 2018–2021 (TON)
TABLE 81 ELECTRONICS: MARKET, BY REGION, 2022–2027 (TON)
TABLE 82 ELECTRONICS: MARKET, BY REGION, 2018–2021 (THOUSAND USD)
TABLE 83 ELECTRONICS: MARKET, BY REGION, 2022–2027 (THOUSAND USD)
8.8 OTHER END-USE INDUSTRIES
TABLE 84 OTHER END-USE INDUSTRIES: LOW TEMPERATURE POWDER COATINGS MARKET, BY REGION, 2018–2021 (TON)
TABLE 85 OTHER END-USE INDUSTRIES: MARKET, BY REGION, 2022–2027 (TON)
TABLE 86 OTHER END-USE INDUSTRIES: MARKET, BY REGION, 2018–2021 (THOUSAND USD)
TABLE 87 OTHER END-USE INDUSTRIES: MARKET, BY REGION, 2022–2027 (THOUSAND USD)
9 LOW TEMPERATURE POWDER COATINGS MARKET, BY REGION (Page No. - 132)
9.1 INTRODUCTION
FIGURE 42 ASIA PACIFIC COUNTRIES TO EMERGE AS STRATEGIC LOCATIONS FOR LOW TEMPERATURE POWDER COATINGS MARKET
TABLE 88 MARKET, BY SUBSTRATE, 2018–2021 (TON)
TABLE 89 MARKET, BY SUBSTRATE, 2022–2027 (TON)
TABLE 90 MARKET, BY SUBSTRATE, 2018–2021 (THOUSAND USD)
TABLE 91 MARKET, BY SUBSTRATE, 2022–2027 (THOUSAND USD)
TABLE 92 MARKET, BY RESIN, 2018–2021 (TON)
TABLE 93 MARKET, BY RESIN, 2022–2027 (TON)
TABLE 94 MARKET, BY RESIN, 2018–2021 (THOUSAND USD)
TABLE 95 MARKET, BY RESIN, 2022–2027 (THOUSAND USD)
TABLE 96 MARKET, BY END-USE INDUSTRY, 2018–2021 (TON)
TABLE 97 MARKET, BY END-USE INDUSTRY, 2022–2027 (TON)
TABLE 98 MARKET, BY END-USE INDUSTRY, 2018–2021 (THOUSAND USD)
TABLE 99 MARKET, BY END-USE INDUSTRY, 2022–2027 (THOUSAND USD)
TABLE 100 MARKET, BY REGION, 2018–2021 (TON)
TABLE 101 MARKET, BY REGION, 2022–2027 (TON)
TABLE 102 MARKET, BY REGION, 2018–2021 (THOUSAND USD)
TABLE 103 MARKET, BY REGION, 2022–2027 (THOUSAND USD)
9.2 EUROPE
FIGURE 43 EUROPE: LOW TEMPERATURE POWDER COATINGS MARKET SNAPSHOT
TABLE 104 EUROPE: MARKET, BY SUBSTRATE, 2018–2021 (TON)
TABLE 105 EUROPE: MARKET, BY SUBSTRATE, 2022–2027 (TON)
TABLE 106 EUROPE: MARKET, BY SUBSTRATE, 2018–2021 (THOUSAND USD)
TABLE 107 EUROPE: MARKET, BY SUBSTRATE, 2022–2027 (THOUSAND USD)
TABLE 108 EUROPE: MARKET, BY RESIN, 2018–2021 (TON)
TABLE 109 EUROPE: MARKET, BY RESIN, 2022–2027 (TON)
TABLE 110 EUROPE: MARKET, BY RESIN, 2018–2021 (THOUSAND USD)
TABLE 111 EUROPE: MARKET, BY RESIN, 2022–2027 (THOUSAND USD)
TABLE 112 EUROPE: MARKET, BY END-USE INDUSTRY, 2018–2021 (TON)
TABLE 113 EUROPE: MARKET, BY END-USE INDUSTRY, 2022–2027 (TON)
TABLE 114 EUROPE: MARKET, BY END-USE INDUSTRY, 2018–2021 (THOUSAND USD)
TABLE 115 EUROPE: MARKET, BY END-USE INDUSTRY, 2022–2027 (THOUSAND USD)
TABLE 116 EUROPE: MARKET, BY COUNTRY, 2018–2021 (TON)
TABLE 117 EUROPE: MARKET, BY COUNTRY, 2022–2027 (TON)
TABLE 118 EUROPE: MARKET, BY COUNTRY, 2018–2021 (THOUSAND USD)
TABLE 119 EUROPE: MARKET, BY COUNTRY, 2022–2027 (THOUSAND USD)
9.2.1 LIST OF MEDIUM-DENSITY FIBERBOARD MANUFACTURERS
9.2.2 POLAND
9.2.2.1 Increase in exports of furniture to fuel market growth
TABLE 120 POLAND: LOW TEMPERATURE POWDER COATINGS MARKET, BY SUBSTRATE, 2018–2021 (TON)
TABLE 121 POLAND: MARKET, BY SUBSTRATE, 2022–2027 (TON)
TABLE 122 POLAND: MARKET, BY SUBSTRATE, 2018–2021 (THOUSAND USD)
TABLE 123 POLAND: MARKET, BY SUBSTRATE, 2022–2027 (THOUSAND USD)
9.2.3 GERMANY
9.2.3.1 Developments and investments by manufacturers to boost growth
TABLE 124 GERMANY: LOW TEMPERATURE POWDER COATINGS MARKET, BY SUBSTRATE, 2018–2021 (TON)
TABLE 125 GERMANY: MARKET, BY SUBSTRATE, 2022–2027 (TON)
TABLE 126 GERMANY: MARKET, BY SUBSTRATE, 2018–2021 (THOUSAND USD)
TABLE 127 GERMANY: MARKET, BY SUBSTRATE, 2022–2027 (THOUSAND USD)
9.2.4 SPAIN
9.2.4.1 Recovery of economy, rising domestic demand, and exports to drive market
TABLE 128 SPAIN: LOW TEMPERATURE POWDER COATINGS MARKET, BY SUBSTRATE, 2018–2021 (TON)
TABLE 129 SPAIN: MARKET, BY SUBSTRATE, 2022–2027 (TON)
TABLE 130 SPAIN: MARKET, BY SUBSTRATE, 2018–2021 (THOUSAND USD)
TABLE 131 SPAIN: MARKET, BY SUBSTRATE, 2022–2027 (THOUSAND USD)
9.2.5 FRANCE
9.2.5.1 Expected growth in construction sector to boost market
TABLE 132 FRANCE: LOW TEMPERATURE POWDER COATINGS MARKET, BY SUBSTRATE, 2018–2021 (TON)
TABLE 133 FRANCE: MARKET, BY SUBSTRATE, 2022–2027 (TON)
TABLE 134 FRANCE: MARKET, BY SUBSTRATE, 2018–2021 (THOUSAND USD)
TABLE 135 FRANCE: MARKET, BY SUBSTRATE, 2022–2027 (THOUSAND USD)
9.2.6 UK
9.2.6.1 Economic growth, increase in consumer spending, and changing consumer preference to drive demand
TABLE 136 UK: LOW TEMPERATURE POWDER COATINGS MARKET, BY SUBSTRATE, 2018–2021 (TON)
TABLE 137 UK: MARKET, BY SUBSTRATE, 2022–2027 (TON)
TABLE 138 UK: MARKET, BY SUBSTRATE, 2018–2021 (THOUSAND USD)
TABLE 139 UK: MARKET, BY SUBSTRATE, 2022–2027 (THOUSAND USD)
9.2.7 ROMANIA
9.2.7.1 Strong investments to boost market
TABLE 140 ROMANIA: LOW TEMPERATURE POWDER COATINGS MARKET, BY SUBSTRATE, 2018–2021 (TON)
TABLE 141 ROMANIA: MARKET, BY SUBSTRATE, 2022–2027 (TON)
TABLE 142 ROMANIA: MARKET, BY SUBSTRATE, 2018–2021 (THOUSAND USD)
TABLE 143 ROMANIA: MARKET, BY SUBSTRATE, 2022–2027 (THOUSAND USD)
9.2.8 ITALY
9.2.8.1 Growth in GDP and domestic demand to drive market
TABLE 144 ITALY: LOW TEMPERATURE POWDER COATINGS MARKET, BY SUBSTRATE, 2018–2021 (TON)
TABLE 145 ITALY: MARKET, BY SUBSTRATE, 2022–2027 (TON)
TABLE 146 ITALY: MARKET, BY SUBSTRATE, 2018–2021 (THOUSAND USD)
TABLE 147 ITALY: MARKET, BY SUBSTRATE, 2022–2027 (THOUSAND USD)
9.2.9 REST OF EUROPE
TABLE 148 REST OF EUROPE: LOW TEMPERATURE POWDER COATINGS MARKET, BY SUBSTRATE, 2018–2021 (TON)
TABLE 149 REST OF EUROPE: MARKET, BY SUBSTRATE, 2022–2027 (TON)
TABLE 150 REST OF EUROPE: MARKET, BY SUBSTRATE, 2018–2021 (THOUSAND USD)
TABLE 151 REST OF EUROPE: MARKET, BY SUBSTRATE, 2022–2027 (THOUSAND USD)
9.3 ASIA PACIFIC
FIGURE 44 ASIA PACIFIC: LOW TEMPERATURE POWDER COATINGS MARKET SNAPSHOT
TABLE 152 ASIA PACIFIC: MARKET, BY SUBSTRATE, 2018–2021 (TON)
TABLE 153 ASIA PACIFIC: MARKET, BY SUBSTRATE, 2022–2027 (TON)
TABLE 154 ASIA PACIFIC: MARKET, BY SUBSTRATE, 2018–2021 (THOUSAND USD)
TABLE 155 ASIA PACIFIC: MARKET, BY SUBSTRATE, 2022–2027 (THOUSAND USD)
TABLE 156 ASIA PACIFIC: MARKET, BY RESIN, 2018–2021 (TON)
TABLE 157 ASIA PACIFIC: MARKET, BY RESIN, 2022–2027 (TON)
TABLE 158 ASIA PACIFIC: MARKET, BY RESIN, 2018–2021 (THOUSAND USD)
TABLE 159 ASIA PACIFIC: MARKET, BY RESIN, 2022–2027 (THOUSAND USD)
TABLE 160 ASIA PACIFIC: MARKET, BY END-USE INDUSTRY, 2018–2021 (TON)
TABLE 161 ASIA PACIFIC: MARKET, BY END-USE INDUSTRY, 2022–2027 (TON)
TABLE 162 ASIA PACIFIC: MARKET, BY END-USE INDUSTRY, 2018–2021 (THOUSAND USD)
TABLE 163 ASIA PACIFIC: MARKET, BY END-USE INDUSTRY, 2022–2027 (THOUSAND USD)
TABLE 164 ASIA PACIFIC: MARKET, BY COUNTRY, 2018–2021 (TON)
TABLE 165 ASIA PACIFIC: MARKET, BY COUNTRY, 2022–2027 (TON)
TABLE 166 ASIA PACIFIC: MARKET, BY COUNTRY, 2018–2021 (THOUSAND USD)
TABLE 167 ASIA PACIFIC: MARKET, BY COUNTRY, 2022–2027 (THOUSAND USD)
9.3.1 CHINA
9.3.1.1 High demand from furniture, appliances, and automotive industries to drive market
TABLE 168 CHINA: LOW TEMPERATURE POWDER COATINGS MARKET, BY SUBSTRATE, 2018–2021 (TON)
TABLE 169 CHINA: MARKET, BY SUBSTRATE, 2022–2027 (TON)
TABLE 170 CHINA: MARKET, BY SUBSTRATE, 2018–2021 (THOUSAND USD)
TABLE 171 CHINA: MARKET, BY SUBSTRATE, 2022–2027 (THOUSAND USD)
9.3.2 SOUTH KOREA
9.3.2.1 S TABLE economic growth and global integration to help boost market growth
TABLE 172 SOUTH KOREA: LOW TEMPERATURE POWDER COATINGS MARKET, BY SUBSTRATE, 2018–2021 (TON)
TABLE 173 SOUTH KOREA: MARKET, BY SUBSTRATE, 2022–2027 (TON)
TABLE 174 SOUTH KOREA: MARKET, BY SUBSTRATE, 2018–2021 (THOUSAND USD)
TABLE 175 SOUTH KOREA: MARKET, BY SUBSTRATE, 2022–2027 (THOUSAND USD)
9.3.3 VIETNAM
9.3.3.1 High economic growth and high-tech industrialized economy to drive growth
TABLE 176 VIETNAM: LOW TEMPERATURE POWDER COATINGS MARKET, BY SUBSTRATE, 2018–2021 (TON)
TABLE 177 VIETNAM: MARKET, BY SUBSTRATE, 2022–2027 (TON)
TABLE 178 VIETNAM: MARKET, BY SUBSTRATE, 2018–2021 (THOUSAND USD)
TABLE 179 VIETNAM: MARKET, BY SUBSTRATE, 2022–2027 (THOUSAND USD)
9.3.4 AUSTRALIA & NEW ZEALAND
9.3.4.1 Improvement in residential construction to propel demand in architectural industry
TABLE 180 AUSTRALIA & NEW ZEALAND: LOW TEMPERATURE POWDER COATINGS MARKET, BY SUBSTRATE, 2018–2021 (TON)
TABLE 181 AUSTRALIA & NEW ZEALAND: MARKET, BY SUBSTRATE, 2022–2027 (TON)
TABLE 182 AUSTRALIA & NEW ZEALAND: MARKET, BY SUBSTRATE, 2018–2021 (THOUSAND USD)
TABLE 183 AUSTRALIA & NEW ZEALAND: MARKET, BY SUBSTRATE, 2022–2027 (THOUSAND USD)
9.3.5 REST OF ASIA PACIFIC
TABLE 184 REST OF ASIA PACIFIC: LOW TEMPERATURE POWDER COATINGS MARKET, BY SUBSTRATE, 2018–2021 (TON)
TABLE 185 REST OF ASIA PACIFIC: MARKET, BY SUBSTRATE, 2022–2027 (TON)
TABLE 186 REST OF ASIA PACIFIC: MARKET, BY SUBSTRATE, 2018–2021 (THOUSAND USD)
TABLE 187 REST OF ASIA PACIFIC: MARKET, BY SUBSTRATE, 2022–2027 (THOUSAND USD)
9.4 NORTH AMERICA
FIGURE 45 NORTH AMERICA: LOW TEMPERATURE POWDER COATINGS MARKET SNAPSHOT
TABLE 188 NORTH AMERICA: MARKET, BY SUBSTRATE, 2018–2021 (TON)
TABLE 189 NORTH AMERICA: MARKET, BY SUBSTRATE, 2022–2027 (TON)
TABLE 190 NORTH AMERICA: MARKET, BY SUBSTRATE, 2018–2021 (THOUSAND USD)
TABLE 191 NORTH AMERICA: MARKET, BY SUBSTRATE, 2022–2027 (THOUSAND USD)
TABLE 192 NORTH AMERICA: MARKET, BY RESIN, 2018–2021 (TON)
TABLE 193 NORTH AMERICA: MARKET, BY RESIN, 2022–2027 (TON)
TABLE 194 NORTH AMERICA: MARKET, BY RESIN, 2018–2021 (THOUSAND USD)
TABLE 195 NORTH AMERICA: MARKET, BY RESIN, 2022–2027 (THOUSAND USD)
TABLE 196 NORTH AMERICA: MARKET, BY END-USE INDUSTRY, 2018–2021 (TON)
TABLE 197 NORTH AMERICA: MARKET, BY END-USE INDUSTRY, 2022–2027 (TON)
TABLE 198 NORTH AMERICA: MARKET, BY END-USE INDUSTRY, 2018–2021 (THOUSAND USD)
TABLE 199 NORTH AMERICA: MARKET, BY END-USE INDUSTRY, 2022–2027 (THOUSAND USD)
TABLE 200 NORTH AMERICA: MARKET, BY COUNTRY, 2018–2021 (TON)
TABLE 201 NORTH AMERICA: MARKET, BY COUNTRY, 2022–2027 (TON)
TABLE 202 NORTH AMERICA: MARKET, BY COUNTRY, 2018–2021 (THOUSAND USD)
TABLE 203 NORTH AMERICA: MARKET, BY COUNTRY, 2022–2027 (THOUSAND USD)
9.4.1 US
9.4.1.1 Mature US market to witness steady growth rate
TABLE 204 US: LOW TEMPERATURE POWDER COATINGS MARKET, BY SUBSTRATE, 2018–2021 (TON)
TABLE 205 US: MARKET, BY SUBSTRATE, 2022–2027 (TON)
TABLE 206 US: MARKET, BY SUBSTRATE, 2018–2021 (THOUSAND USD)
TABLE 207 US: MARKET, BY SUBSTRATE, 2022–2027 (THOUSAND USD)
9.4.2 CANADA
9.4.2.1 Proximity to US to support market growth
TABLE 208 CANADA: LOW TEMPERATURE POWDER COATINGS MARKET, BY SUBSTRATE, 2018–2021 (TON)
TABLE 209 CANADA: MARKET, BY SUBSTRATE, 2022–2027 (TON)
TABLE 210 CANADA: MARKET, BY SUBSTRATE, 2018–2021 (THOUSAND USD)
TABLE 211 CANADA: MARKET, BY SUBSTRATE, 2022–2027 (THOUSAND USD)
9.4.3 MEXICO
9.4.3.1 Changing monetary and fiscal policies to support market growth
TABLE 212 MEXICO: LOW TEMPERATURE POWDER COATINGS MARKET, BY SUBSTRATE, 2018–2021 (TON)
TABLE 213 MEXICO: MARKET, BY SUBSTRATE, 2022–2027 (TON)
TABLE 214 MEXICO: MARKET, BY SUBSTRATE, 2018–2021 (THOUSAND USD)
TABLE 215 MEXICO: MARKET, BY SUBSTRATE, 2022–2027 (THOUSAND USD)
9.5 REST OF THE WORLD
FIGURE 46 ROW: LOW TEMPERATURE POWDER COATINGS MARKET SNAPSHOT
TABLE 216 ROW: MARKET, BY SUBSTRATE, 2018–2021 (TON)
TABLE 217 ROW: MARKET, BY SUBSTRATE, 2022–2027 (TON)
TABLE 218 ROW: MARKET, BY SUBSTRATE, 2018–2021 (THOUSAND USD)
TABLE 219 ROW: MARKET, BY SUBSTRATE, 2022–2027 (THOUSAND USD)
TABLE 220 ROW: MARKET, BY RESIN, 2018–2021 (TON)
TABLE 221 ROW: MARKET, BY RESIN, 2022–2027 (TON)
TABLE 222 ROW: MARKET, BY RESIN, 2018–2021 (THOUSAND USD)
TABLE 223 ROW: MARKET, BY RESIN, 2022–2027 (THOUSAND USD)
TABLE 224 ROW: MARKET, BY END-USE INDUSTRY, 2018–2021 (TON)
TABLE 225 ROW: MARKET, BY END-USE INDUSTRY, 2022–2027 (TON)
TABLE 226 ROW: MARKET, BY END-USE INDUSTRY, 2018–2021 (THOUSAND USD)
TABLE 227 ROW: MARKET, BY END-USE INDUSTRY, 2022–2027 (THOUSAND USD)
9.5.1 SOUTH AMERICA
TABLE 228 SOUTH AMERICA: LOW TEMPERATURE POWDER COATINGS MARKET, BY SUBSTRATE, 2018–2021 (TON)
TABLE 229 SOUTH AMERICA: MARKET, BY SUBSTRATE, 2022–2027 (TON)
TABLE 230 SOUTH AMERICA: MARKET, BY SUBSTRATE, 2018–2021 (THOUSAND USD)
TABLE 231 SOUTH AMERICA: MARKET, BY SUBSTRATE, 2022–2027 (THOUSAND USD)
9.5.1.1 Brazil
9.5.1.1.1 Fast-growing automotive industry to support market growth
9.5.1.2 Argentina
9.5.1.2.1 Changing lifestyles to support market growth
9.5.1.3 Rest of South America
9.5.2 MIDDLE EAST & AFRICA
TABLE 232 MIDDLE EAST & AFRICA: LOW TEMPERATURE POWDER COATINGS MARKET, BY SUBSTRATE, 2018–2021 (TON)
TABLE 233 MIDDLE EAST & AFRICA: MARKET, BY SUBSTRATE, 2022–2027 (TON)
TABLE 234 MIDDLE EAST & AFRICA: MARKET, BY SUBSTRATE, 2018–2021 (THOUSAND USD)
TABLE 235 MIDDLE EAST & AFRICA: MARKET, BY SUBSTRATE, 2022–2027 (THOUSAND USD)
10 COMPETITIVE LANDSCAPE (Page No. - 197)
10.1 OVERVIEW
TABLE 236 STRATEGIES ADOPTED BY KEY MANUFACTURERS OF LOW TEMPERATURE POWDER COATINGS
10.2 MARKET SHARE ANALYSIS
FIGURE 47 MARKET SHARE ANALYSIS OF KEY PLAYERS, 2021
10.3 MARKET RANKING ANALYSIS
FIGURE 48 RANKING OF KEY PLAYERS
10.4 COMPANY REVENUE ANALYSIS
FIGURE 49 REVENUE ANALYSIS FOR KEY COMPANIES DURING PAST FIVE YEARS
10.5 COMPETITIVE LEADERSHIP MAPPING, 2021
10.5.1 STARS
10.5.2 EMERGING LEADERS
10.5.3 PERVASIVE PLAYERS
10.5.4 EMERGING COMPANIES
FIGURE 50 LOW TEMPERATURE POWDER COATINGS MARKET: COMPETITIVE LEADERSHIP MAPPING, 2021
10.6 SME MATRIX, 2021
10.6.1 PROGRESSIVE COMPANIES
10.6.2 DYNAMIC COMPANIES
10.6.3 STARTING BLOCKS
10.6.4 RESPONSIVE COMPANIES
FIGURE 51 LOW TEMPERATURE POWDER COATINGS MARKET: EMERGING COMPANIES' COMPETITIVE LEADERSHIP MAPPING, 2021
10.7 STRENGTH OF PRODUCT PORTFOLIO
FIGURE 52 PRODUCT PORTFOLIO ANALYSIS OF TOP PLAYERS IN LOW TEMPERATURE POWDER COATINGS MARKET
10.8 BUSINESS STRATEGY EXCELLENCE
FIGURE 53 BUSINESS STRATEGY EXCELLENCE OF TOP PLAYERS IN LOW TEMPERATURE POWDER COATINGS MARKET
10.9 COMPETITIVE BENCHMARKING
TABLE 237 MARKET: DETAILED LIST OF KEY PLAYERS
10.10 COMPETITIVE SCENARIO
10.10.1 MARKET EVALUATION FRAMEWORK
TABLE 238 STRATEGIES ADOPTED
TABLE 239 NUMBER OF GROWTH STRATEGIES ADOPTED BY KEY COMPANIES
10.10.2 MARKET EVALUATION MATRIX
TABLE 240 COMPANY INDUSTRY FOOTPRINT
TABLE 241 COMPANY REGION FOOTPRINT
10.11 STRATEGIC DEVELOPMENTS
10.11.1 DEALS
TABLE 242 DEALS, 2018–2022
10.11.2 OTHER DEVELOPMENTS
TABLE 243 OTHERS, 2019–2022
11 COMPANY PROFILES (Page No. - 214)
(Business overview, Products/Solutions/Services offered, Recent Developments, MNM view)*
11.1 KEY COMPANIES
11.1.1 PPG INDUSTRIES
TABLE 244 PPG INDUSTRIES: BUSINESS OVERVIEW
FIGURE 54 PPG INDUSTRIES: COMPANY SNAPSHOT
11.1.2 SHERWIN-WILLIAMS COMPANY
TABLE 245 SHERWIN WILLIAMS COMPANY: BUSINESS OVERVIEW
FIGURE 55 SHERWIN-WILLIAMS COMPANY: COMPANY SNAPSHOT
11.1.3 AKZONOBEL N.V.
TABLE 246 AKZONOBEL N.V.: BUSINESS OVERVIEW
FIGURE 56 AKZONOBEL N.V.: COMPANY SNAPSHOT
11.1.4 AXALTA COATING SYSTEMS LLC
TABLE 247 AXALTA COATING SYSTEMS LLC: BUSINESS OVERVIEW
FIGURE 57 AXALTA COATING SYSTEMS LLC: COMPANY SNAPSHOT
11.1.5 JOTUN A/S
TABLE 248 JOTUN A/S: BUSINESS OVERVIEW
FIGURE 58 JOTUN A/S: COMPANY SNAPSHOT
11.1.6 TEKNOS GROUP
TABLE 249 TEKNOS GROUP: BUSINESS OVERVIEW
FIGURE 59 TEKNOS GROUP: COMPANY SNAPSHOT
11.1.7 CIN INDUSTRIAL COATINGS
TABLE 250 CIN INDUSTRIAL COATINGS: BUSINESS OVERVIEW
11.1.8 ALLNEX
TABLE 251 ALLNEX: BUSINESS OVERVIEW
FIGURE 60 ALLNEX: COMPANY SNAPSHOT
11.2 OTHER KEY PLAYERS
11.2.1 TIGER COATINGS GMBH & CO. KG
TABLE 252 TIGER COATINGS GMBH & CO. KG
11.2.2 ARSONSISI TECHNOLOGICAL COATINGS
TABLE 253 ARSONSISI TECHNOLOGICAL COATINGS
11.2.3 PLATINUM PHASE SDN BHD
TABLE 254 PLATINUM PHASE SDN BHD
11.2.4 TULIP PAINTS
TABLE 255 TULIP PAINTS
11.2.5 PROTECH-OXYPLAST GROUP
TABLE 256 PROTECH-OXYPLAST GROUP
11.2.6 KEYLAND POLYMER MATERIALS SCIENCES
TABLE 257 KEYLAND POLYMER MATERIALS SCIENCES
11.2.7 IGP PULVERTECHNIK AG
TABLE 258 IGP PULVERTECHNIK AG
11.2.8 ANHUI MEIJIA NEW MATERIAL CO., LTD
TABLE 259 ANHUI MEIJIA NEW MATERIAL CO., LTD
11.2.9 EMIL FREI GMBH & CO. KG
TABLE 260 EMIL FREI GMBH & CO. KG
11.2.10 IFS COATINGS
TABLE 261 IFS COATINGS
11.2.11 PRIMATEK COATINGS OÜ
TABLE 262 PRIMATEK COATINGS OÜ
11.2.12 RAPID ENGINEERING CO. PVT. LTD.
TABLE 263 RAPID ENGINEERING CO. PVT. LTD.
11.2.13 MODERN SAK FACTORY FOR POWDER PAINT
TABLE 264 MODERN SAK FACTORY FOR POWDER PAINTS
*Details on Business overview, Products/Solutions/Services offered, Recent Developments, MNM view might not be captured in case of unlisted companies.
12 ADJACENT/RELATED MARKETS (Page No. - 257)
12.1 INTRODUCTION
12.2 LIMITATIONS
12.3 PAINTS & COATINGS ECOSYSTEM
12.4 POWDER COATING MARKET
12.4.1 MARKET DEFINITION
12.4.2 MARKET OVERVIEW
12.4.3 POWDER COATING MARKET, BY RESIN TYPE
TABLE 265 POWDER COATINGS MARKET, BY RESIN TYPE, 2016–2019 (KILOTON)
TABLE 266 POWDER COATINGS MARKET, BY RESIN TYPE, 2020–2025 (KILOTON)
TABLE 267 POWDER COATINGS MARKET, BY RESIN TYPE, 2016–2019 (USD MILLION)
TABLE 268 POWDER COATINGS MARKET, BY RESIN TYPE, 2020–2025 (USD MILLION)
12.4.4 POWDER COATING MARKET, BY END-USE INDUSTRY
TABLE 269 POWDER COATINGS MARKET, BY END-USE INDUSTRY, 2016–2019 (KILOTON)
TABLE 270 POWDER COATINGS MARKET, BY END-USE INDUSTRY, 2020–2025(KILOTON)
TABLE 271 POWDER COATINGS MARKET, BY END-USE INDUSTRY, 2016–2019 (USD MILLION)
TABLE 272 POWDER COATINGS MARKET, BY END-USE INDUSTRY, 2020–2025 (USD MILLION)
12.4.5 POWDER COATING MARKET, BY REGION
TABLE 273 POWDER COATINGS MARKET, BY REGION, 2016–2019 (KILOTON)
TABLE 274 POWDER COATINGS MARKET, BY REGION, 2020–2025 (KILOTON)
TABLE 275 POWDER COATINGS MARKET, BY REGION, 2016–2019 (USD MILLION)
TABLE 276 POWDER COATINGS MARKET, BY REGION, 2020–2025 (USD MILLION)
13 APPENDIX (Page No. - 264)
13.1 DISCUSSION GUIDE
13.2 KNOWLEDGESTORE: MARKETSANDMARKETS’ SUBSCRIPTION PORTAL
13.3 CUSTOMIZATION OPTIONS
13.4 RELATED REPORTS
13.5 AUTHOR DETAILS
The study involved four major activities in estimating the current market size of low temperature powder coatings. Exhaustive secondary research was done to collect information on the market, the peer market, and the parent market. The next step was to validate these findings, assumptions, and sizing with industry experts across the value chain through primary research. Both top-down and bottom-up approaches were employed to estimate the complete market size. After that, the market breakdown and data triangulation methods were used to estimate the size of the segments and subsegments of the overall market.
Secondary Research
Secondary sources include annual reports of companies, press releases, investor presentations, white papers, articles by recognized authors, and databases, such as D&B, Bloomberg, Chemical Weekly, and Factiva; and publications and databases from associations, including the National Institute for Occupational Safety and Health (NIOSH), United States Environmental Protection Agency (USEPA), Society for Protective Coatings (SSPC), and European Inventory of Existing Commercial Chemical Substances (EINECS).
Primary Research
In the primary research process, experts from the supply and demand sides have been interviewed to obtain qualitative and quantitative information and validate the data for this report. Primary sources from the supply side include industry experts, such as chief executive officers (CEOs), vice presidents (VPs), marketing directors, technology and innovation directors, and related key executives from various key companies and organizations operating in the low temperature powder coatings market. Extensive primary research has been conducted to gather information and validate the market numbers arrived at. Primary research has also been conducted to identify market segmentation and industry trends.
Following is the breakdown of primary respondents:
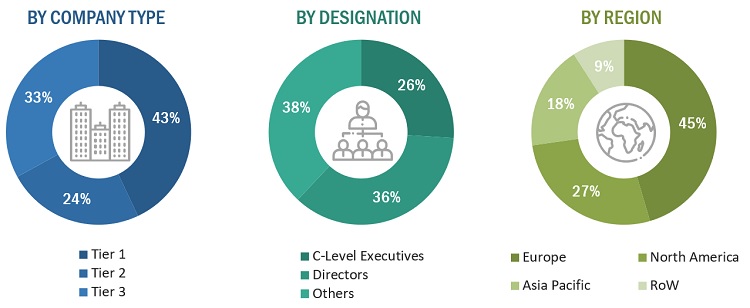
Notes: Companies are classified based on their revenue–Tier 1 = >USD 7 billion, Tier 2 = USD 500 million to USD 7 billion, and Tier 3 =
Others include sales, marketing, and product managers.
To know about the assumptions considered for the study, download the pdf brochure
Top-Down Approach
The top-down approach used to estimate the market size included the following steps:
- The market size was assessed from the supply side. First, from the secondary sources, the overall low temperature powder coatings market size was noted, and then, consumption across various end-use industries was ascertained. This helped quantify the overall low temperature powder coatings market in the global powder coatings market. The penetration of the market in different regions was determined through secondary research and interactions with industry experts.
- Ascertaining the share of various low temperature powder coating technologies in the overall low temperature powder coatings market led to quantifying the market size in terms of volume (kiloton).
Market Size Estimation: Top-Down Approach

Source: Annual Reports, Investor Presentations, Primary Interviews, Paints & Coatings Industry, Powder Coatings Institute, British Coatings Federation, Environmental Protection Agency, National Paint & Coatings Association (NPCA), American Coatings Association (ACA), Canadian Paint & Coatings Association (CPCA), World Paint & Coatings Industry Association (WPCIA), China National Coatings Industry Association (CNCIA), and MarketsandMarkets Analysis
To know about the assumptions considered for the study, Request for Free Sample Report
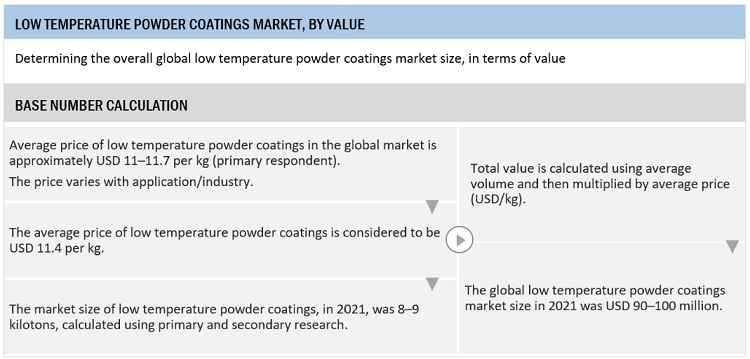
Market Size Estimation: Low Temperature Powder Coatings Market
Source: Annual Reports, Investor Presentations, Primary Interviews, Paints & Coatings Industry, Powder Coatings Institute, British Coatings Federation, Environmental Protection Agency, National Paint & Coatings Association (NPCA), American Coatings Association (ACA), Canadian Paint & Coatings Association (CPCA), World Paint & Coatings Industry Association (WPCIA), China National Coatings Industry Association (CNCIA), and MarketsandMarkets Analysis
Low Temperature Powder Coatings Market By Region
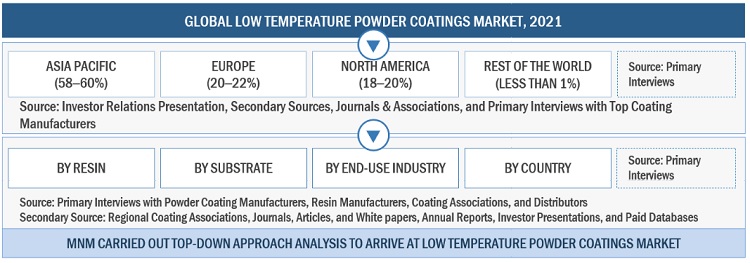
Source: Annual Reports, Investor Presentations, Primary Interviews, Paints & Coatings Industry, Powder Coatings Institute, British Coatings Federation, Environmental Protection Agency, National Paint & Coatings Association (NPCA), American Coatings Association (ACA), Canadian Paint & Coatings Association (CPCA), World Paint & Coatings Industry Association (WPCIA), China National Coatings Industry Association (CNCIA), and MarketsandMarkets Analysis
Low Temperature Powder Coatings Market By Resin

Source: Annual Reports, Investor Presentations, Primary Interviews, Paints & Coatings Industry, Powder Coatings Institute, British Coatings Federation, Environmental Protection Agency, National Paint & Coatings Association (NPCA), American Coatings Association (ACA), Canadian Paint & Coatings Association (CPCA), World Paint & Coatings Industry Association (WPCIA), China National Coatings Industry Association (CNCIA), and MarketsandMarkets Analysis
Bottom-Up Approach
The bottom-up approach has been used to arrive at the overall size of the low temperature powder coatings market from the revenues of the key market players in 2021. With the data triangulation procedure and validation of data through primary interviews, the exact values of the overall parent market size and individual market sizes have been determined and confirmed in this study. The bottom-up approach has been implemented to validate the sizes of the market segments in terms of value.
Market Size Estimation: Bottom-Up Approach By End–Use Industry
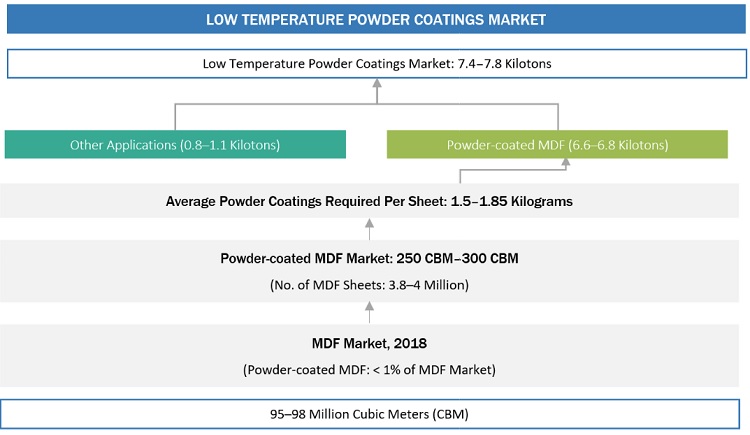
Source: Annual Reports, Investor Presentations, Primary Interviews, Paints & Coatings Industry, Powder Coatings Institute, British Coatings Federation, Environmental Protection Agency, National Paint & Coatings Association (NPCA), American Coatings Association (ACA), Canadian Paint & Coatings Association (CPCA), World Paint & Coatings Industry Association (WPCIA), China National Coatings Industry Association (CNCIA), and MarketsandMarkets Analysis
Market Forecast Approach
Demand-Side Forecast Projection
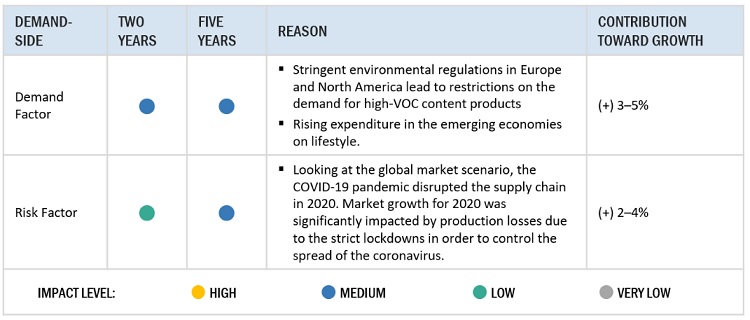
Source: MarketsandMarkets Analysis
Factor Analysis

Source: MarketsandMarkets Analysis
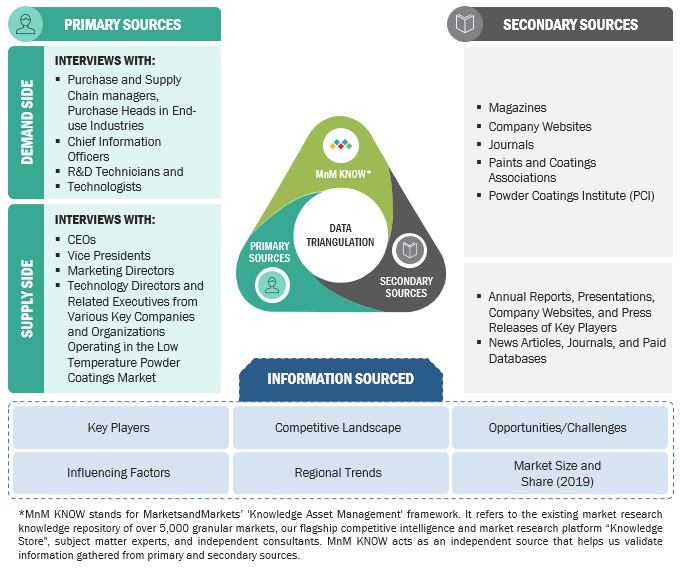
Data Triangulation
After arriving at the overall market size, the market has been split into several segments. To complete the overall market engineering process and arrive at the exact statistics for all segments, the data triangulation and market breakdown procedures have been employed, wherever applicable. The data has been triangulated by studying various factors and trends from the demand and supply sides. In addition, the market has been validated using both the top-down and bottom-up approaches.
Low Temperature Powder Coatings Market: Data Triangulation
Report Objectives
- To define, describe, and forecast the global low temperature powder coatings market in terms of value and volume
- To provide detailed information about the key factors (drivers, restraints, opportunities, and challenges) influencing the market growth
- To analyze and forecast the market by substrate, resin, end-use industry, and region.
- To forecast the market size with respect to five main regions: Asia Pacific (APAC), Europe, North America, and Rest of the World.
- To strategically analyze the micromarkets1 with respect to individual growth trends, prospects, and their contribution to the overall market
- To analyze the opportunities in the market for stakeholders and provide a competitive landscape for market leaders
- To analyze competitive developments in the market, such as investments & expansions, and mergers & acquisitions
- To strategically profile the key players and comprehensively analyze their market shares and core competencies
Available Customizations
MarketsandMarkets offers customizations according to the specific needs of the companies with the given market data.
The following customization options are available for the report:
Product Analysis
- Product matrix, which gives a detailed comparison of the product portfolio of each company
Regional Analysis
- A further breakdown of the low temperature powder coatings market, by country
Company Information
- Detailed analysis and profiling of additional market players (up to five)


 Generating Response ...


Growth opportunities and latent adjacency in Low Temperature Powder Coatings Market