Master Data Management Market by Component, Organization Size (SMEs & Large Enterprises), Deployment Mode (Cloud & On-premises), Vertical (BFSI & Healthcare), and Region (North America, Europe, APAC, MEA, Latin America) - Global Forecast to 2027


The global Master Data Management Market is projected to expand at a CAGR of 15.7% during the forecast period to reach USD 34.5 billion by 2027, size was valued USD 16.7 billion in 2022. Various factors such as Increase in the use of data quality tools for data management, and rising need for compliance are expected to drive the adoption of master data management solution and services.

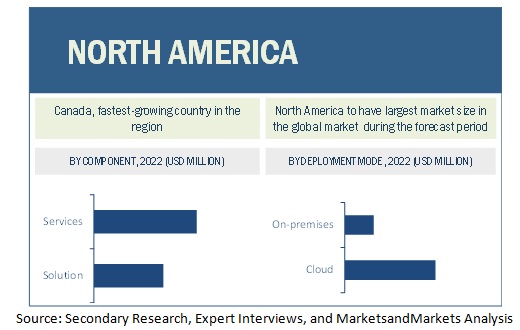
To know about the assumptions considered for the study, Request for Free Sample Report
COVID-19 Impact
The COVID-19 pandemic has affected every industry drastically, especially the IT industry; among which the hardware business remains the most affected. Due to the global country-wise lockdown, the industry faced a noticeable slowdown in manufacturing and supply of the hardware components. The software and service businesses had also shown a severe slowdown for a short period. However, the adoption of cloud-based technologies, collaborative applications, security solutions, big data, and AI helped the IT industry recover faster during and after the lockdown.
The pandemic has affected the master data management market also. Quarantine and other COVID related enforced measures slowed down the growth of the market. But once these restrictions were lifted, the market started to recover. To reduce the risk of a COVID-19-positive employee infecting the entire workforce, and placing businesses under quarantine again, organizations came up with smart quarantine solutions consulting to businesses. Hence, various master data management solution providers have launched the ‘work from home’ resource centers and incorporated work from home modules to their existing master data management systems, owing to the growing ‘work from home’ popularity. For instance, in response to COVID-19, NICE launched a free work-from-home module for its employees to help them cope up with the increased call volumes and minimize rising handle times while staying safe from getting infected.
Master Data Management Market Dynamics
Driver: Increasing use of data management tools
master data management solutions and services channel massive volumes of data generated across an enterprise to store data in a single location and guarantee data security. To improve operational excellence, the increased data churn necessitates sophisticated data quality technologies. Data quality is the first step toward implementing master data management, a powerful tool that allows businesses to trace the stages of information flow and document data transformation. Data quality technologies assure data accuracy, while master data management solutions automatically update records and clear superfluous data. This has allowed businesses to combine the adoption of master data management solutions and data quality technologies. For instance, maintaining data integrity is critical for businesses in the financial services industry. In 2017, Northern Europe and IT users regarded master data and data quality management as very important, according to BI-SURVEY.com. Data quality technologies aid in the reduction of data duplication, rework, and the maintenance of reliable data records. Data consolidation is becoming increasingly critical for firms who have realised the value of data quality. This factor is boosting the master data management market by creating a high demand for master data management solutions.
Restraint: Concerns regarding data security
Master data management software and services are evolving as the best way to structure and keep data in these times of rising data management and maintenance solutions. However, due to widespread user worries about data security, this market's expansion is limited. Organizations are currently operating in data-driven business environments, which raises the danger of advanced data breaches, cyber-attacks, and phishing attempts. Several issues arise as a result of data being spread across multiple systems, increasing the security risks to the data. Isolated data systems, on the other hand, are a constraint for many firms that face a significant risk of security breaches and distributed data. According to the Ponemon Institute LLC's sixth annual benchmark study on the privacy and security of healthcare data, healthcare firms are more vulnerable to data breaches than other industries. One of the main reasons for the slow adoption of master data management solutions is this. Users avoid these solutions because they are afraid of losing critical master and reference data if data mistakes occur during compilation or upgrade.
Opportunity: Incorporation of advanced technologies with master data management solutions
New technologies such as artificial intelligence (AI), big data, and machine learning (ML) are propelling the master data management market forward. This technology provides new technical capabilities for data storage and processing, as well as huge dataset availability. Customers have a broad range of requirements as new technologies' capabilities in managing multi-domain and multi-faceted data have improved. The most common request has been to integrate master data management solutions with technologies like as Big Data, analytics, and business intelligence. Duplicate records are identified and data quality is assured, which are common master data challenges. It also verifies records based on information outside the master data management application, such as transactional data, CAD data, and the history of transactions. The use of machine learning in master data management is growing, allowing fresh data to be considered while relying on previous data exchanges. Organizations can use machine learning to detect patterns in data, as well as propose linkages, correlations, and speedier data adaption from a source to a consumer. Enterprises can integrate the source for eCRM, personalization, social commerce, and offline activity with the help of these technologies, resulting in a single data source for all channels. Furthermore, innovative players such as Amazon, Google, and Facebook are using new technology to accelerate development. To avoid inflicting any damage to their brand, they're combining master data management with other modern technologies to give complete, consistent, and accurate information across all channels.
Challenge: Diversified data regulatory implications
Master data management solutions are gaining traction in a variety of industries and across different locations. This has resulted in a considerable barrier to market growth, namely the presence of diverse governmental rules and policies across national and international borders. For example, to protect data both within and outside Europe, the European Union General Data Protection Regulation (GDPR) is strictly followed. For vendors supplying services in different regions, the extent of this statute differs. Furthermore, master data standards varies among industries. Each business has its own set of data requirements, which makes it difficult for master data management solutions to satisfy the needs of the organisation. In comparison to other industries, pharmaceutical and biotech companies are expected to follow new product master data requirements. Pharmaceutical firms must adhere to ISO 11615, ISO 11616, ISO 11238, ISO 11239, and ISO 11240, which were produced by the International Organization for Standardization (ISO). As a result, the presence of governmental regulations poses the challenge of diversity and variation which significantly hinders the broad expansion of the master data management market.
The cloud segment to witness higher CAGR during forecast period
Based on deployment type, the master data management market is segmented into cloud and on-premises. Cloud-based deployment type enables businesses to operate without a server infrastructure or office location, thus allowing remote working. Organizations adopting cloud-based master data management solution since it is easy to deploy, offers agility, and provides more scalability than on-premises tools and software at a lesser cost. These factors are supporting the growth of the cloud-based master data management solutions.
The BFSI vertical to account for the largest market size during the forecast period
The segmentation of the master data management market by the industrial vertical includes BFSI, government, healthcare, retail, IT and telecom, manufacturing, energy & utilities, and others. Presently, the BFSI sector is the leading segment of the master data management market. A massive amount of financial data is generated regularly in this sector from transactions comprising sensitive and detailed financial & transactional data and information about customers. So, to keep these data secured and accurate, and for efficient management, financial institutions, such as banks, companies, and insurance agents use master data management solutions. These solutions help these financial institutions improve customer service and manage business risks.
North America to account for the largest market size during the forecast period
North America is expected to have the largest market share in the master data management market. Key factors favoring the growth of the master data management market in North America include the increasing technological advancements in the region. The growing number of master data management players across regions is expected to further drive market growth.
To know about the assumptions considered for the study, download the pdf brochure
Key Market Players
The major players in the master data management market include IBM (US), Oracle (US), SAP (Germany), SAS (US), TIBCO Software (US), Informatica (US), Talend (US), Cloudera (US), Riversand (US), Broadcom (US), Ataccama (Canada), Stibo Systems (Denmark) and Teradata (US). The key players have implemented various types of organic and inorganic growth strategies, such as new product launches, product upgradations, partnerships and agreements, business expansions, and mergers and acquisitions to strengthen their offerings in the market.
Report Highlights
|
Report Metrics |
Details |
|
Market size value in 2022 |
US $16.7 Billion |
|
Market size value in 2027 |
US $34.5 Billion |
|
Market Growth Rate |
15.7% CAGR |
|
Regional Scope |
North America |
|
Key Market Drivers |
|
|
Key Market Opportunities |
|
|
Segments covered |
Component, Deployment Type, Organization Size, Industry Vertical, and Region |
|
Geographies covered |
North America, Europe, Asia Pacific, Middle East & Africa, and Latin America |
|
Companies covered |
IBM (US), Oracle (US), SAP (Germany), SAS (US), TIBCO Software (US), Informatica (US), Talend (US), Cloudera (US), Riversand (US), Syn Force (US), Stibo Systems (Denmark), Profisee Group (US), Reltio (US), Semarchy (US), Broadcom (US), Ataccama (Canada) |
This research report categorizes the master data management market based on component, deployment mode, organization size, application, industry vertical, and region.
Market by Component:
- Solution
- Services
- Consulting Services
- Integration Services
- Training & Support Services
Market by Deployment Mode:
- Cloud
- On-premises
Market by Organization Size:
- SMEs
- Large Enterprises
Market by Verticals:
- BFSI
- Government
- Retail
- IT & Telecom
- Manufacturing
- Energy & Utilities
- Healthcare
- Other Verticals (education, aerospace & defense, travel & hospitality, transportation & logistics, and media & entertainment)
Market by Region:
-
North America
- US
- Canada
-
Europe
- UK
- Germany
- France
- Rest of Europe
-
APAC
- China
- Japan
- India
- Singapore
- Rest of APAC
-
MEA
- United Arab Emirates
- Qatar
- Kingdom of Saudi Arabia
- South Africa
- Rest of Middle East and Africa
-
Latin America
- Brazil
- Mexico
- Rest of Latin America
Recent Developments
- In March 2022, IBM updates it’s InfoSphere MDM Reference Data Management Hub, with the new update users can fine-tune the data they publish using the MDM Publisher function. Users can now filter down to the row level when establishing the data filter criteria that determines which data gets published. This feature can be used to slice master data finely based on the criteria users specify.
- In February 2022, Oracle updates it’s Oracle Enterprise Data Management, With the new update, validation errors can be downloaded to an MS Excel file. This enables EDM users to obtain assistance or feedback from others. The file contains specific information, such as the nodes, properties, relationships, and failure messages.
- In April 2022, Broadcom updates it’s CA IDMS, the new update comes with DML modification statements that update the database's record occurrences. Users can remove a record from the database's database and can make a link between a member record and a set.
Frequently Asked Questions (FAQ):
How big is the Master data management market?
What is growth rate of the Master data management market?
Who are the key players in Master data management market?
Who will be the leading hub for Master data management market?
What is the Master data management market segmentation?
To speak to our analyst for a discussion on the above findings, click Speak to Analyst
TABLE OF CONTENTS
1 INTRODUCTION (Page No. - 46)
1.1 OBJECTIVES OF STUDY
1.2 MARKET DEFINITION
1.2.1 INCLUSIONS AND EXCLUSIONS
1.3 MARKET SCOPE
1.3.1 MARKET SEGMENTATION
1.3.2 YEARS CONSIDERED FOR STUDY
1.4 CURRENCY CONSIDERED
1.5 STAKEHOLDERS
1.6 SUMMARY OF CHANGES
2 RESEARCH METHODOLOGY (Page No. - 50)
2.1 RESEARCH DATA
FIGURE 1 GLOBAL MASTER DATA MANAGEMENT MARKET: RESEARCH DESIGN
2.1.1 SECONDARY DATA
2.1.2 PRIMARY DATA
2.1.2.1 Breakup of primary profiles
2.1.2.2 Key industry insights
2.2 MARKET BREAKUP AND DATA TRIANGULATION
2.3 MARKET SIZE ESTIMATION
FIGURE 2 MARKET SIZE ESTIMATION METHODOLOGY-APPROACH 1 (SUPPLY SIDE): REVENUE OF SOLUTION/SERVICES OF MARKET
FIGURE 3 MARKET SIZE ESTIMATION METHODOLOGY ? APPROACH 2 BOTTOM-UP (SUPPLY SIDE): COLLECTIVE REVENUE OF ALL SOLUTION/SERVICES OF MARKET
FIGURE 4 MARKET SIZE ESTIMATION METHODOLOGY ? APPROACH 3 TOP-DOWN (DEMAND SIDE): SHARE OF MASTER DATA MANAGEMENT THROUGH OVERALL MASTER DATA MANAGEMENT SPENDING
FIGURE 5 MASTER DATA MANAGEMENT MARKET: TOP-DOWN AND BOTTOM-UP APPROACHES
2.3.1 TOP-DOWN APPROACH
2.3.2 BOTTOM-UP APPROACH
2.4 MARKET FORECAST
TABLE 1 FACTOR ANALYSIS
2.5 ASSUMPTIONS FOR STUDY
2.6 LIMITATIONS OF STUDY
3 EXECUTIVE SUMMARY (Page No. - 60)
TABLE 2 MASTER DATA MANAGEMENT MARKET SIZE AND GROWTH RATE, 2016–2021 (USD MILLION, Y-O-Y %)
TABLE 3 MARKET SIZE AND GROWTH RATE, 2022–2027 (USD MILLION, Y-O-Y %)
FIGURE 6 SOLUTION SEGMENT TO HOLD LARGER MARKET SIZE IN 2022
FIGURE 7 LARGE ENTERPRISES SEGMENT TO HOLD LARGER MARKET SIZE IN 2022
FIGURE 8 ON-PREMISES DEPLOYMENT TYPE TO HOLD LARGER MARKET SIZE IN 2022
FIGURE 9 HEALTHCARE VERTICAL TO HOLD HIGHEST CAGR DURING FORECAST PERIOD
FIGURE 10 NORTH AMERICA TO HOLD LARGEST MARKET SHARE, AND ASIA PACIFIC TO HOLD HIGHEST CAGR IN MARKET IN 2022
4 PREMIUM INSIGHTS (Page No. - 64)
4.1 ATTRACTIVE OPPORTUNITIES IN MASTER DATA MANAGEMENT MARKET
FIGURE 11 RISING NEED FOR COMPLIANCE TO DRIVE MARKET GROWTH DURING FORECAST PERIOD
4.2 MARKET, BY VERTICAL
FIGURE 12 BANKING, FINANCIAL SERVICES, AND INSURANCE SEGMENT TO REGISTER LARGEST MARKET SHARE DURING FORECAST PERIOD
4.3 MARKET, BY REGION
FIGURE 13 NORTH AMERICA TO REGISTER LARGEST MARKET SHARE DURING FORECAST PERIOD
4.4 GEMENT MARKET: COMPONENTS AND TOP THREE VERTICALS
FIGURE 14 SOLUTION SEGMENT AND BANKING, FINANCIAL SERVICES, & INSURANCE VERTICAL TO HOLD HIGHEST MARKET SHARES IN 2022
5 MARKET OVERVIEW AND INDUSTRY TRENDS (Page No. - 66)
5.1 INTRODUCTION
5.2 MARKET DYNAMICS
FIGURE 15 DRIVERS, RESTRAINTS, OPPORTUNITIES, AND CHALLENGES: MASTER DATA MANAGEMENT MARKET
5.2.1 DRIVERS
5.2.1.1 Increase in the use of data quality tools for data management
5.2.1.2 Rising need for compliance
5.2.2 RESTRAINTS
5.2.2.1 Data security concerns
5.2.3 OPPORTUNITIES
5.2.3.1 Incorporation of new technologies with master data management
5.2.3.2 Trend towards multi-domain master data management
5.2.4 CHALLENGES
5.2.4.1 Diversified data regulations and legislation across different verticals and regions
5.2.4.2 Network slowdown due to COVID-19 pandemic to impact the master data management market significantly
5.2.5 CUMULATIVE GROWTH ANALYSIS
5.3 MASTER DATA MANAGEMENT: EVOLUTION
FIGURE 16 EVOLUTION OF MASTER DATA MANAGEMENT
5.4 CASE STUDIES
5.4.1 BANKING, FINANCIAL SERVICES, AND INSURANCE
5.4.1.1 Use Case 1: Raiffeisen Bank used Ataccama ONE to power its operations, prevent fraud, and facilitate regulatory compliance
5.4.2 INFORMATION TECHNOLOGY AND TELECOMMUNICATION
5.4.2.1 Use Case 2: Avast used Ataccama ONE to improve its customer experience and ensure compliance with data privacy
5.4.3 RETAIL AND CONSUMER GOODS
5.4.3.1 Use Case 3: 1-800-Flowers.com used IBM InfoSphere Master Data Management to assist customers find right gifts
5.4.4 GOVERNMENT AND DEFENSE
5.4.4.1 Use Case 4: CAK used TIBCO MDM to better interact with citizens of Holland and other governmental agencies
5.4.5 MANUFACTURING
5.4.5.1 Use Case 5: Goya Foods used TIBCO MDM to enhance quality of data on its products
5.4.6 HEALTHCARE
5.4.6.1 Use Case 6: Hackensack Meridian used Informatica MDM to manage complex soils of data
5.4.7 ENERGY AND UTILITIES
5.4.7.1 Use Case 7: Fjordkraft used Informatica Master Data Management to consolidate, deduplicate, and master customer data
5.5 TECHNOLOGY ANALYSIS
5.5.1 AI, ML, AND MASTER DATA MANAGEMENT
5.5.2 CLOUD COMPUTING AND MASTER DATA MANAGEMENT
5.5.3 BIG DATA & ANALYTICS AND MASTER DATA MANAGEMENT
5.6 PORTER’S FIVE FORCES ANALYSIS
TABLE 4 IMPACT OF EACH FORCE ON THE MASTER DATA MANAGEMENT MARKET
FIGURE 17 PORTER’S FIVE FORCES ANALYSIS: MARKET
5.6.1 THREAT FROM NEW ENTRANTS
5.6.2 THREAT FROM SUBSTITUTES
5.6.3 BARGAINING POWER OF SUPPLIERS
5.6.4 BARGAINING POWER OF BUYERS
5.6.5 INTENSITY OF COMPETITIVE RIVALRY
5.7 SUPPLY/VALUE CHAIN ANALYSIS
FIGURE 18 SUPPLY/VALUE CHAIN ANALYSIS
5.8 PATENT ANALYSIS
5.8.1 METHODOLOGY
5.8.2 DOCUMENT TYPE
TABLE 5 PATENTS FILED, 2020–2022
5.8.3 INNOVATION AND PATENT APPLICATIONS
FIGURE 19 ANNUAL NUMBER OF PATENTS GRANTED, 2019–2022
5.8.3.1 Top applicants
FIGURE 20 TOP TEN COMPANIES WITH HIGHEST NUMBER OF PATENT APPLICATIONS, 2020–2022
5.9 MDM ECOSYSTEM
TABLE 6 MDM MARKET: ECOSYSTEM
5.10 PRICING MODEL ANALYSIS
TABLE 7 PRICING MODEL
5.11 REGULATORY IMPLICATIONS
5.11.1 GENERAL DATA PROTECTION REGULATION
5.11.2 HEALTH INSURANCE PORTABILITY AND ACCOUNTABILITY ACT
5.11.3 PAYMENT CARD INDUSTRY DATA SECURITY STANDARD
5.11.4 SARBANES-OXLEY ACT OF 2002
5.11.5 SOC 2 TYPE II COMPLIANCE
5.11.6 ISO/IEC 27001
5.11.7 THE GRAMM–LEACH–BLILEY ACT
5.12 MDM MARKET: COVID-19 IMPACT
FIGURE 21 MASTER DATA MANAGEMENT MARKET TO DECLINE DURING 2022-2027
5.13 TARIFF AND REGULATORY LANDSCAPE
5.13.1 REGULATORY BODIES, GOVERNMENT AGENCIES, AND OTHER ORGANIZATIONS
TABLE 8 NORTH AMERICA: LIST OF REGULATORY BODIES, GOVERNMENT AGENCIES, AND OTHER ORGANIZATIONS
TABLE 9 EUROPE: LIST OF REGULATORY BODIES, GOVERNMENT AGENCIES, AND OTHER ORGANIZATIONS
TABLE 10 ASIA PACIFIC: LIST OF REGULATORY BODIES, GOVERNMENT AGENCIES, AND OTHER ORGANIZATIONS
TABLE 11 MIDDLE EAST & AFRICA: LIST OF REGULATORY BODIES, GOVERNMENT AGENCIES, AND OTHER ORGANIZATIONS
TABLE 12 LATIN AMERICA: LIST OF REGULATORY BODIES, GOVERNMENT AGENCIES, AND OTHER ORGANIZATIONS
5.13.2 NORTH AMERICA: TARIFFS AND REGULATIONS
5.13.2.1 Personal Information Protection and Electronic Documents Act (PIPEDA)
5.13.2.2 Gramm-Leach-Bliley (GLB) Act
5.13.2.3 HIPAA of 1996
5.13.2.4 Federal Information Security Management Act (FISMA)
5.13.2.5 Federal Information Processing Standards (FIPS)
5.13.2.6 California Consumer Privacy Act (CSPA)
5.13.3 EUROPE: TARIFFS AND REGULATIONS
5.13.3.1 GDPR 2016/679 is a regulation in the EU
5.13.3.2 General Data Protection Regulation
5.13.3.3 European Committee for Standardization (CEN)
5.13.3.4 European Technical Standards Institute (ETSI)
6 MASTER DATA MANAGEMENT MARKET, BY COMPONENT (Page No. - 91)
6.1 INTRODUCTION
6.1.1 COMPONENT: MARKET DRIVERS
6.1.2 COMPONENTS: COVID-19 IMPACT
FIGURE 22 SERVICES SEGMENT TO GROW AT HIGHER CAGR DURING FORECAST PERIOD
TABLE 13 MARKET, BY COMPONENT, 2016–2021 (USD MILLION)
TABLE 14 MARKET, BY COMPONENT, 2022–2027 (USD MILLION)
6.2 SOLUTION
TABLE 15 SOLUTION: MARKET, BY REGION, 2016–2021 (USD MILLION)
TABLE 16 SOLUTION: MARKET, BY REGION, 2022–2027 (USD MILLION)
TABLE 17 SOLUTION: NORTH AMERICA MARKET, BY COUNTRY, 2016–2021 (USD MILLION)
TABLE 18 SOLUTION: NORTH AMERICA MARKET, BY COUNTRY, 2022–2027 (USD MILLION)
TABLE 19 SOLUTION: EUROPE MASTER DATA MANAGEMENT MARKET, BY COUNTRY, 2016–2021 (USD MILLION)
TABLE 20 SOLUTION: EUROPE MARKET, BY COUNTRY, 2022–2027 (USD MILLION)
TABLE 21 SOLUTION: ASIA PACIFIC MARKET, BY COUNTRY, 2016–2021 (USD MILLION)
TABLE 22 SOLUTION: ASIA PACIFIC MARKET, BY COUNTRY, 2022–2027 (USD MILLION)
TABLE 23 SOLUTION: MIDDLE EAST & AFRICA MARKET, BY COUNTRY, 2016–2021 (USD MILLION)
TABLE 24 SOLUTION: MIDDLE EAST & AFRICA MARKET, BY COUNTRY, 2022–2027 (USD MILLION)
TABLE 25 SOLUTION: LATIN AMERICA MARKET, BY COUNTRY, 2016–2021 (USD MILLION)
TABLE 26 SOLUTION: LATIN AMERICA MARKET, BY COUNTRY, 2022–2027 (USD MILLION)
6.3 SERVICES
TABLE 27 SERVICES: MASTER DATA MANAGEMENT MARKET, BY REGION, 2016–2021 (USD MILLION)
TABLE 28 SERVICES: MARKET, BY REGION, 2022–2027 (USD MILLION)
TABLE 29 SERVICES: NORTH AMERICA MARKET, BY COUNTRY, 2016–2021 (USD MILLION)
TABLE 30 SERVICES: NORTH AMERICA MARKET, BY COUNTRY, 2022–2027 (USD MILLION)
TABLE 31 SERVICES: EUROPE MARKET, BY COUNTRY, 2016–2021 (USD MILLION)
TABLE 32 SERVICES: EUROPE MARKET, BY COUNTRY, 2022–2027 (USD MILLION)
TABLE 33 SERVICES: ASIA PACIFIC MARKET, BY COUNTRY, 2016–2021 (USD MILLION)
TABLE 34 SERVICES: ASIA PACIFIC MARKET, BY COUNTRY, 2022–2027 (USD MILLION)
TABLE 35 SERVICES: MIDDLE EAST & AFRICA MARKET, BY COUNTRY, 2016–2021 (USD MILLION)
TABLE 36 SERVICES: MIDDLE EAST & AFRICA MARKET, BY COUNTRY, 2022–2027 (USD MILLION)
TABLE 37 SERVICES: LATIN AMERICA MARKET, BY COUNTRY, 2016–2021 (USD MILLION)
TABLE 38 SERVICES: LATIN AMERICA MASTER DATA MANAGEMENT MARKET, BY COUNTRY, 2022–2027 (USD MILLION)
6.3.1 CONSULTING SERVICES
6.3.2 INTEGRATION SERVICES
6.3.3 TRAINING AND SUPPORT SERVICES
7 MASTER DATA MANAGEMENT MARKET, BY DEPLOYMENT TYPE (Page No. - 103)
7.1 INTRODUCTION
7.1.1 DEPLOYMENT TYPE: MARKET DRIVERS
7.1.2 DEPLOYMENT TYPE: COVID-19 IMPACT
FIGURE 23 CLOUD SEGMENT TO WITNESS HIGHER CAGR DURING FORECAST PERIOD
TABLE 39 MARKET, BY DEPLOYMENT MODE, 2016–2021 (USD MILLION)
TABLE 40 MARKET, BY DEPLOYMENT MODE, 2022–2027 (USD MILLION)
7.2 CLOUD
TABLE 41 CLOUD: MARKET, BY REGION, 2016–2021 (USD MILLION)
TABLE 42 CLOUD: MARKET, BY REGION, 2022–2027 (USD MILLION)
TABLE 43 CLOUD: NORTH AMERICA MARKET, BY COUNTRY, 2016–2021 (USD MILLION)
TABLE 44 CLOUD: NORTH AMERICA MARKET, BY COUNTRY, 2022–2027 (USD MILLION)
TABLE 45 CLOUD: EUROPE MARKET, BY COUNTRY, 2016–2021 (USD MILLION)
TABLE 46 CLOUD: EUROPE MARKET, BY COUNTRY, 2022–2027 (USD MILLION)
TABLE 47 CLOUD: ASIA PACIFIC MASTER DATA MANAGEMENT MARKET, BY COUNTRY, 2016–2021 (USD MILLION)
TABLE 48 CLOUD: ASIA PACIFIC MARKET, BY COUNTRY, 2022–2027 (USD MILLION)
TABLE 49 CLOUD: MIDDLE EAST & AFRICA MARKET, BY COUNTRY, 2016–2021 (USD MILLION)
TABLE 50 CLOUD: MIDDLE EAST & AFRICA MARKET, BY COUNTRY, 2022–2027 (USD MILLION)
TABLE 51 CLOUD: LATIN AMERICA MARKET, BY COUNTRY, 2016–2021 (USD MILLION)
TABLE 52 CLOUD: LATIN AMERICA MARKET, BY COUNTRY, 2022–2027 (USD MILLION)
7.3 ON-PREMISES
TABLE 53 ON-PREMISES: MARKET, BY REGION, 2016–2021 (USD MILLION)
TABLE 54 ON-PREMISES: MARKET, BY REGION, 2022–2027 (USD MILLION)
TABLE 55 ON-PREMISES: NORTH AMERICA MARKET, BY COUNTRY, 2016–2021 (USD MILLION)
TABLE 56 ON-PREMISES: NORTH AMERICA MARKET, BY COUNTRY, 2022–2027 (USD MILLION)
TABLE 57 ON-PREMISES: EUROPE MARKET, BY COUNTRY, 2016–2021 (USD MILLION)
TABLE 58 ON-PREMISES: EUROPE MASTER DATA MANAGEMENT MARKET, BY COUNTRY, 2022–2027 (USD MILLION)
TABLE 59 ON-PREMISES: ASIA PACIFIC MARKET, BY COUNTRY, 2016–2021 (USD MILLION)
TABLE 60 ON-PREMISES: ASIA PACIFIC MARKET, BY COUNTRY, 2022–2027 (USD MILLION)
TABLE 61 ON-PREMISES: MIDDLE EAST & AFRICA MARKET, BY COUNTRY, 2016–2021 (USD MILLION)
TABLE 62 ON-PREMISES: MIDDLE EAST & AFRICA MARKET, BY COUNTRY, 2022–2027 (USD MILLION)
TABLE 63 ON-PREMISES: LATIN AMERICA MARKET, BY COUNTRY, 2016–2021 (USD MILLION)
TABLE 64 ON-PREMISES: LATIN AMERICA MARKET, BY COUNTRY, 2022–2027 (USD MILLION)
8 MASTER DATA MANAGEMENT MARKET, BY ORGANIZATION SIZE (Page No. - 114)
8.1 INTRODUCTION
8.1.1 ORGANIZATION SIZE: MARKET DRIVERS
8.1.2 ORGANIZATION SIZE: COVID-19 IMPACT
FIGURE 24 SMALL AND MEDIUM-SIZED ENTERPRISES SEGMENT TO REGISTER HIGHER CAGR DURING FORECAST PERIOD
TABLE 65 MARKET, BY ORGANIZATION SIZE, 2016–2021 (USD MILLION)
TABLE 66 MARKET, BY ORGANIZATION SIZE, 2022–2027 (USD MILLION)
8.2 LARGE ENTERPRISES
TABLE 67 LARGE ENTERPRISES: MARKET, BY REGION, 2016–2021 (USD MILLION)
TABLE 68 LARGE ENTERPRISES: MARKET, BY REGION, 2022–2027 (USD MILLION)
TABLE 69 LARGE ENTERPRISES: NORTH AMERICA MARKET, BY COUNTRY, 2016–2021 (USD MILLION)
TABLE 70 LARGE ENTERPRISES: NORTH AMERICA MARKET, BY COUNTRY, 2022–2027 (USD MILLION)
TABLE 71 LARGE ENTERPRISES: EUROPE MASTER DATA MANAGEMENT MARKET, BY COUNTRY, 2016–2021 (USD MILLION)
TABLE 72 LARGE ENTERPRISES: EUROPE MARKET, BY COUNTRY, 2022–2027 (USD MILLION)
TABLE 73 LARGE ENTERPRISES: ASIA PACIFIC MARKET, BY COUNTRY, 2016–2021 (USD MILLION)
TABLE 74 LARGE ENTERPRISES: ASIA PACIFIC MARKET, BY COUNTRY, 2022–2027 (USD MILLION)
TABLE 75 LARGE ENTERPRISES: MIDDLE EAST & AFRICA MARKET, BY COUNTRY, 2016–2021 (USD MILLION)
TABLE 76 LARGE ENTERPRISES: MIDDLE EAST & AFRICA MARKET, BY COUNTRY, 2022–2027 (USD MILLION)
TABLE 77 LARGE ENTERPRISES: LATIN AMERICA MARKET, BY COUNTRY, 2016–2021 (USD MILLION)
TABLE 78 LARGE ENTERPRISES: LATIN AMERICA MARKET, BY COUNTRY, 2022–2027 (USD MILLION)
8.3 SMALL AND MEDIUM-SIZED ENTERPRISES
TABLE 79 SMALL AND MEDIUM-SIZED ENTERPRISES: MARKET, BY REGION, 2016–2021 (USD MILLION)
TABLE 80 SMALL AND MEDIUM-SIZED ENTERPRISES: MASTER DATA MANAGEMENT MARKET, BY REGION, 2022–2027 (USD MILLION)
TABLE 81 SMALL AND MEDIUM-SIZED ENTERPRISES: NORTH AMERICA MARKET, BY COUNTRY, 2016–2021 (USD MILLION)
TABLE 82 SMALL AND MEDIUM-SIZED ENTERPRISES: NORTH AMERICA MARKET, BY COUNTRY, 2022–2027 (USD MILLION)
TABLE 83 SMALL AND MEDIUM-SIZED ENTERPRISES: EUROPE MARKET, BY COUNTRY, 2016–2021 (USD MILLION)
TABLE 84 SMALL AND MEDIUM-SIZED ENTERPRISES: EUROPE MARKET, BY COUNTRY, 2022–2027 (USD MILLION)
TABLE 85 SMALL AND MEDIUM-SIZED ENTERPRISES: ASIA PACIFIC MARKET, BY COUNTRY, 2016–2021 (USD MILLION)
TABLE 86 SMALL AND MEDIUM-SIZED ENTERPRISES: ASIA PACIFIC MARKET, BY COUNTRY, 2022–2027 (USD MILLION)
TABLE 87 SMALL AND MEDIUM-SIZED ENTERPRISES: MIDDLE EAST & AFRICA MASTER DATA MANAGEMENT MARKET, BY COUNTRY, 2016–2021 (USD MILLION)
TABLE 88 SMALL AND MEDIUM-SIZED ENTERPRISES: MIDDLE EAST & AFRICA MMARKET, BY COUNTRY, 2022–2027 (USD MILLION)
TABLE 89 SMALL AND MEDIUM-SIZED ENTERPRISES: LATIN AMERICA MARKET, BY COUNTRY, 2016–2021 (USD MILLION)
TABLE 90 SMALL AND MEDIUM-SIZED ENTERPRISES: LATIN AMERICA MARKET, BY COUNTRY, 2022–2027 (USD MILLION)
9 MASTER DATA MANAGEMENT MARKET, BY VERTICAL (Page No. - 125)
9.1 INTRODUCTION
9.1.1 VERTICAL: COVID-19 IMPACT
9.1.2 VERTICAL: MARKET DRIVERS
FIGURE 25 HEALTHCARE VERTICAL TO WITNESS HIGHEST CAGR DURING FORECAST PERIOD
TABLE 91 MARKET, BY VERTICAL, 2016–2021 (USD MILLION)
TABLE 92 MARKET, BY VERTICAL, 2022–2027 (USD MILLION)
9.2 BANKING, FINANCIAL SERVICES, & INSURANCE
TABLE 93 BANKING, FINANCIAL SERVICES, & INSURANCE: MARKET, BY REGION, 2016–2021 (USD MILLION)
TABLE 94 BANKING, FINANCIAL SERVICES, & INSURANCE: MARKET, BY REGION, 2022–2027 (USD MILLION)
9.3 GOVERNMENT
TABLE 95 GOVERNMENT: MARKET, BY REGION, 2016–2021 (USD MILLION)
TABLE 96 GOVERNMENT: MARKET, BY REGION, 2022–2027 (USD MILLION)
9.4 RETAIL
TABLE 97 RETAIL: MASTER DATA MANAGEMENT MARKET, BY REGION, 2016–2021 (USD MILLION)
TABLE 98 RETAIL: MARKET, BY REGION, 2022–2027 (USD MILLION)
9.5 IT & TELECOM
TABLE 99 IT & TELECOM: MARKET, BY REGION, 2016–2021 (USD MILLION)
TABLE 100 IT & TELECOM: MARKET, BY REGION, 2022–2027 (USD MILLION)
9.6 MANUFACTURING
TABLE 101 MANUFACTURING: MARKET, BY REGION, 2016–2021 (USD MILLION)
TABLE 102 MANUFACTURING: MARKET, BY REGION, 2022–2027 (USD MILLION)
9.7 ENERGY & UTILITIES
TABLE 103 ENERGY & UTILITIES: MARKET, BY REGION, 2016–2021 (USD MILLION)
TABLE 104 ENERGY & UTILITIES: MARKET, BY REGION, 2022–2027 (USD MILLION)
9.8 HEALTHCARE
TABLE 105 HEALTHCARE: MASTER DATA MANAGEMENT MARKET, BY REGION, 2016–2021 (USD MILLION)
TABLE 106 HEALTHCARE: MARKET, BY REGION, 2022–2027 (USD MILLION)
9.9 OTHER VERTICALS
TABLE 107 OTHER VERTICALS: MARKET, BY REGION, 2016–2021 (USD MILLION)
TABLE 108 OTHER VERTICALS: MARKET, BY REGION, 2022–2027 (USD MILLION)
10 MASTER DATA MANAGEMENT MARKET, BY REGION (Page No. - 137)
10.1 INTRODUCTION
10.1.1 REGION: COVID-19 EFFECT
FIGURE 26 NORTH AMERICA TO LEAD MARKET DURING FORECAST PERIOD
FIGURE 27 INDIA TO GROW AT HIGHEST CAGR DURING FORECAST PERIOD
TABLE 109 MARKET, BY REGION, 2016–2021 (USD MILLION)
TABLE 110 MARKET, BY REGION, 2022–2027 (USD MILLION)
10.2 NORTH AMERICA
10.2.1 NORTH AMERICA: MARKET DRIVERS
FIGURE 28 NORTH AMERICA: MARKET SNAPSHOT
TABLE 111 NORTH AMERICA: MASTER DATA MANAGEMENT MARKET, BY COMPONENT, 2016–2021 (USD MILLION)
TABLE 112 NORTH AMERICA: MARKET, BY COMPONENT, 2022–2027 (USD MILLION)
TABLE 113 NORTH AMERICA: MARKET, BY DEPLOYMENT TYPE, 2016–2021 (USD MILLION)
TABLE 114 NORTH AMERICA: MARKET, BY DEPLOYMENT TYPE, 2022–2027 (USD MILLION)
TABLE 115 NORTH AMERICA: MARKET, BY ORGANIZATION SIZE, 2016–2021 (USD MILLION)
TABLE 116 NORTH AMERICA: MARKET, BY ORGANIZATION SIZE, 2022–2027 (USD MILLION)
TABLE 117 NORTH AMERICA: MARKET, BY VERTICAL, 2016–2021 (USD MILLION)
TABLE 118 NORTH AMERICA: MARKET, BY VERTICAL, 2022–2027 (USD MILLION)
TABLE 119 NORTH AMERICA: MARKET, BY COUNTRY, 2016–2021 (USD MILLION)
TABLE 120 NORTH AMERICA: MARKET, BY COUNTRY, 2022–2027 (USD MILLION)
10.2.2 UNITED STATES
TABLE 121 UNITED STATES: MASTER DATA MANAGEMENT MARKET, BY COMPONENT, 2016–2021 (USD MILLION)
TABLE 122 UNITED STATES: MARKET, BY COMPONENT, 2022–2027 (USD MILLION)
TABLE 123 UNITED STATES: MARKET, BY DEPLOYMENT TYPE, 2016–2021 (USD MILLION)
TABLE 124 UNITED STATES: MARKET, BY DEPLOYMENT TYPE, 2022–2027 (USD MILLION)
TABLE 125 UNITED STATES: MARKET, BY ORGANIZATION SIZE, 2016–2021 (USD MILLION)
TABLE 126 UNITED STATES: MARKET, BY ORGANIZATION SIZE, 2022–2027 (USD MILLION)
10.2.3 CANADA
TABLE 127 CANADA: MASTER DATA MANAGEMENT MARKET, BY COMPONENT, 2016–2021 (USD MILLION)
TABLE 128 CANADA: MARKET, BY COMPONENT, 2022–2027 (USD MILLION)
TABLE 129 CANADA: MARKET, BY DEPLOYMENT TYPE, 2016–2021 (USD MILLION)
TABLE 130 CANADA: MARKET, BY DEPLOYMENT TYPE, 2022–2027 (USD MILLION)
TABLE 131 CANADA: MARKET, BY ORGANIZATION SIZE, 2016–2021 (USD MILLION)
TABLE 132 CANADA: MARKET, BY ORGANIZATION SIZE, 2022–2027 (USD MILLION)
10.3 EUROPE
10.3.1 EUROPE: MARKET DRIVERS
TABLE 133 EUROPE: MASTER DATA MANAGEMENT MARKET, BY COMPONENT, 2016–2021 (USD MILLION)
TABLE 134 EUROPE: MARKET, BY COMPONENT, 2022–2027 (USD MILLION)
TABLE 135 EUROPE: MARKET, BY ORGANIZATION SIZE, 2016–2021 (USD MILLION)
TABLE 136 EUROPE: MARKET, BY ORGANIZATION SIZE, 2022–2027 (USD MILLION)
TABLE 137 EUROPE: MARKET, BY DEPLOYMENT TYPE, 2016–2021 (USD MILLION)
TABLE 138 EUROPE: MARKET, BY DEPLOYMENT TYPE, 2022–2027 (USD MILLION)
TABLE 139 EUROPE: MARKET, BY VERTICAL, 2016–2021 (USD MILLION)
TABLE 140 EUROPE: MARKET, BY VERTICAL, 2022–2027 (USD MILLION)
TABLE 141 EUROPE: MARKET, BY COUNTRY, 2016–2021 (USD MILLION)
TABLE 142 EUROPE: MARKET, BY COUNTRY, 2022–2027 (USD MILLION)
10.3.2 UNITED KINGDOM
TABLE 143 UNITED KINGDOM: MASTER DATA MANAGEMENT MARKET, BY COMPONENT, 2016–2021 (USD MILLION)
TABLE 144 UNITED KINGDOM: MARKET, BY COMPONENT, 2022–2027 (USD MILLION)
TABLE 145 UNITED KINGDOM: MARKET, BY DEPLOYMENT TYPE, 2016–2021 (USD MILLION)
TABLE 146 UNITED KINGDOM: MARKET, BY DEPLOYMENT TYPE, 2022–2027 (USD MILLION)
TABLE 147 UNITED KINGDOM: MARKET, BY ORGANIZATION SIZE, 2016–2021 (USD MILLION)
TABLE 148 UNITED KINGDOM: MARKET, BY ORGANIZATION SIZE, 2022–2027 (USD MILLION)
10.3.3 GERMANY
TABLE 149 GERMANY: MASTER DATA MANAGEMENT MARKET, BY COMPONENT, 2016–2021 (USD MILLION)
TABLE 150 GERMANY: MARKET, BY COMPONENT, 2022–2027 (USD MILLION)
TABLE 151 GERMANY: MARKET, BY DEPLOYMENT TYPE, 2016–2021 (USD MILLION)
TABLE 152 GERMANY: MARKET, BY DEPLOYMENT TYPE, 2022–2027 (USD MILLION)
TABLE 153 GERMANY: MARKET, BY ORGANIZATION SIZE, 2016–2021 (USD MILLION)
TABLE 154 GERMANY: MARKET, BY ORGANIZATION SIZE, 2022–2027 (USD MILLION)
10.3.4 FRANCE
TABLE 155 FRANCE: MASTER DATA MANAGEMENT MARKET, BY COMPONENT, 2016–2021 (USD MILLION)
TABLE 156 FRANCE: MARKET, BY COMPONENT, 2022–2027 (USD MILLION)
TABLE 157 FRANCE: MARKET, BY DEPLOYMENT TYPE, 2016–2021 (USD MILLION)
TABLE 158 FRANCE: MARKET, BY DEPLOYMENT TYPE, 2022–2027 (USD MILLION)
TABLE 159 FRANCE: MARKET, BY ORGANIZATION SIZE, 2016–2021 (USD MILLION)
TABLE 160 FRANCE: MARKET, BY ORGANIZATION SIZE, 2022–2027 (USD MILLION)
10.3.5 REST OF EUROPE
TABLE 161 REST OF EUROPE: MASTER DATA MANAGEMENT MARKET, BY COMPONENT, 2016–2021 (USD MILLION)
TABLE 162 REST OF EUROPE: MARKET, BY COMPONENT, 2022–2027 (USD MILLION)
TABLE 163 REST OF EUROPE: MARKET, BY DEPLOYMENT TYPE, 2016–2021 (USD MILLION)
TABLE 164 REST OF EUROPE: MARKET, BY DEPLOYMENT TYPE, 2022–2027 (USD MILLION)
TABLE 165 REST OF EUROPE: MARKET, BY ORGANIZATION SIZE, 2016–2021 (USD MILLION)
TABLE 166 REST OF EUROPE: MARKET, BY ORGANIZATION SIZE, 2022–2027 (USD MILLION)
10.4 ASIA PACIFIC
10.4.1 ASIA PACIFIC: MASTER DATA MANAGEMENT MARKET DRIVERS
FIGURE 29 ASIA PACIFIC: MARKET SNAPSHOT
TABLE 167 ASIA PACIFIC: MARKET, BY COMPONENT, 2016–2021 (USD MILLION)
TABLE 168 ASIA PACIFIC: MARKET, BY COMPONENT, 2022–2027 (USD MILLION)
TABLE 169 ASIA PACIFIC: MARKET, BY ORGANIZATION SIZE, 2016–2021 (USD MILLION)
TABLE 170 ASIA PACIFIC: MARKET, BY ORGANIZATION SIZE, 2022–2027 (USD MILLION)
TABLE 171 ASIA PACIFIC: MARKET, BY DEPLOYMENT TYPE, 2016–2021 (USD MILLION)
TABLE 172 ASIA PACIFIC: MARKET, BY DEPLOYMENT TYPE, 2022–2027 (USD MILLION)
TABLE 173 ASIA PACIFIC: MARKET, BY VERTICAL, 2016–2021 (USD MILLION)
TABLE 174 ASIA PACIFIC: MARKET, BY VERTICAL, 2022–2027 (USD MILLION)
TABLE 175 ASIA PACIFIC: MARKET, BY COUNTRY, 2016–2021 (USD MILLION)
TABLE 176 ASIA PACIFIC: MARKET, BY COUNTRY, 2022–2027 (USD MILLION)
10.4.2 CHINA
TABLE 177 CHINA: MASTER DATA MANAGEMENT MARKET, BY COMPONENT, 2016–2021 (USD MILLION)
TABLE 178 CHINA: MARKET, BY COMPONENT, 2022–2027 (USD MILLION)
TABLE 179 CHINA: MARKET, BY DEPLOYMENT TYPE, 2016–2021 (USD MILLION)
TABLE 180 CHINA: MARKET, BY DEPLOYMENT TYPE, 2022–2027 (USD MILLION)
TABLE 181 CHINA: MARKET, BY ORGANIZATION SIZE, 2016–2021 (USD MILLION)
TABLE 182 CHINA: MARKET, BY ORGANIZATION SIZE, 2022–2027 (USD MILLION)
10.4.3 INDIA
TABLE 183 INDIA: MASTER DATA MANAGEMENT MARKET, BY COMPONENT, 2016–2021 (USD MILLION)
TABLE 184 INDIA: MARKET, BY COMPONENT, 2022–2027 (USD MILLION)
TABLE 185 INDIA: MARKET, BY DEPLOYMENT TYPE, 2016–2021 (USD MILLION)
TABLE 186 INDIA: MARKET, BY DEPLOYMENT TYPE, 2022–2027 (USD MILLION)
TABLE 187 INDIA: MARKET, BY ORGANIZATION SIZE, 2016–2021 (USD MILLION)
TABLE 188 INDIA: MARKET, BY ORGANIZATION SIZE, 2022–2027 (USD MILLION)
10.4.4 SINGAPORE
TABLE 189 SINGAPORE: MASTER DATA MANAGEMENT MARKET, BY COMPONENT, 2016–2021 (USD MILLION)
TABLE 190 SINGAPORE: MARKET, BY COMPONENT, 2022–2027 (USD MILLION)
TABLE 191 SINGAPORE: MARKET, BY DEPLOYMENT TYPE, 2016–2021 (USD MILLION)
TABLE 192 SINGAPORE: MARKET, BY DEPLOYMENT TYPE, 2022–2027 (USD MILLION)
TABLE 193 SINGAPORE: MARKET, BY ORGANIZATION SIZE, 2016–2021 (USD MILLION)
TABLE 194 SINGAPORE: MARKET, BY ORGANIZATION SIZE, 2022–2027 (USD MILLION)
10.4.5 JAPAN
TABLE 195 JAPAN: MASTER DATA MANAGEMENT MARKET, BY COMPONENT, 2016–2021 (USD MILLION)
TABLE 196 JAPAN: MARKET, BY COMPONENT, 2022–2027 (USD MILLION)
TABLE 197 JAPAN: MARKET, BY DEPLOYMENT TYPE, 2016–2021 (USD MILLION)
TABLE 198 JAPAN: MARKET, BY DEPLOYMENT TYPE, 2022–2027 (USD MILLION)
TABLE 199 JAPAN: MARKET, BY ORGANIZATION SIZE, 2016–2021 (USD MILLION)
TABLE 200 JAPAN: MARKET, BY ORGANIZATION SIZE, 2022–2027 (USD MILLION)
10.4.6 REST OF ASIA PACIFIC
TABLE 201 REST OF ASIA PACIFIC: MASTER DATA MANAGEMENT MARKET, BY COMPONENT, 2016–2021 (USD MILLION)
TABLE 202 REST OF ASIA PACIFIC: MARKET, BY COMPONENT, 2022–2027 (USD MILLION)
TABLE 203 REST OF ASIA PACIFIC: MARKET, BY DEPLOYMENT TYPE, 2016–2021 (USD MILLION)
TABLE 204 REST OF ASIA PACIFIC: MARKET, BY DEPLOYMENT TYPE, 2022–2027 (USD MILLION)
TABLE 205 REST OF ASIA PACIFIC: MARKET, BY ORGANIZATION SIZE, 2016–2021 (USD MILLION)
TABLE 206 REST OF ASIA PACIFIC: MARKET, BY ORGANIZATION SIZE, 2022–2027 (USD MILLION)
10.5 MIDDLE EAST & AFRICA
10.5.1 MIDDLE EAST & AFRICA: MASTER DATA MANAGEMENT MARKET DRIVERS
TABLE 207 MIDDLE EAST & AFRICA: MARKET, BY COMPONENT, 2016–2021 (USD MILLION)
TABLE 208 MIDDLE EAST & AFRICA: MARKET, BY COMPONENT, 2022–2027 (USD MILLION)
TABLE 209 MIDDLE EAST & AFRICA: MARKET, BY ORGANIZATION SIZE, 2016–2021 (USD MILLION)
TABLE 210 MIDDLE EAST & AFRICA: MARKET, BY ORGANIZATION SIZE, 2022–2027 (USD MILLION)
TABLE 211 MIDDLE EAST & AFRICA: MARKET, BY DEPLOYMENT TYPE, 2016–2021 (USD MILLION)
TABLE 212 MIDDLE EAST & AFRICA: MARKET, BY DEPLOYMENT TYPE, 2022–2027 (USD MILLION)
TABLE 213 MIDDLE EAST & AFRICA: MARKET, BY VERTICAL, 2016–2021 (USD MILLION)
TABLE 214 MIDDLE EAST & AFRICA: MARKET, BY VERTICAL, 2022–2027 (USD MILLION)
TABLE 215 MIDDLE EAST & AFRICA: MARKET, BY COUNTRY, 2016–2021 (USD MILLION)
TABLE 216 MIDDLE EAST & AFRICA: MARKET, BY COUNTRY, 2022–2027 (USD MILLION)
10.5.2 KINGDOM OF SAUDI ARABIA
TABLE 217 KINGDOM OF SAUDI ARABIA: MASTER DATA MANAGEMENT MARKET, BY COMPONENT, 2016–2021 (USD MILLION)
TABLE 218 KINGDOM OF SAUDI ARABIA: MARKET, BY COMPONENT, 2022–2027 (USD MILLION)
TABLE 219 KINGDOM OF SAUDI ARABIA: MARKET, BY DEPLOYMENT TYPE, 2016–2021 (USD MILLION)
TABLE 220 KINGDOM OF SAUDI ARABIA: MARKET, BY DEPLOYMENT TYPE, 2022–2027 (USD MILLION)
TABLE 221 KINGDOM OF SAUDI ARABIA: MARKET, BY ORGANIZATION SIZE, 2016–2021 (USD MILLION)
TABLE 222 KINGDOM OF SAUDI ARABIA: MARKET, BY ORGANIZATION SIZE, 2022–2027 (USD MILLION)
10.5.3 UNITED ARAB EMIRATES
TABLE 223 UNITED ARAB EMIRATES: MASTER DATA MANAGEMENT MARKET, BY COMPONENT, 2016–2021 (USD MILLION)
TABLE 224 UNITED ARAB EMIRATES: MARKET, BY COMPONENT, 2022–2027 (USD MILLION)
TABLE 225 UNITED ARAB EMIRATES: MARKET, BY DEPLOYMENT TYPE, 2016–2021 (USD MILLION)
TABLE 226 UNITED ARAB EMIRATES: MARKET, BY DEPLOYMENT TYPE, 2022–2027 (USD MILLION)
TABLE 227 UNITED ARAB EMIRATES: MARKET, BY ORGANIZATION SIZE, 2016–2021 (USD MILLION)
TABLE 228 UNITED ARAB EMIRATES: MARKET, BY ORGANIZATION SIZE, 2022–2027 (USD MILLION)
10.5.4 QATAR
TABLE 229 QATAR: MASTER DATA MANAGEMENT MARKET, BY COMPONENT, 2016–2021 (USD MILLION)
TABLE 230 QATAR: MARKET, BY COMPONENT, 2022–2027 (USD MILLION)
TABLE 231 QATAR: MARKET, BY DEPLOYMENT TYPE, 2016–2021 (USD MILLION)
TABLE 232 QATAR: MARKET, BY DEPLOYMENT TYPE, 2022–2027 (USD MILLION)
TABLE 233 QATAR: MARKET, BY ORGANIZATION SIZE, 2016–2021 (USD MILLION)
TABLE 234 QATAR: MARKET, BY ORGANIZATION SIZE, 2022–2027 (USD MILLION)
10.5.5 SOUTH AFRICA
TABLE 235 SOUTH AFRICA: MASTER DATA MANAGEMENT MARKET, BY COMPONENT, 2016–2021 (USD MILLION)
TABLE 236 SOUTH AFRICA: MARKET, BY COMPONENT, 2022–2027 (USD MILLION)
TABLE 237 SOUTH AFRICA: MARKET, BY DEPLOYMENT TYPE, 2016–2021 (USD MILLION)
TABLE 238 SOUTH AFRICA: MARKET, BY DEPLOYMENT TYPE, 2022–2027 (USD MILLION)
TABLE 239 SOUTH AFRICA: MARKET, BY ORGANIZATION SIZE, 2016–2021 (USD MILLION)
TABLE 240 SOUTH AFRICA: MARKET, BY ORGANIZATION SIZE, 2022–2027 (USD MILLION)
10.5.6 REST OF MIDDLE EAST & AFRICA
TABLE 241 REST OF MIDDLE EAST & AFRICA: MASTER DATA MANAGEMENT MARKET, BY COMPONENT, 2016–2021 (USD MILLION)
TABLE 242 REST OF MIDDLE EAST & AFRICA: MARKET, BY COMPONENT, 2022–2027 (USD MILLION)
TABLE 243 REST OF MIDDLE EAST & AFRICA: MARKET, BY DEPLOYMENT TYPE, 2016–2021 (USD MILLION)
TABLE 244 REST OF MIDDLE EAST & AFRICA: MARKET, BY DEPLOYMENT TYPE, 2022–2027 (USD MILLION)
TABLE 245 REST OF MIDDLE EAST & AFRICA: MARKET, BY ORGANIZATION SIZE, 2016–2021 (USD MILLION)
TABLE 246 REST OF MIDDLE EAST & AFRICA: MARKET, BY ORGANIZATION SIZE, 2022–2027 (USD MILLION)
10.6 LATIN AMERICA
10.6.1 LATIN AMERICA: MASTER DATA MANAGEMENT MARKET DRIVERS
TABLE 247 LATIN AMERICA: MARKET, BY COMPONENT, 2016–2021 (USD MILLION)
TABLE 248 LATIN AMERICA: MARKET, BY COMPONENT, 2022–2027 (USD MILLION)
TABLE 249 LATIN AMERICA: MARKET, BY ORGANIZATION SIZE, 2016–2021 (USD MILLION)
TABLE 250 LATIN AMERICA: MARKET, BY ORGANIZATION SIZE, 2022–2027 (USD MILLION)
TABLE 251 LATIN AMERICA: MARKET, BY DEPLOYMENT TYPE, 2016–2021 (USD MILLION)
TABLE 252 LATIN AMERICA: MARKET, BY DEPLOYMENT TYPE, 2022–2027 (USD MILLION)
TABLE 253 LATIN AMERICA: MARKET, BY VERTICAL, 2016–2021 (USD MILLION)
TABLE 254 LATIN AMERICA: MARKET, BY VERTICAL, 2022–2027 (USD MILLION)
TABLE 255 LATIN AMERICA: MARKET, BY COUNTRY, 2016–2021 (USD MILLION)
TABLE 256 LATIN AMERICA: MARKET, BY COUNTRY, 2022–2027 (USD MILLION)
10.6.2 BRAZIL
TABLE 257 BRAZIL: MASTER DATA MANAGEMENT MARKET, BY COMPONENT, 2016–2021 (USD MILLION)
TABLE 258 BRAZIL: MARKET, BY COMPONENT, 2022–2027 (USD MILLION)
TABLE 259 BRAZIL: MARKET, BY DEPLOYMENT TYPE, 2016–2021 (USD MILLION)
TABLE 260 BRAZIL: MARKET, BY DEPLOYMENT TYPE, 2022–2027 (USD MILLION)
TABLE 261 BRAZIL: MARKET, BY ORGANIZATION SIZE, 2016–2021 (USD MILLION)
TABLE 262 BRAZIL: MARKET, BY ORGANIZATION SIZE, 2022–2027 (USD MILLION)
10.6.3 MEXICO
TABLE 263 MEXICO: MASTER DATA MANAGEMENT MARKET, BY COMPONENT, 2016–2021 (USD MILLION)
TABLE 264 MEXICO: MARKET, BY COMPONENT, 2022–2027 (USD MILLION)
TABLE 265 MEXICO: MARKET, BY DEPLOYMENT TYPE, 2016–2021 (USD MILLION)
TABLE 266 MEXICO: MARKET, BY DEPLOYMENT TYPE, 2022–2027 (USD MILLION)
TABLE 267 MEXICO: MARKET, BY ORGANIZATION SIZE, 2016–2021 (USD MILLION)
TABLE 268 MEXICO: MARKET, BY ORGANIZATION SIZE, 2022–2027 (USD MILLION)
10.6.4 REST OF LATIN AMERICA
TABLE 269 REST OF LATIN AMERICA: MASTER DATA MANAGEMENT MARKET, BY COMPONENT, 2016–2021 (USD MILLION)
TABLE 270 REST OF LATIN AMERICA: MARKET, BY COMPONENT, 2022–2027 (USD MILLION)
TABLE 271 REST OF LATIN AMERICA: MARKET, BY DEPLOYMENT TYPE, 2016–2021 (USD MILLION)
TABLE 272 REST OF LATIN AMERICA: MARKET, BY DEPLOYMENT TYPE, 2022–2027 (USD MILLION)
TABLE 273 REST OF LATIN AMERICA: MARKET, BY ORGANIZATION SIZE, 2016–2021 (USD MILLION)
TABLE 274 REST OF LATIN AMERICA: MARKET, BY ORGANIZATION SIZE, 2022–2027 (USD MILLION)
11 COMPETITIVE LANDSCAPE (Page No. - 192)
11.1 OVERVIEW
11.2 KEY PLAYER STRATEGIES
TABLE 275 OVERVIEW OF STRATEGIES DEPLOYED BY KEY PLAYERS IN MDM MARKET
11.3 REVENUE ANALYSIS
FIGURE 30 REVENUE ANALYSIS FOR KEY COMPANIES IN PAST FIVE YEARS
11.4 MARKET SHARE ANALYSIS
FIGURE 31 MDM MARKET SHARE ANALYSIS
TABLE 276 MASTER DATA MANAGEMENT MARKET: DEGREE OF COMPETITION
11.5 COMPANY EVALUATION QUADRANT
11.5.1 STARS
11.5.2 EMERGING LEADERS
11.5.3 PERVASIVE PLAYERS
11.5.4 PARTICIPANTS
FIGURE 32 KEY MARKET PLAYERS, COMPANY EVALUATION MATRIX, 2022
TABLE 277 COMPANY COMPONENT FOOTPRINT
TABLE 278 COMPANY REGION FOOTPRINT
11.6 STARTUP/SME EVALUATION QUADRANT
11.6.1 PROGRESSIVE COMPANIES
11.6.2 RESPONSIVE COMPANIES
11.6.3 DYNAMIC COMPANIES
11.6.4 STARTING BLOCKS
FIGURE 33 STARTUP/SMES: MASTER DATA MANAGEMENT MARKET EVALUATION MATRIX, 2022
11.7 COMPETITIVE SCENARIO
11.7.1 PRODUCT LAUNCHES
TABLE 279 PRODUCT LAUNCHES, SEPTEMBER 2019–MARCH 2022
11.7.2 DEALS
TABLE 280 DEALS, APRIL 2020-APRIL 2022
12 COMPANY PROFILES (Page No. - 203)
12.1 INTRODUCTION
12.2 KEY PLAYERS
(Business overview, Products/solution/services offered, Recent Developments, COVID-19-related developments, MnM view, Key strengths/Right to win, Strategic choices made, and Weaknesses and competitive threats)*
12.2.1 IBM
TABLE 281 IBM: BUSINESS OVERVIEW
FIGURE 34 IBM: COMPANY SNAPSHOT
TABLE 282 IBM: PRODUCTS OFFERED
TABLE 283 IBM: SERVICES OFFERED
TABLE 284 IBM: PRODUCT LAUNCHES AND ENHANCEMENTS
TABLE 285 IBM: DEALS
12.2.2 ORACLE
TABLE 286 ORACLE: BUSINESS OVERVIEW
FIGURE 35 ORACLE: COMPANY SNAPSHOT
TABLE 287 ORACLE: PRODUCTS OFFERED
TABLE 288 ORACLE: SERVICES OFFERED
TABLE 289 ORACLE: PRODUCT LAUNCHES AND ENHANCEMENTS
TABLE 290 ORACLE: DEALS
12.2.3 BROADCOM
TABLE 291 BROADCOM: BUSINESS OVERVIEW
FIGURE 36 BROADCOM: COMPANY SNAPSHOT
TABLE 292 BROADCOM: PRODUCTS OFFERED
TABLE 293 BROADCOM: SERVICES OFFERED
TABLE 294 BROADCOM: PRODUCT LAUNCHES AND ENHANCEMENTS
TABLE 295 BROADCOM: DEALS
12.2.4 SAP
TABLE 296 SAP: BUSINESS OVERVIEW
FIGURE 37 SAP: COMPANY SNAPSHOT
TABLE 297 SAP: PRODUCTS OFFERED
TABLE 298 SAP: SERVICES OFFERED
TABLE 299 SAP: PRODUCT LAUNCHES AND ENHANCEMENTS
TABLE 300 SAP: DEALS
12.2.5 SAS INSTITUTE
TABLE 301 SAS INSTITUTE: BUSINESS OVERVIEW
FIGURE 38 SAS INSTITUTE: FINANCIAL OVERVIEW
TABLE 302 SAS INSTITUTE: PRODUCTS/SOLUTION/SERVICES OFFERED
TABLE 303 SAS INSTITUTE: PRODUCT LAUNCHES AND ENHANCEMENTS
TABLE 304 SAS INSTITUTE: DEALS
12.2.6 TERADATA
TABLE 305 TERADATA: BUSINESS OVERVIEW
FIGURE 39 TERADATA: COMPANY SNAPSHOT
TABLE 306 TERADATA: PRODUCTS/SOLUTION/SERVICES OFFERED
TABLE 307 TERADATA: PRODUCT LAUNCHES AND ENHANCEMENTS
TABLE 308 TERADATA: DEALS
12.2.7 CLOUDERA
TABLE 309 CLOUDERA: BUSINESS OVERVIEW
FIGURE 40 CLOUDERA: COMPANY SNAPSHOT
TABLE 310 CLOUDERA: PRODUCTS/SOLUTION/SERVICES OFFERED
TABLE 311 CLOUDERA: PRODUCT LAUNCHES AND ENHANCEMENTS
TABLE 312 CLOUDERA: DEALS
12.2.8 TALEND
TABLE 313 TALEND: BUSINESS OVERVIEW
TABLE 314 TALEND: PRODUCTS/SOLUTION/SERVICES OFFERED
TABLE 315 TALEND: PRODUCT LAUNCHES AND ENHANCEMENTS
TABLE 316 TALEND: DEALS
12.2.9 RIVERSAND
TABLE 317 RIVERSAND: BUSINESS OVERVIEW
TABLE 318 RIVERSAND: PRODUCTS/SOLUTION/SERVICES OFFERED
TABLE 319 RIVERSAND: PRODUCT LAUNCHES AND ENHANCEMENTS
TABLE 320 RIVERSAND: DEALS
12.2.10 INFORMATICA
TABLE 321 INFORMATICA: BUSINESS OVERVIEW
TABLE 322 INFORMATICA: PRODUCTS OFFERED
TABLE 323 INFORMATICA: SERVICES OFFERED
TABLE 324 INFORMATICA: PRODUCT LAUNCHES AND ENHANCEMENTS
TABLE 325 INFORMATICA: DEALS
12.2.11 STIBO SYSTEMS
TABLE 326 STIBO SYSTEMS: BUSINESS OVERVIEW
TABLE 327 STIBO SYSTEMS: PRODUCTS OFFERED
TABLE 328 STIBO SYSTEMS: SERVICES OFFERED
TABLE 329 STIBO SYSTEMS: PRODUCT LAUNCHES AND ENHANCEMENTS
TABLE 330 STIBO SYSTEMS: DEALS
12.2.12 ATACCAMA
TABLE 331 ATACCAMA: BUSINESS OVERVIEW
TABLE 332 ATACCAMA: PRODUCTS OFFERED
TABLE 333 ATACCAMA: SERVICES OFFERED
TABLE 334 ATACCAMA: PRODUCT LAUNCHES AND ENHANCEMENTS
TABLE 335 ATACCAMA: DEALS
12.2.13 TIBCO SOFTWARE
TABLE 336 TIBCO SOFTWARE: BUSINESS OVERVIEW
TABLE 337 TIBCO SOFTWARE: PRODUCTS OFFERED
TABLE 338 TIBCO SOFTWARE: SERVICES OFFERED
TABLE 339 TIBCO SOFTWARE: PRODUCT LAUNCHES AND ENHANCEMENTS
TABLE 340 TIBCO: DEALS
12.3 OTHER KEY PLAYERS
12.3.1 PROFISEE GROUP
12.3.2 ACTIAN
12.3.3 MINDTREE
12.3.4 AWS
12.3.5 CONTENTSERV
12.3.6 WINSHUTTLE
12.3.7 MICRO FOCUS
12.3.8 VEEVA
12.3.9 SALESFORCE
12.3.10 HPE
12.4 STARTUP/ SMES
12.4.1 RELTIO
12.4.2 SEMARCHY
12.4.3 MAGNITUDE SOFTWARE
12.4.4 SYNCFORCE
12.4.5 QLIK
12.4.6 GOLDENSOURCE
12.4.7 ZALONI
*Details on Business overview, Products/solution/services offered, Recent Developments, COVID-19-related developments, MnM view, Key strengths/Right to win, Strategic choices made, and Weaknesses and competitive threats might not be captured in case of unlisted companies.
13 APPENDIX (Page No. - 271)
13.1 ADJACENT AND RELATED MARKETS
13.1.1 ENTERPRISE CONTENT MANAGEMENT MARKET
13.1.1.1 Market definition
13.1.1.2 Market overview
13.1.1.3 Enterprise Content Management Market, by Business Function
TABLE 341 ENTERPRISE CONTENT MANAGEMENT MARKET SIZE, BY BUSINESS FUNCTION, 2016–2020 (USD MILLION)
TABLE 342 ENTERPRISE CONTENT MANAGEMENT MARKET SIZE, BY BUSINESS FUNCTION, 2021–2026 (USD MILLION)
13.1.1.4 Enterprise Content Management Market, by Component
TABLE 343 ENTERPRISE CONTENT MANAGEMENT MARKET SIZE, BY COMPONENT, 2016–2020 (USD MILLION)
TABLE 344 ENTERPRISE CONTENT MANAGEMENT MARKET SIZE, BY COMPONENT, 2021–2026 (USD MILLION)
13.1.1.5 Enterprise Content Management Market, by Organization Size
TABLE 345 ENTERPRISE CONTENT MANAGEMENT MARKET SIZE, BY ORGANIZATION SIZE, 2016–2020 (USD MILLION)
TABLE 346 ENTERPRISE CONTENT MANAGEMENT MARKET SIZE, BY ORGANIZATION SIZE, 2021–2026 (USD MILLION)
13.1.1.6 Enterprise Content Management Market, by Deployment Type
TABLE 347 ENTERPRISE CONTENT MANAGEMENT MARKET SIZE, BY DEPLOYMENT TYPE, 2016–2020 (USD MILLION)
TABLE 348 ENTERPRISE CONTENT MANAGEMENT MARKET SIZE, BY DEPLOYMENT TYPE, 2021–2026 (USD MILLION)
13.1.1.7 Enterprise Content Management Market, by Vertical
TABLE 349 ENTERPRISE CONTENT MANAGEMENT MARKET SIZE, BY VERTICAL, 2016–2020 (USD MILLION)
TABLE 350 ENTERPRISE CONTENT MANAGEMENT MARKET SIZE, BY VERTICAL, 2021–2026 (USD MILLION)
13.1.1.8 Enterprise Content Management Market, by Region
TABLE 351 ENTERPRISE CONTENT MANAGEMENT MARKET SIZE, BY REGION, 2016–2020 (USD MILLION)
TABLE 352 ENTERPRISE CONTENT MANAGEMENT MARKET SIZE, BY REGION, 2021–2026 (USD MILLION)
13.1.2 METADATA MANAGEMENT TOOLS MARKET
13.1.2.1 Market definition
13.1.2.2 Market overview
13.1.2.3 Metadata Management Tools Market, by Application
TABLE 353 METADATA MANAGEMENT TOOLS MARKET SIZE, BY APPLICATION, 2015–2020 (USD MILLION)
TABLE 354 METADATA MANAGEMENT TOOLS MARKET SIZE, BY APPLICATION, 2021–2026 (USD MILLION)
13.1.2.4 Metadata Management Tools Market, by Business Function
TABLE 355 METADATA MANAGEMENT TOOLS MARKET SIZE, BY BUSINESS FUNCTION, 2015–2020 (USD MILLION)
TABLE 356 METADATA MANAGEMENT TOOLS MARKET SIZE, BY BUSINESS FUNCTION, 2021–2026 (USD MILLION)
13.1.2.5 Metadata Management Tools Market, by Organization Size
TABLE 357 METADATA MANAGEMENT TOOLS MARKET SIZE, BY ORGANIZATION SIZE, 2015–2020 (USD MILLION)
TABLE 358 METADATA MANAGEMENT TOOLS MARKET SIZE, BY ORGANIZATION SIZE, 2021–2026 (USD MILLION)
13.1.2.6 Metadata Management Tools Market, by Vertical
TABLE 359 METADATA MANAGEMENT TOOLS MARKET SIZE, BY VERTICAL, 2015–2020 (USD MILLION)
TABLE 360 METADATA MANAGEMENT TOOLS MARKET SIZE, BY VERTICAL, 2021–2026 (USD MILLION)
13.1.2.7 Metadata Management Tools Market, by Component
TABLE 361 METADATA MANAGEMENT TOOLS MARKET SIZE, BY COMPONENT, 2015–2020 (USD MILLION)
TABLE 362 METADATA MANAGEMENT TOOLS MARKET SIZE, BY COMPONENT, 2021–2026 (USD MILLION)
13.1.2.8 Metadata Management Tools Market, by Metadata Type
TABLE 363 METADATA MANAGEMENT TOOLS MARKET SIZE, BY METADATA TYPE, 2015–2020 (USD MILLION)
TABLE 364 METADATA MANAGEMENT TOOLS MARKET SIZE, BY METADATA TYPE, 2021–2026 (USD MILLION)
13.1.2.9 Metadata Management Tools Market, by Deployment Mode
TABLE 365 METADATA MANAGEMENT TOOLS MARKET SIZE, BY DEPLOYMENT MODE, 2015–2020 (USD MILLION)
TABLE 366 METADATA MANAGEMENT TOOLS MARKET SIZE, BY DEPLOYMENT MODE, 2021–2026 (USD MILLION)
13.1.2.10 Metadata Management Tools Market, by Region
TABLE 367 METADATA MANAGEMENT MARKET SIZE, BY REGION, 2015–2020 (USD MILLION)
TABLE 368 METADATA MANAGEMENT MARKET SIZE, BY REGION, 2021–2026 (USD MILLION)
13.2 DISCUSSION GUIDE
13.3 KNOWLEDGE STORE: MARKETSANDMARKETS’ SUBSCRIPTION PORTAL
13.4 AVAILABLE CUSTOMIZATIONS
13.5 RELATED REPORTS
13.6 AUTHOR DETAILS
This research study involved the extensive use of secondary sources, directories, and databases such as Dun & Bradstreet (D&B) Hoovers, and Bloomberg BusinessWeek to identify and collect information useful for a technical, market-oriented, and commercial study of the master data management market. The primary sources were mainly industry experts from the core and related industries and preferred suppliers, manufacturers, distributors, service providers, technology developers, alliances, and organizations related to all segments of the value chain of this market. In-depth interviews were conducted with various primary respondents that included key industry participants, subject matter experts, C-level executives of key market players, and industry consultants to obtain and verify critical qualitative and quantitative information. The following illustrative figure shows the market research methodology applied in making this report on the market.
Secondary Research
The market for companies offering master data management solutions and services for different verticals was estimated and projected based on the secondary data made available through paid and unpaid sources and by analyzing their product portfolios in the ecosystem of the market. It also involved rating products of companies based on their performance and quality. In the secondary research process, various sources were referred to for identifying and collecting information for this study on the master data management market. The secondary sources included annual reports, press releases and investor presentations of companies, white papers, journals, and certified publications and articles by recognized authors, directories, and databases.
Secondary research was mainly used to obtain key information about the supply chain of the market, the total pool of key players, market classification, and segmentation according to industry trends to the bottommost level, regional markets, and key developments from both, market and technology-oriented perspectives that were further validated by primary sources.
Primary Research
In the primary research process, various sources from both, the supply and demand sides were interviewed to obtain qualitative and quantitative information for this report. The primary sources from the supply side included industry experts such as Chief Executive Officers (CEOs), Chief Technology Officers (CTOs), Chief Operating Officers (COOs), Vice Presidents (VPs), Managing Directors (MDs), technology and innovation directors, and related key executives from different key companies and organizations operating in the master data management market.
The following is the breakup of primary profiles:

To know about the assumptions considered for the study, download the pdf brochure
Master Data Management Market Size Estimation
In this approach for market estimation, the key master data management solutions and services vendors, such as IBM (US), Oracle (US), SAP (Germany), SAS (US), TIBCO Software (US), Informatica (US), Talend (US), Cloudera (US), Riversand (US), Syn Force (US), Stibo Systems (Denmark), Profisee Group (US), Reltio (US), Semarchy (US), Cloudera (US), Broadcom (US), Ataccama (Canada), AWS (US), Teradata (US), Mindtree (US), Magnitude Software (US), Contentserv (Switzerland ), Veeva (US), Qlik (US), HPE (US), GoldenSource (US), Salesforce (US), Micro Focus (UK), Zaloni (US), Winshuttle (US), and Actian (Indonesia) contribute almost 60-65% to the global master data management market. After confirming these companies through primary interviews with industry experts, their total revenue through annual reports, Securities and Exchange Commission (SEC) filings, and paid databases was estimated. These companies’ revenue pertaining to the Business Units (BUs) that offer master data management solutions was identified through similar sources. Then through primaries, the data of revenue generated was collected through specific master data management solutions. The collective revenue of key companies that offer master data management solutions comprises 60%–65% of the market, which was again confirmed through primary interviews with industry experts. With the assumption that the rest of the market is contributed by smaller players (part of the unorganized market), the market size of organized players (55%–60%) and unorganized players (40%–45%) collectively was assumed to be the market size of the global master data management market for Financial Year (FY) 2022.
- The pricing trend is assumed to vary over time.
- All the forecasts are made with the standard assumption that the accepted currency is USD.
- For the conversion of various currencies to USD, average historical exchange rates are used according to the year specified. For all the historical and current exchange rates required for calculations and currency conversions, the US Internal Revenue Service's website is used.
- All the forecasts are made under the standard assumption that the globally accepted currency USD remains constant during the next five years.
- Vendor-side analysis: The market size estimates of associated solutions and services are factored in from the vendor side by assuming an average of licensing and subscription-based models of leading and innovative vendors in the market.
Demand/end-user analysis: End users operating in verticals across regions are analyzed in terms of market spending on master data management solutions based on some of the key use cases. These factors for the master data management industry per region are separately analyzed, and the average spending was extrapolated with an approximation based on assumed weightage. This factor is derived by averaging various market influencers, including recent developments, regulations, mergers and acquisitions, enterprise/SME adoption, startup ecosystem, IT spending, technology propensity and maturity, use cases, and the estimated number of organizations per region.
Data Triangulation
After arriving at the overall market size using the market size estimation processes as explained above, the market was split into several segments and subsegments. To complete the overall market engineering process and arrive at the exact statistics of each market segment and subsegment, data triangulation, and market breakup procedures were employed, wherever applicable. The overall market size was then used in the top-down procedure to estimate the size of other individual markets via percentage splits of the market segmentation.
Report Objectives
- To define, describe, and predict the master data management market by component (solution and services), mapping type, application, vertical, and region
- To provide detailed information related to major factors (drivers, restraints, opportunities, and industry-specific challenges) influencing the market growth
- To analyze opportunities in the market and provide details of the competitive landscape for stakeholders and market leaders
- To forecast the market size of segments for five main regions: North America, Europe, Asia Pacific (APAC), Middle East and Africa (MEA), and Latin America
- To profile key players and comprehensively analyze their market rankings and core competencies
- To analyze competitive developments, such as partnerships, new product launches, and mergers and acquisitions, in the market
- To analyze the impact of the COVID-19 pandemic on the market
Available Customizations
With the given market data, MarketsandMarkets offers customizations as per the company’s specific needs. The following customization options are available for the report:
Product Analysis
- Product matrix provides a detailed comparison of the product portfolio of each company
Geographic Analysis
- Further breakup of the North American master data management market
- Further breakup of the European market
- Further breakup of the APAC market
- Further breakup of the Latin American market
- Further breakup of the MEA market
Company Information
- Detailed analysis and profiling of additional market players up to 5

 Generating Response ...


Growth opportunities and latent adjacency in Master Data Management Market