Medical Image Management Market by Product (PACS (Departmental, Radiology, Mammography, Cardiology, Enterprise), VNA (On-premise, Hybrid, Cloud), AICA, Universal Viewer), End User (Hospitals, Diagnostic Imaging Centers, ASC, CRO) - Global Forecast to 2023


The medical image management market is projected to reach USD 4.40 billion in 2023, at a CAGR of 7.7%. The growth of the market is driven by the technological advancements in diagnostic imaging modalities and image management software, growing investments in the medical imaging market, government initiatives to encourage EMR adoption, increasing usage of imaging equipment, and the growing adoption of image management systems by small hospitals and imaging centers, are factors driving the growth of the medical image management market.
The Objectives of this Study are as follows:
- To define, describe, and forecast the medical image management market by product, end user, and region
- To provide detailed information about the factors influencing market growth (drivers, restraints, opportunities, and industry-specific challenges)
- To strategically analyze micromarkets with respect to individual growth trends, prospects, and contributions to the overall market
- To analyze market opportunities for stakeholders and provide details of the competitive landscape for key players
- To forecast the market size of market segments in North America, Europe, Asia, Pacific countries, and the Rest of the World (RoW)
- To profile key players and comprehensively analyze their product portfolios, market positions, and core competencies3
- To track and analyze competitive developments such as partnerships, agreements, and collaborations; mergers & acquisitions; product launches and enhancements; and expansions in the medical image management market
Research Methodology
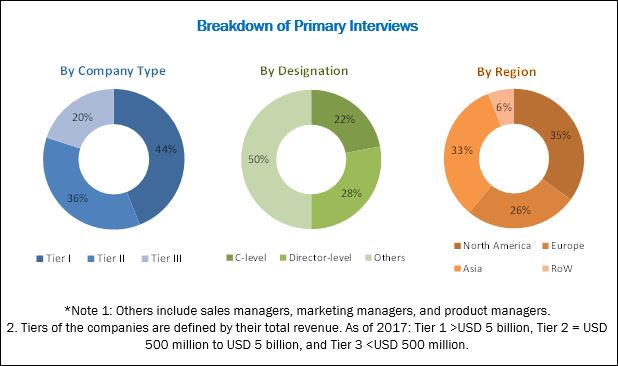
The study estimates the global medical image management industry size for 2018 and projects its demand till 2023. In the primary research process, various sources from both demand and supply sides were interviewed to obtain qualitative and quantitative information for the report. Primary sources from the demand side include various industry CEOs, vice presidents, marketing directors, technology and innovation directors, and related key executives from the various players in the medical image management market.
For the market estimation process, both top-down and bottom-up approaches were used to estimate and validate the market size of the medical image management market as well as to estimate the market size of various other dependent submarkets. All possible parameters that affect the market covered in this research study have been accounted for, viewed in extensive detail, verified through primary research, and analyzed to get the final quantitative and qualitative data. This data was consolidated and added to detailed inputs and analysis from MarketsandMarkets and presented in this report. Some of the secondary sources used for this report include Radiological Society of North America (RSNA), The Association for Medical Imaging Management (AHRA), Medical Imaging and Technology Alliance (MITA), Australian Diagnostic Imaging Association, National Health Service (NHS), Journal of Medical Imaging, International Consortium for Medical Imaging Technology (ICMIT), European Journal of Radiology, and The Asian Oceanian Society of Radiology (AOSR).
To know about the assumptions considered for the study, download the pdf brochure
The medical image management market is marked by the presence of several big and small players. Prominent players offering medical image management products include McKesson Corporation (US), GE Healthcare (US), Fujifilm Holdings Corporation (Japan), Merge Healthcare Inc. (US), Agfa-Gevaert Group (Belgium), Philips Healthcare (Netherlands), Siemens Healthineers (Germany), Carestream Health, Inc. (US), BridgeHead Software (UK), Novarad Corporation (US), Mach7 Technologies Ltd. (US), and INFINITT Healthcare Co., Ltd. (South Korea).
Target Audience for this Report:
- Medical image management software providers
- Diagnostic imaging equipment vendors/service providers
- Standalone image management software/workstation providers
- Healthcare IT service providers
- Research and consulting firms
- Diagnostic imaging centers
- Hospitals
- Venture capitalists
- Government agencies
- Market research and consulting firms
Get online access to the report on the World's First Market Intelligence Cloud
- Easy to Download Historical Data & Forecast Numbers
- Company Analysis Dashboard for high growth potential opportunities
- Research Analyst Access for customization & queries
- Competitor Analysis with Interactive dashboard
- Latest News, Updates & Trend analysis
Request Sample Scope of the Report
Get online access to the report on the World's First Market Intelligence Cloud
- Easy to Download Historical Data & Forecast Numbers
- Company Analysis Dashboard for high growth potential opportunities
- Research Analyst Access for customization & queries
- Competitor Analysis with Interactive dashboard
- Latest News, Updates & Trend analysis

This report categorizes the medical image management market into the following segments and subsegments:
Medical Image Management Market, by Product
-
Picture Archiving and Communication Systems (PACS)
-
PACS Market, by Type
-
Departmental PACS
-
Radiology PACS
-
Mammography PACS
- Traditional PACS
- Vendor Neutral PACS
- Other Radiology PACS
-
Mammography PACS
- Cardiology PACS
- Other Departmental PACS
-
Radiology PACS
- Enterprise PACS
-
Departmental PACS
-
PACS Market, by Delivery Model
- On-premise Models
- Web/Cloud-based Models
-
PACS Market, by Type
-
Vendor Neutral Archives (VNA)
-
VNA Market, by Type
- On-premise
- Hybrid VNA
- Cloud-based VNA
-
VNA Market, by Procurement Model
- Departmental VNA
- Multi-departmental VNA
- Multi-site VNA
-
VNA Market, by Type of Vendor
- PACS Vendors
- Independent Software Vendors
- Infrastructure/Storage Vendors
-
VNA Market, by Type
-
Application-independent Clinical Archives (AICA)
-
AICA Market, by Type of Vendor
- VNA Vendors
- Native AICA Vendors
- Enterprise Viewer/Universal viewer
-
AICA Market, by Type of Vendor
Medical Image Management Market, by End User
- Hospitals
- Diagnostic Imaging Centers
- Other End Users (ambulatory surgical centers, small clinics, and contract research organizations)
Medical Image Management Market, by Region
-
North America
- US
- Canada
-
Europe
- Germany
- UK
- France
- Italy
- Spain
- Rest of Europe (RoE)
-
Asia
- Japan
- China
- India
- Rest of Asia (RoA)
- Rest of the World (RoW)
Available Customizations
With the given market data, MarketsandMarkets offers customizations as per the company‘s specific needs.
The following customization options are available for this report.
Company Information
Detailed analysis and profiling of additional market players (up to 5)
The report segments the medical image management market by product, end user, and region.
Based on products, the medical image management market is segmented into PACS, VNAs, AICA, and enterprise/universal viewers. The PACS segment is expected to account for the largest share of the market in 2018. Factors such as technological advancements in PACS: adoption of PACS in new imaging segments such as endoscopy, ophthalmology, mammography, and oncology; growing adoption of PACS by small hospitals and imaging centers; and government initiatives encouraging Healthcare IT adoption are driving the growth of the PACS segment.
On the basis of type, the PACS market is segmented into radiology PACS, cardiology PACS, and other departmental PACS which include PACS solutions for specialties such as ophthalmology, pathology, oncology, radiotherapy, endoscopy, and dentistry. In 2018, the radiology PACS held the largest share of the market as the radiology department of a hospital is where a majority of the imaging studies are handled, managed, and stored.
The medical image management market is segmented on the basis of end users into hospitals, diagnostic imaging centers, and other end users. In 2018, the hospitals segment is expected to account for the largest share of the global medical image management market. The rising patient population, growing awareness about the benefits of early disease diagnosis, increasing digitization of patient data, and rapid growth in EMR adoption are some of the major factors responsible for the large share of the hospitals segment in the market.
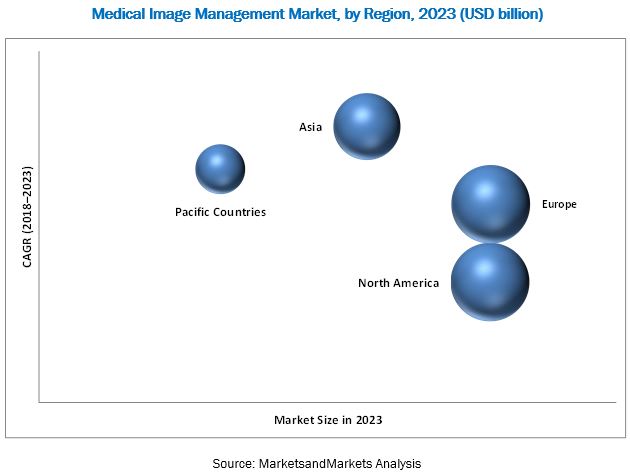
The market is dominated by North America, followed by Europe. The dominance of the North American market is attributed to factors such as the large number of imaging centers in this region, ongoing research activities, and rapid adoption of technologically advanced imaging systems. Additionally, government initiatives towards digitization and increasing adoption of EHR/EMR and data storage & exchange solutions are additional factors driving the adoption of medical image management in this region.
While the medical image management market represents significant growth opportunities, market growth may be hindered due to the high implementation and maintenance costs of these solutions, budgetary constraints, and the longer product life cycle of VNA.
The medical image management market is marked by the presence of several big and small players. McKesson Corporation (US), GE Healthcare (US), Fujifilm Holdings Corporation (Japan), Merge Healthcare Inc. (US), Agfa-Gevaert Group (Belgium), Philips Healthcare (Netherlands), Siemens Healthineers (Germany), Carestream Health, Inc. (US), BridgeHead Software (UK), Novarad Corporation (US), Mach7 Technologies Ltd. (US), and INFINITT Healthcare Co., Ltd. (South Korea) are some of the prominent players in this market.
To speak to our analyst for a discussion on the above findings, click Speak to Analyst
Table of Contents
1 Introduction (Page No. - 20)
1.1 Objectives of the Study
1.2 Market Definition
1.3 Market Scope
1.3.1 Markets Covered
1.3.2 Years Considered for the Study
1.4 Currency
1.5 Limitations
1.6 Market Stakeholders
2 Research Methodology (Page No. - 24)
2.1 Secondary Data
2.1.1 Key Data From Secondary Sources
2.2 Primary Data
2.2.1 Key Data From Primary Sources
2.3 Key Industry Insights
2.4 Market Size Estimation
2.5 Market Breakdown and Data Triangulation
2.6 Assumptions for the Study
3 Executive Summary (Page No. - 32)
4 Premium Insights (Page No. - 37)
4.1 Medical Image Management Market Overview
4.2 Medical Image Management Market, By Product
4.3 PACS Market, By Procurement Model
4.4 VNA Market, By Delivery Model
4.5 Medical Image Management Market, By End User
4.6 Geographic Snapshot: Medical Image Management Market
5 Market Overview (Page No. - 41)
5.1 Market Dynamics
5.1.1 Drivers
5.1.1.1 Technological Advancements in Diagnostic Imaging Modalities and Image Management Solutions
5.1.1.2 Growing Investments in the Medical Imaging Market
5.1.1.3 Government Initiatives to Encourage EMR Adoption
5.1.1.4 Rapid Growth in Geriatric Imaging Volumes
5.1.1.5 Increasing Usage of Imaging Equipment
5.1.1.6 Growing Adoption of VNA
5.1.1.7 Growing Adoption of Image Management Systems By Small Hospitals and Imaging Centers
5.1.1.8 Rapidly Growing Big Data Market
5.1.2 Restraints
5.1.2.1 Longer Product Lifecycle of VNAs
5.1.2.2 Budgetary Constraints
5.1.3 Opportunities
5.1.3.1 Integration of PACS/VNA With Emr and ECM
5.1.3.2 Integration of PACS & VNA With Artificial Intelligence-Based Technologies
5.1.3.3 Blockchain for Medical Imaging
5.1.3.4 High-Growth Opportunities Offered By Cloud-Based Solutions
5.1.3.5 Untapped Emerging Markets
5.1.3.6 Increasing Consolidation in the Healthcare Industry
5.1.3.7 Growing Potential for Adoption Across Multiple Specialties
5.1.4 Challenges
5.1.4.1 Dependence of VNA and PACS Sales on Capital Equipment Purchasing
5.1.4.2 Usability and User Interface Challenges
5.1.4.3 Post-Implementation Issues in VNA Solutions
6 Medical Image Management Market, By Product (Page No. - 51)
6.1 Introduction
6.2 Picture Archiving and Communication System
6.2.1 PACS Market, By Procurement Model
6.2.1.1 Departmental PACS
6.2.1.1.1 Departmental PACS Market, By Type
6.2.1.1.1.1 Radiology PACS
6.2.1.1.1.2 Cardiology PACS
6.2.1.1.1.3 Other Departmental PACS
6.2.1.2 Enterprise PACS
6.2.2 PACS Market, By Delivery Model
6.2.2.1 On-Premise Model
6.2.2.2 Web/Cloud-Based Models
6.3 Vendor Neutral Archive (VNA)
6.3.1 VNA Market, By Delivery Model
6.3.1.1 On-Premise VNA
6.3.1.2 Hybrid VNA
6.3.1.3 Fully Cloud-Based VNA
6.3.2 VNA Market, By Procurement Model
6.3.2.1 Multi-Departmental Enterprise VNA
6.3.2.2 Departmental VNA
6.3.2.3 Multi-Site Enterprise VNA
6.3.3 VNA Market, By Vendor Type
6.3.3.1 PACS Vendors
6.3.3.2 Independent Software Vendors (ISVS)
6.3.3.3 Infrastructure/Storage Vendors
6.4 Application-Independent Clinical Archives
6.4.1 Application-Independent Clinical Archives Market, By Vendor Type
6.4.1.1 VNA Vendors
6.4.1.2 Native Aica Vendors
6.5 Enterprise Viewers/Universal Viewers
7 Medical Image Management Market, By End User (Page No. - 106)
7.1 Introduction
7.2 Hospitals
7.3 Diagnostic Imaging Centers
7.4 Other End Users
8 Medical Image Management Market, By Region (Page No. - 116)
8.1 Introduction
8.2 North America
8.2.1 US
8.2.2 Canada
8.3 Europe
8.3.1 Germany
8.3.2 France
8.3.3 UK
8.3.4 Italy
8.3.5 Spain
8.3.6 Rest of Europe
8.4 Asia
8.4.1 Japan
8.4.2 China
8.4.3 India
8.4.4 Rest of Asia
8.5 Rest of the World
9 Competitive Landscape (Page No. - 181)
9.1 Overview
9.2 Market Player Ranking, 2017
9.3 Competitive Situation and Trends
9.3.1 Partnerships, Agreements, Collaborations, and Joint Ventures
9.3.2 Product Launches and Enhancements
9.3.3 Acquisitions
9.3.4 Expansions
10 Company Profiles (Page No. - 188)
(Introduction, Products & Services, Strategy, & Analyst Insights, Developments, MnM View)*
10.1 Mckesson Corporation
10.2 GE Healthcare (A General Electric Company)
10.3 Fujifilm Holdings Corporation
10.4 Merge Healthcare Incorporated (Acquired By IBM Corporation)
10.5 AGFA-Gevaert Group (AGFA)
10.6 Philips Healthcare (A Subsidiary of Royal Philips Electronics)
10.7 Sectra AB
10.8 Siemens Healthineers (A Division of Siemens AG)
10.9 Carestream Health, Inc. (A Subsidiary of Onex Corporation)
10.10 Bridgehead Software
10.11 Novarad Corporation
10.12 Mach7 Technologies, Ltd.
10.13 Infinitt Healthcare Co, Ltd.
*Details on Marketsandmarkets View, Introduction, Product & Services, Strategy, & Analyst Insights, New Developments Might Not Be Captured in Case of Unlisted Companies.
11 Appendix (Page No. - 216)
11.1 Insights From Industry Experts
11.2 Discussion Guide
11.3 Knowledge Store: Marketsandmarkets’ Subscription Portal
11.4 Available Customizations
11.5 Related Reports
11.6 Author Details
List of Tables (246 Tables)
Table 1 Medical Image Management Market, By Product, 2016–2023 (USD Million)
Table 2 Medical Image Management Market for PACS, By Region, 2016–2023 (USD Million)
Table 3 North America: Medical Image Management Market for PACS, By Country, 2016–2023 (USD Million)
Table 4 Europe: Medical Image Management Market for PACS, By Country, 2016–2023 (USD Million)
Table 5 Asia: Medical Image Management Market for PACS, By Country, 2016–2023 (USD Million)
Table 6 PACS Market, By Procurement Model, 2016–2023 (USD Million)
Table 7 Departmental PACS Market, By Region, 2016–2023 (USD Million)
Table 8 North America: Departmental PACS Market, By Country, 2016–2023 (USD Million)
Table 9 Europe: Departmental PACS Market, By Country, 2016–2023 (USD Million)
Table 10 Asia: Departmental PACS Market, By Country, 2016–2023 (USD Million)
Table 11 Departmental PACS Market, By Type, 2016–2023 (USD Million)
Table 12 Radiology PACS Market, By Region, 2016–2023 (USD Million)
Table 13 North America: Radiology PACS Market, By Country, 2016–2023 (USD Million)
Table 14 Europe: Radiology PACS Market, By Country, 2016–2023 (USD Million)
Table 15 Asia: Radiology PACS Market, By Country, 2016–2023 (USD Million)
Table 16 Radiology PACS Market, By Type, 2016–2023 (USD Million)
Table 17 Mammography PACS Market, By Region, 2016–2023 (USD Million)
Table 18 Mammography PACS Market, By Type of Solution, 2016–2023 (USD Million)
Table 19 Cardiology PACS Market, By Region, 2016–2023 (USD Million)
Table 20 North America: Cardiology PACS Market, By Country, 2016–2023 (USD Million)
Table 21 Europe: Cardiology PACS Market, By Country, 2016–2023 (USD Million)
Table 22 Asia: Cardiology PACS Market, By Country, 2016–2023 (USD Million)
Table 23 Other Departmental PACS Market, By Region, 2016–2023 (USD Million)
Table 24 North America: Other Departmental PACS Market, By Country, 2016–2023 (USD Million)
Table 25 Europe: Other Departmental PACS Market, By Country, 2016–2023 (USD Million)
Table 26 Asia: Other Departmental PACS Market, By Country, 2016–2023 (USD Million)
Table 27 Enterprise PACS Market, By Region, 2016–2023 (USD Million)
Table 28 North America: Enterprise PACS Market, By Country, 2016–2023 (USD Million)
Table 29 Europe: Enterprise PACS Market, By Country, 2016–2023 (USD Million)
Table 30 Asia: Enterprise PACS Market, By Country, 2016–2023 (USD Million)
Table 31 PACS Market, By Delivery Model, 2016–2023 (USD Million)
Table 32 On-Premise PACS Market, By Region, 2016–2023 (USD Million)
Table 33 North America: On-Premise PACS Market, By Country, 2016–2023 (USD Million)
Table 34 Europe: On-Premise PACS Market, By Country, 2016–2023 (USD Million)
Table 35 Asia: On-Premise PACS Market, By Country, 2016–2023 (USD Million)
Table 36 Web/Cloud-Based PACS Market, By Region, 2016–2023 (USD Million)
Table 37 North America: Web/Cloud-Based PACS Market, By Country, 2016–2023 (USD Million)
Table 38 Europe: Web/Cloud-Based PACS Market, By Country, 2016–2023 (USD Million)
Table 39 Asia: Web/Cloud-Based PACS Market, By Country, 2016–2023 (USD Million)
Table 40 Medical Image Management Market for VNA, By Region, 2016–2023 (USD Million)
Table 41 North America: Medical Image Management Market for VNA, By Country, 2016–2023 (USD Million)
Table 42 Europe: Medical Image Management Market for VNA, By Country, 2016–2023 (USD Million)
Table 43 Asia: Medical Image Management Market for VNA, By Country, 2016–2023 (USD Million)
Table 44 VNA Market, By Delivery Model, 2016–2023 (USD Million)
Table 45 On-Premise VNA Market, By Region, 2016–2023 (USD Million)
Table 46 North America: On-Premise VNA Market, By Country, 2016–2023 (USD Million)
Table 47 Europe: On-Premise VNA Market, By Country, 2016–2023 (USD Million)
Table 48 Asia: On-Premise VNA Market, By Country, 2016–2023 (USD Million)
Table 49 Hybrid VNA Market, By Region, 2016–2023 (USD Million)
Table 50 North America: Hybrid VNA Market, By Country, 2016–2023 (USD Million)
Table 51 Europe: Hybrid VNA Market, By Country, 2016–2023 (USD Million)
Table 52 Asia: Hybrid VNA Market, By Country, 2016–2023 (USD Million)
Table 53 Fully Cloud-Based VNA Market, By Region, 2016–2023 (USD Million)
Table 54 North America: Fully Cloud-Based VNA Market, By Country, 2016–2023 (USD Million)
Table 55 Europe: Fully Cloud-Based VNA Market, By Country, 2016–2023 (USD Million)
Table 56 Asia: Fully Cloud-Based VNA Market, By Country, 2016–2023 (USD Million)
Table 57 VNA Market, By Procurement Model, 2016–2023 (USD Million)
Table 58 Multi-Departmental Enterprise VNA Market, By Region, 2016–2023 (USD Million)
Table 59 North America: Multi-Departmental Enterprise VNA Market, By Country, 2016–2023 (USD Million)
Table 60 Europe: Multi-Departmental Enterprise VNA Market, By Country, 2016–2023 (USD Million)
Table 61 Asia: Multi-Departmental Enterprise VNA Market, By Country, 2016–2023 (USD Million)
Table 62 Departmental VNA Market, By Region, 2016–2023 (USD Million)
Table 63 North America: Departmental VNA Market, By Country, 2016–2023 (USD Million)
Table 64 Europe: Departmental VNA Market, By Country, 2016–2023 (USD Million)
Table 65 Asia: Departmental VNA Market, By Country, 2016–2023 (USD Million)
Table 66 Multi-Site Enterprise VNA Market, By Region, 2016–2023 (USD Million)
Table 67 North America: Multi-Site Enterprise VNA Market, By Country, 2016–2023 (USD Million)
Table 68 Europe: Multi-Site Enterprise VNA Market, By Country, 2016–2023 (USD Million)
Table 69 Asia: Multi-Site Enterprise VNA Market, By Country, 2016–2023 (USD Million)
Table 70 VNA Market, By Vendor Type, 2016–2023 (USD Million)
Table 71 VNA Market for PACS Vendors, By Region, 2016–2023 (USD Million)
Table 72 North America: VNA Market for PACS Vendors, By Country, 2016–2023 (USD Million)
Table 73 Europe: VNA Market for PACS Vendors, By Country, 2016–2023 (USD Million)
Table 74 Asia: VNA Market for PACS Vendors, By Country, 2016–2023 (USD Million)
Table 75 VNA Market for Independent Software Vendors, By Region, 2016–2023 (USD Million)
Table 76 North America: VNA Market for Independent Software Vendors, By Country, 2016–2023 (USD Million)
Table 77 Europe: VNA Market for Independent Software Vendors, By Country, 2016–2023 (USD Million)
Table 78 Asia: VNA Market for Independent Software Vendors, By Country, 2016–2023 (USD Million)
Table 79 VNA Market for Infrastructure/Storage Vendors, By Region, 2016–2023 (USD Million)
Table 80 North America: VNA Market for Infrastructure/Storage Vendors, By Country, 2016–2023 (USD Million)
Table 81 Europe: VNA Market for Infrastructure/Storage, By Country, 2016–2023 (USD Million)
Table 82 Asia: VNA Market for Infrastructure/Storage Vendors, By Country, 2016–2023 (USD Million)
Table 83 Medical Image Management Market for Application-Independent Clinical Archives, By Region, 2016–2023 (USD Million)
Table 84 North America: Medical Image Management Market for Application-Independent Clinical Archives, By Country, 2016–2023 (USD Million)
Table 85 Europe: Medical Image Management Market for Application-Independent Clinical Archives, By Country, 2016–2023 (USD Million)
Table 86 Asia: Medical Image Management Market for Application-Independent Clinical Archives, By Country, 2016–2023 (USD Million)
Table 87 Application-Independent Clinical Archives Market, By Vendor Type, 2016–2023 (USD Million)
Table 88 Application-Independent Clinical Archives Market for VNA Vendors, By Region, 2016–2023 (USD Million)
Table 89 Application-Independent Clinical Archives Market for Native Aica Vendors, By Region, 2016–2023 (USD Million)
Table 90 Medical Image Management Market for Universal Viewers, By Region, 2016–2023 (USD Million)
Table 91 North America: Medical Image Management Market for Universal Viewers, By Country, 2016–2023 (USD Million)
Table 92 Europe: Medical Image Management Market for Universal Viewers, By Country, 2016–2023 (USD Million)
Table 93 Asia: Medical Image Management Market for Universal Viewers, By Country, 2016–2023 (USD Million)
Table 94 Medical Image Management Market, By End User, 2016–2023 (USD Million)
Table 95 Medical Image Management Market for Hospitals, By Region, 2016–2023 (USD Million)
Table 96 North America: Medical Image Management Market for Hospitals, By Country, 2016–2023 (USD Million)
Table 97 Europe: Medical Image Management Market for Hospitals, By Country, 2016–2023 (USD Million)
Table 98 Asia: Medical Image Management Market for Hospitals, By Country, 2016–2023 (USD Million)
Table 99 Medical Image Management Market for Diagnostic Imaging Centers, By Region, 2016–2023 (USD Million)
Table 100 North America: Medical Image Management Market for Diagnostic Imaging Centers , By Country, 2016–2023 (USD Million)
Table 101 Europe: Medical Image Management Market for Diagnostic Imaging Centers, By Country, 2016–2023 (USD Million)
Table 102 Asia: Medical Image Management Market for Diagnostic Imaging Centers, By Country, 2016–2023 (USD Million)
Table 103 Medical Image Management Market for Other End Users, By Region, 2016–2023 (USD Million)
Table 104 North America: Medical Image Management Market for Other End Users, By Country, 2016–2023 (USD Million)
Table 105 Europe: Medical Image Management Market for Other End Users, By Country, 2016–2023 (USD Million)
Table 106 Asia: Medical Image Management Market for Other End Users, By Country, 2016–2023 (USD Million)
Table 107 Medical Image Management Market, By Region, 2016–2023 (USD Million)
Table 108 North America: Medical Image Management Market, By Country, 2016–2023 (USD Million)
Table 109 North America: Medical Image Management Market, By Product, 2016–2023 (USD Million)
Table 110 North America: PACS Market, By Procurement Model, 2016–2023 (USD Million)
Table 111 North America: Departmental PACS Market, By Type, 2016–2023 (USD Million)
Table 112 North America: PACS Market, By Delivery Model, 2016–2023 (USD Million)
Table 113 North America: VNA Market, By Delivery Model, 2016–2023 (USD Million)
Table 114 North America: VNA Market, By Procurement Model, 2016–2023 (USD Million)
Table 115 North America: VNA Market, By Vendor Type, 2016–2023 (USD Million)
Table 116 North America: Application-Independent Clinical Archives Market, By Vendor Type, 2016–2023 (USD Million)
Table 117 North America: Medical Image Management Market, By End User, 2016–2023 (USD Million)
Table 118 US: Medical Image Management Market, By Product, 2016–2023 (USD Million)
Table 119 US: PACS Market, By Procurement Model, 2016–2023 (USD Million)
Table 120 US: Departmental PACS Market, By Type, 2016–2023 (USD Million)
Table 121 US: PACS Market, By Delivery Model, 2016–2023 (USD Million)
Table 122 US: VNA Market, By Delivery Model, 2016–2023 (USD Million)
Table 123 US: VNA Market, By Procurement Model, 2016–2023 (USD Million)
Table 124 US: VNA Market, By Vendor Type, 2016–2023 (USD Million)
Table 125 US: Medical Image Management Market, By End User, 2016–2023 (USD Million)
Table 126 Canada: Medical Image Management Market, By Product, 2016–2023 (USD Million)
Table 127 Canada: PACS Market, By Procurement Model, 2016–2023 (USD Million)
Table 128 Canada: Departmental PACS Market, By Type, 2016–2023 (USD Million)
Table 129 Canada: PACS Market, By Delivery Model, 2016–2023 (USD Million)
Table 130 Canada: VNA Market, By Delivery Model, 2016–2023 (USD Million)
Table 131 Canada: VNA Market, By Procurement Model, 2016–2023 (USD Million)
Table 132 Canada: VNA Market, By Vendor Type, 2016–2023 (USD Million)
Table 133 Canada: Medical Image Management Market, By End User, 2016–2023 (USD Million)
Table 134 Europe: Medical Image Management Market, By Country, 2016–2023 (USD Million)
Table 135 Europe: Medical Image Management Market, By Product, 2016–2023 (USD Million)
Table 136 Europe: PACS Market, By Procurement Model, 2016–2023 (USD Million)
Table 137 Europe: Departmental PACS Market, By Type, 2016–2023 (USD Million)
Table 138 Europe: PACS Market, By Delivery Model, 2016–2023 (USD Million)
Table 139 Europe: VNA Market, By Delivery Model, 2016–2023 (USD Million)
Table 140 Europe: VNA Market, By Procurement Model, 2016–2023 (USD Million)
Table 141 Europe: VNA Market, By Vendor Type, 2016–2023 (USD Million)
Table 142 Europe: Application-Independent Clinical Archives Market, By Vendor Type, 2016–2023 (USD Million)
Table 143 Europe: Medical Image Management Market, By End User, 2016–2023 (USD Million)
Table 144 Germany: Medical Image Management Market, By Product, 2016–2023 (USD Million)
Table 145 Germany: PACS Market, By Procurement Model, 2016–2023 (USD Million)
Table 146 Germany: Departmental PACS Market, By Type, 2016–2023 (USD Million)
Table 147 Germany: PACS Market, By Delivery Model, 2016–2023 (USD Million)
Table 148 Germany: VNA Market, By Delivery Model, 2016–2023 (USD Million)
Table 149 Germany: VNA Market, By Procurement Model, 2016–2023 (USD Million)
Table 150 Germany: VNA Market, By Vendor Type, 2016–2023 (USD Million)
Table 151 Germany: Medical Image Management Market, By End User, 2016–2023 (USD Million)
Table 152 France: Medical Image Management Market, By Product, 2016–2023 (USD Million)
Table 153 France: PACS Market, By Procurement Model, 2016–2023 (USD Million)
Table 154 France: Departmental PACS Market, By Type, 2016–2023 (USD Million)
Table 155 France: PACS Market, By Delivery Model, 2016–2023 (USD Million)
Table 156 France: VNA Market, By Delivery Model, 2016–2023 (USD Million)
Table 157 France: VNA Market, By Procurement Model, 2016–2023 (USD Million)
Table 158 France: VNA Market, By Vendor Type, 2016–2023 (USD Million)
Table 159 France: Medical Image Management Market, By End User, 2016–2023 (USD Million)
Table 160 UK: Medical Image Management Market, By Product, 2016–2023 (USD Million)
Table 161 UK: PACS Market, By Procurement Model, 2016–2023 (USD Million)
Table 162 UK: Departmental PACS Market, By Type, 2016–2023 (USD Million)
Table 163 UK: PACS Market, By Delivery Model, 2016–2023 (USD Million)
Table 164 UK: VNA Market, By Delivery Model, 2016–2023 (USD Million)
Table 165 UK: VNA Market, By Procurement Model, 2016–2023 (USD Million)
Table 166 UK: VNA Market, By Vendor Type, 2016–2023 (USD Million)
Table 167 UK: Medical Image Management Market, By End User, 2016–2023 (USD Million)
Table 168 Italy: Medical Image Management Market, By Product, 2016–2023 (USD Million)
Table 169 Italy: PACS Market, By Procurement Model, 2016–2023 (USD Million)
Table 170 Italy: Departmental PACS Market, By Type, 2016–2023 (USD Million)
Table 171 Italy: PACS Market, By Delivery Model, 2016–2023 (USD Million)
Table 172 Italy: VNA Market, By Delivery Model, 2016–2023 (USD Million)
Table 173 Italy: VNA Market, By Procurement Model, 2016–2023 (USD Million)
Table 174 Italy: VNA Market, By Vendor Type, 2016–2023 (USD Million)
Table 175 Italy: Medical Image Management Market, By End User, 2016–2023 (USD Million)
Table 176 Spain: Medical Image Management Market, By Product, 2016–2023 (USD Million)
Table 177 Spain: PACS Market, By Procurement Model, 2016–2023 (USD Million)
Table 178 Spain: Departmental PACS Market, By Type, 2016–2023 (USD Million)
Table 179 Spain: PACS Market, By Delivery Model, 2016–2023 (USD Million)
Table 180 Spain: VNA Market, By Delivery Model, 2016–2023 (USD Million)
Table 181 Spain: VNA Market, By Procurement Model, 2016–2023 (USD Million)
Table 182 Spain: VNA Market, By Vendor Type, 2016–2023 (USD Million)
Table 183 Spain: Medical Image Management Market, By End User, 2016–2023 (USD Million)
Table 184 RoE: Medical Image Management Market, By Product, 2016–2023 (USD Million)
Table 185 RoE: PACS Market, By Procurement Model, 2016–2023 (USD Million)
Table 186 RoE: Departmental PACS Market, By Type, 2016–2023 (USD Million)
Table 187 RoE: PACS Market, By Delivery Model, 2016–2023 (USD Million)
Table 188 RoE: VNA Market, By Delivery Model, 2016–2023 (USD Million)
Table 189 RoE: VNA Market, By Procurement Model, 2016–2023 (USD Million)
Table 190 RoE: VNA Market, By Vendor Type, 2016–2023 (USD Million)
Table 191 RoE: Medical Image Management Market, By End User, 2016–2023 (USD Million)
Table 192 Asia: Medical Image Management Market, By Country, 2016–2023 (USD Million)
Table 193 Asia: Medical Image Management Market, By Product, 2016–2023 (USD Million)
Table 194 Asia: PACS Market, By Procurement Model, 2016–2023 (USD Million)
Table 195 Asia: Departmental PACS Market, By Type, 2016–2023 (USD Million)
Table 196 Asia: PACS Market, By Delivery Model, 2016–2023 (USD Million)
Table 197 Asia: VNA Market, By Delivery Model, 2016–2023 (USD Million)
Table 198 Asia: VNA Market, By Procurement Model, 2016–2023 (USD Million)
Table 199 Asia: VNA Market, By Vendor Type, 2016–2023 (USD Million)
Table 200 Asia: Application-Independent Clinical Archives Market, By Vendor Type, 2016–2023 (USD Million)
Table 201 Asia: Medical Image Management Market, By End User, 2016–2023 (USD Million)
Table 202 Japan: Medical Image Management Market, By Product, 2016–2023 (USD Million)
Table 203 Japan: PACS Market, By Procurement Model, 2016–2023 (USD Million)
Table 204 Japan: Departmental PACS Market, By Type, 2016–2023 (USD Million)
Table 205 Japan: PACS Market, By Delivery Model, 2016–2023 (USD Million)
Table 206 Japan: VNA Market, By Delivery Model, 2016–2023 (USD Million)
Table 207 Japan: VNA Market, By Procurement Model, 2016–2023 (USD Million)
Table 208 Japan: VNA Market, By Vendor Type, 2016–2023 (USD Million)
Table 209 Japan: Medical Image Management Market, By End User, 2016–2023 (USD Million)
Table 210 China: Medical Image Management Market, By Product, 2016–2023 (USD Million)
Table 211 China: PACS Market, By Procurement Model, 2016–2023 (USD Million)
Table 212 China: Departmental PACS Market, By Type, 2016–2023 (USD Million)
Table 213 China: PACS Market, By Delivery Model, 2016–2023 (USD Million)
Table 214 China: VNA Market, By Delivery Model, 2016–2023 (USD Million)
Table 215 China: VNA Market, By Procurement Model, 2016–2023 (USD Million)
Table 216 China: VNA Market, By Vendor Type, 2016–2023 (USD Million)
Table 217 China: Medical Image Management Market, By End User, 2016–2023 (USD Million)
Table 218 India: Medical Image Management Market, By Product, 2016–2023 (USD Million)
Table 219 India: PACS Market, By Procurement Model, 2016–2023 (USD Million)
Table 220 India: Departmental PACS Market, By Type, 2016–2023 (USD Million)
Table 221 India: PACS Market, By Delivery Model, 2016–2023 (USD Million)
Table 222 India: VNA Market, By Delivery Model, 2016–2023 (USD Million)
Table 223 India: VNA Market, By Procurement Model, 2016–2023 (USD Million)
Table 224 India: VNA Market, By Vendor Type, 2016–2023 (USD Million)
Table 225 India: Medical Image Management Market, By End User, 2016–2023 (USD Million)
Table 226 RoA: Medical Image Management Market, By Product, 2016–2023 (USD Million)
Table 227 RoA: PACS Market, By Procurement Model, 2016–2023 (USD Million)
Table 228 RoA: Departmental PACS Market, By Type, 2016–2023 (USD Million)
Table 229 RoA: PACS Market, By Delivery Model, 2016–2023 (USD Million)
Table 230 RoA: VNA Market, By Delivery Model, 2016–2023 (USD Million)
Table 231 RoA: VNA Market, By Procurement Model, 2016–2023 (USD Million)
Table 232 RoA: VNA Market, By Vendor Type, 2016–2023 (USD Million)
Table 233 RoA: Medical Image Management Market, By End User, 2016–2023 (USD Million)
Table 234 RoW: Medical Image Management Market, By Product, 2016–2023 (USD Million)
Table 235 RoW: PACS Market, By Procurement Model, 2016–2023 (USD Million)
Table 236 RoW: Departmental PACS Market, By Type, 2016–2023 (USD Million)
Table 237 RoW: PACS Market, By Delivery Model, 2016–2023 (USD Million)
Table 238 RoW: VNA Market, By Delivery Model, 2016–2023 (USD Million)
Table 239 RoW: VNA Market, By Procurement Model, 2016–2023 (USD Million)
Table 240 RoW: VNA Market, By Vendor Type, 2016–2023 (USD Million)
Table 241 RoW: Application-Independent Clinical Archives Market, By Vendor Type, 2016–2023 (USD Million)
Table 242 RoW: Medical Image Management Market, By End User, 2016–2023 (USD Million)
Table 243 Partnerships, Agreements, Collaborations, and Joint Ventures (2015-2018)
Table 244 Product Launches and Enhancements (2015–2018)
Table 245 Acquisitions (2015–2018)
Table 246 Expansions (2015–2018)
List of Figures (39 Figures)
Figure 1 Research Design
Figure 2 Market Size Estimation: Bottom-Up Approach
Figure 3 Market Size Estimation: Top-Down Approach
Figure 4 Breakdown of Primary Interviews: By Company Type, Designation, and Region
Figure 5 Data Triangulation Methodology
Figure 6 Medical Image Management Market, By Product, 2018 vs 2023
Figure 7 PACS Market, By Procurement Model, 2018 vs 2023
Figure 8 VNA Market, By Delivery Model, 2018 vs 2023
Figure 9 VNA Market, By Vendor Type, 2018 vs 2023
Figure 10 Medical Image Management Market, By End User, 2018
Figure 11 Medical Image Management Market: Geographical Snapshot
Figure 12 Growing Adoption of Medical Imaging Modalities and Technological Advancements in Image Management Tools are Driving Market Growth
Figure 13 Aica Segment to Grow at the Highest CAGR From 2018 to 2023
Figure 14 Enterprise PACS to Register Highest Growth During the Forecast Period
Figure 15 Hybrid VNA Segment to Grow at the Highest CAGR During the Forecast Period
Figure 16 Hospitals are Projected to Command the Largest Market Share in 2018
Figure 17 China to Witness Highest Growth Rate During the Forecast Period
Figure 18 Medical Image Management Market: Drivers, Restraints, Opportunities, and Challenges
Figure 19 Aica Segment to Register the Highest Growth Rate in the Medical Image Management Market During the Forecast Period (2018–2023)
Figure 20 Radiology PACS Segment to Dominate the Departmental PACS Market in 2018
Figure 21 Hospitals Will Continue to Dominate the Medical Image Management Market During the Forecast Period
Figure 22 Asia to Witness Highest Growth During the Forecast Period (2018–2023)
Figure 23 North America: Market Snapshot
Figure 24 Europe: Market Snapshot
Figure 25 Asia: Market Snapshot
Figure 26 RoW: Market Snapshot
Figure 27 Key Players Adopted Organic as Well as Inorganic Growth Strategies Between 2015 and 2018
Figure 28 Medical Image Management Market Ranking Analysis, By Key Player, 2017
Figure 29 Market Evolution Framework—Agreements, Collaborations, Partnerships, and Joint Ventures Fueled Market Growth
Figure 30 Battle for Market Share: Product Launches & Upgrades Was the Key Strategy Adopted By Market Players (2015–2018)
Figure 31 Mckesson Corporation: Company Snapshot
Figure 32 General Electric (GE) Company: Company Snapshot
Figure 33 Fujifilm Holdings Corporation: Company Snapshot
Figure 34 IBM Corporation: Company Snapshot
Figure 35 AGFA-Gevaert Group: Company Snapshot
Figure 36 Philips Healthcare: Company Snapshot
Figure 37 Sectra AB: Company Snapshot
Figure 38 Siemens AG: Company Snapshot
Figure 39 Mach7 Technologies Ltd.: Company Snapshot

 Generating Response ...


Growth opportunities and latent adjacency in Medical Image Management Market