Military Battery Market

Military Battery Market by Type (Rechargeable, Non-rechargeable), Installation (OEM, Aftermarket), Application (Propulsion, Non-propulsion), Platform (Ground, Airborne, Marine), Composition, Voltage, Power Density and Region - Global Forecast to 2027

Report Code: AS 6434 May, 2022, by marketsandmarkets.com

Updated on : April 03, 2023

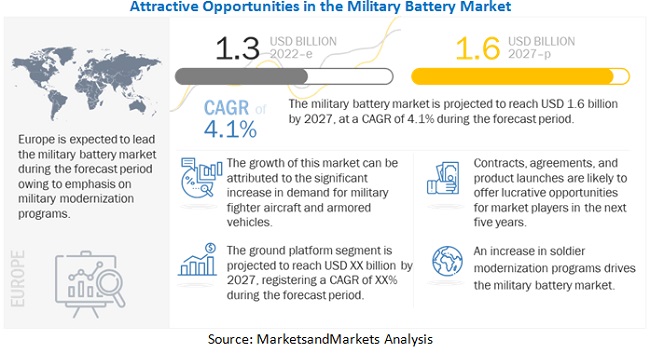
The Military Battery Market size was valued at $1.3 billion in 2022 and is estimated to grow from $1.4 billion in 2023 to $1.6 million by 2027 at a CAGR (Compound Annual Growth Rate) of 4.1%. The military battery industry is driven by increased use of lightweight and high-power density batteries in sophisticated military systems. The demand for lightweight and high-power density military batteries is increasing across the globe due to the growing use of various types of sophisticated systems such as air defense systems and electronic warfare systems by defense forces.

The increasing deployment of Unmanned Aerial Vehicles (UAVs) and man-portable devices, among others, by defense forces has further fueled the demand for lightweight, high power, and long endurance batteries, as these batteries lead to the reduction in the overall size of the systems. For instance, the large D-sized lithium primary battery packs, which are used by UAVs to ensure their safe landing during power failures, are being replaced by small-sized and high-powered lithium AA batteries. These batteries not only reduce the overall size of UAVs but also increase their endurance. Various players such as EnerSys (US), GS Yuasa International Ltd (Japan), Saft (France), Exide Industries (India), and EaglePicher Technologies (US) among others, are prominent players operating in the military battery market.
Military Battery Market

To know about the assumptions considered for the study, Request for Free Sample Report

Military battery Market Dynamics:

Driver: Growing adoption of ground vehicles and UAVs

Various countries are adopting Unmanned Aerial Vehicles (UAVs), military vehicles, and military vessels for intelligence, surveillance, and reconnaissance missions. New generation UAVs such as Predator and Heron, developed by the US and Israel, respectively, are being employed for various combat missions, including attacks on hostile ground targets. The US Army initiated a new program to replace its existing platforms with new advanced combat vehicles. The program called the Next Generation Combat Vehicle project involves the development of Optionally Manned Fighting Vehicle, Armored Multi-Purpose Vehicle, Mobile Protected Firepower, Robotic Combat Vehicle, and Decisive Lethality Platform. The program is projected to be completed by 2035. Such new projects taken up by the armed forces require military batteries and wires. Countries such as the US and the UK are investing in military vehicles and UAVs for combat, surveillance, and intelligence missions. The increasing adoption of ground vehicles and UAVs by defense forces will drive the market for military batteries.

Restraint: Regulations on lithium batteries

Lithium batteries can provide extremely high currents when required and tend to undergo rapid discharging when short-circuited. This often causes the batteries to overheat. Lithium-thionyl chloride and lithium cobalt batteries are particularly more susceptible to overheating, and a short circuit with these batteries may cause the batteries to rupture and explode. The International Air Transport Association (IATA) has therefore placed some restrictions on the transportation of lithium batteries by air. Several postal administrations from countries like the UK, the US, Japan, etc. have banned the transportation of lithium batteries by air.

Military Battery Market Opportunity: Advancements in material sciences and battery technology

There have been significant developments in the field of material science. The specific energies of batteries have increased in recent years. There is a stark difference in the specific energies of lead-acid batteries (30 Wh/Kg) and lithium-ion batteries (205-220 Wh/kg). This has resulted in the development of small, lighter, and more compact batteries with large energy storage capacities. For instance, Sion Power developed a lithium-sulfur battery with specific energies of over 400 Wh/Kg. This battery has twice the energy storage capacity of a standard lithium-ion battery. Similarly, Exellatron developed and patented its experimental Lithium Thin Film batteries, which have a specific energy of about 300 to 350 Wh/Kg and can operate in a wide temperature range from -25C to +80C. These technological advances can benefit the drone battery industry where parameters like specific energy and temperature ranges are some of the key parameters for the selection of batteries.

Military Battery Market Challenges: Design challenges associated with manufacturing batteries

Due to a lack of standardization within the drone battery industry, the battery manufacturers must manufacture their batteries as per customized designs. The manufacturers must also conform to the size, energy density, and weight profile for specific applications while also maintaining a competitive cost. Manufacturers are looking into several economically feasible avenues for manufacturing drone batteries and are also looking at developing other adjacent technologies such as hydrogen fuel cells for drone applications. Designers of drone batteries are investing increasingly in R&D activities to reduce the size and weight of these batteries and developing new technologies like lithium-sulfur and thin-film lithium cells, among others.

Military battery Market Ecosystem:

The key stakeholders in the military battery market ecosystem include companies which provide platforms and soldier systems. The major influencers in this market are investors, funders, academic researchers, integrators, service providers, and licencing agencies.

OEM segment held largest market share in terms of value in military battery market

Military battery market size has been segmented into OEM and aftermarket. OEMs design, develop, and manufacture military batteries for various applications and integrate them on different platforms, such as airborne, marine, and land-based systems. The military battery market is directly linked to the defense market. The growing military spendings directly affect the military market OEMs as they produce more batteries for military applications.

The electrification of military equipment, vehicles, and aircraft will drive the OEM segment, as new batteries will be required for changing technology. In January 2021, Nexans won a contract from Airbus to develop new high voltage batteries for next-generation electric and hybrid aircraft

100-200 Wh/Kg power density is anticipated to grow at highest CAGR during forecast period

Military battery market share has been segmented into three parts: less than 100 Wh/kg, 100-200 Wh/kg, and more than 200 Wh/kg. In the 100-200 Wh/Kg segment, all the batteries installed on unmanned vehicles, soldiers, and some weapons are considered. The battery chemistries in this segment are lithium-ion and zinc-air. The 100-200 Wh/Kg segment is estimated to be USD 291 million in 2022 and is projected to reach USD 372 million by 2027, at a CAGR of 5.0% during the forecast period. Increasing plans for the modernization and procurement of weapons and unmanned systems are expected to drive this segment

In terms of value, Europe led the military battery market

The UK, France, Germany, Italy, Russia, and the Rest of Europe are considered under Europe for market analysis. Europe is a manufacturing hub for various military battery manufacturers, such as Saft (Total), BAE Systems, and ECOBAT Battery Technologies. The demand for military batteries has been increasing in Europe due to the presence of the defense manufacturing industry, growing demand for defense platforms across the globe, and ongoing upgradation programs for existing defense systems.

Military Battery Market by Region

To know about the assumptions considered for the study, download the pdf brochure

Top Military Battery Companies -
Key Market Players

Some of the key players profiled in the military battery market report include EnerSys (US), GS Yuasa International Ltd (Japan), Saft (France), Exide Industries (India), and EaglePicher Technologies (US). The players are mostly engaged in new product launches & developments and having a strong global presence will enhance their position in the military battery industry. These players are primarily focusing on entering new markets by launching technologically advanced and cost-effective platforms and infrastructure. Apart from new product launches & developments, these players also adopted the partnerships contracts, & agreements strategy.

Scope of the Military Battery Market Report

Report Metric

Details

Market size available for years

2018-2027

Base year considered

2021

Forecast period

2022-2027

Forecast units

Value (USD)

Segments covered

By Platform, Type, Application, Composition, Installation, Voltage, Power Density

Geographies covered

North America, Europe, Asia Pacific, Middle East, Rest of the World

Companies covered

EnerSys (US), GS Yuasa International Ltd (Japan), Saft (France), Exide Industries (India), and EaglePicher Technologies (US) among others

This research report categorizes the Military battery Market based on Platform, Type, Application, Composition, Installation, Voltage, Power Density, and Region.

By Platform

  • Ground
  • Airborne
  • Marine

By Type

  • Non-rechargeable
  • Rechargeable
  • Propulsion
  • Non-propulsion

By Composition

  • Rotary Lithium-based
  • Lead-acid
  • Nickel-based
  • Thermal
  • Others

By Installation

  • OEM
  • Aftermarket

By Voltage

  • Less than 12V
  • 12–24V
  • More than 24V

By Power Density

  • Less than 100 Wh/Kg
  • 100–200 Wh/Kg
  • More than 200 Wh/Kg

By Region

  • North America
  • Europe
  • Asia Pacific
  • Middle East
  • Rest of the World

Recent Developments

  • In January 2022, C&L Aerospace signed a distribution agreement with Concorde for the distribution of ERJ 135/145 sealed lead-acid (SLA) batteries.
  • In November 2021, Lincad won a contract from Thales Group for supplying its SquadNet batteries. The batteries will be used for Thale’s industry-leading networking soldier radios.
  • In October 2021, EaglePicher won a contract from IARPA for the development of innovative battery technologies. The contract will include the development of high energy density, long life, sulfur-based batteries.
  • In May 2021, Ultralife, along with three other companies, won a firm-fixed-price indefinite-delivery/ indefinite-quantity contract from the US Army for supplying conformal wearable batteries. The contract was awarded by the US Army under its Tactical Power Generation Program.
  • In May 2021, Bren-Tronics was among the four awardees who won a contract from the US Army for supplying conformal wearable batteries (CWBs).

Frequently Asked Questions (FAQ):

To speak to our analyst for a discussion on the above findings, click Speak to Analyst


TABLE OF CONTENTS
 
1 INTRODUCTION (Page No. - 31)
    1.1 OBJECTIVES OF THE STUDY
    1.2 MARKET DEFINITION
    1.3 STUDY SCOPE
           1.3.1 MARKETS COVERED
           1.3.2 REGIONAL SCOPE
    1.4 YEARS CONSIDERED FOR THE STUDY
    1.5 CURRENCY & PRICING
           TABLE 1 USD EXCHANGE RATES
    1.6 LIMITATIONS
    1.7 INCLUSIONS & EXCLUSIONS
    1.8 SUMMARY OF CHANGES
    1.9 STAKEHOLDERS
 
2 RESEARCH METHODOLOGY (Page No. - 36)
    2.1 RESEARCH DATA
           FIGURE 1 REPORT PROCESS FLOW
           FIGURE 2 RESEARCH DESIGN
           2.1.1 SECONDARY DATA
                    2.1.1.1 Key data from secondary sources
           2.1.2 PRIMARY DATA
                    2.1.2.1 Key data from primary sources
                    2.1.2.2 Breakdown of primaries
                    2.1.2.3 Primaries insights
    2.2 FACTOR ANALYSIS
           2.2.1 INTRODUCTISSSSON
           2.2.2 DEMAND-SIDE INDICASSTORS
                    2.2.2.1 Increase in number of military fleet deliveries
           2.2.3 SUPPLY-SIDE INDICATORS
    2.3 MARKET SIZE ESTIMATION
           2.3.1 BOTTOM-UP APPROACH
                    FIGURE 3 MARKET SIZE ESTIMATION METHODOLOGY: BOTTOM-UP APPROACH
           2.3.2 TOP-DOWN APPROACH
                    FIGURE 4 MARKET SIZE ESTIMATION METHODOLOGY: TOP-DOWN APPROACH
    2.4 DATA TRIANGULATION
           FIGURE 5 DATA TRIANGULATION
    2.5 RESEARCH ASSUMPTIONS
    2.6 RISK ANALYSIS
 
3 EXECUTIVE SUMMARY (Page No. - 45)
    FIGURE 6 MILITARY BATTERY MARKET, BY TYPE, 2022 & 2027 (USD MILLION)
    FIGURE 7 MARKET, BY INSTALLATION, 2022 & 2027 (USD MILLION)
    FIGURE 8 MARKET, BY PLATFORM, 2022–2027 (USD MILLION)
    FIGURE 9 MARKET, BY PLATFORM, 2022–2027 (USD MILLION)
    FIGURE 10 NORTH AMERICA ESTIMATED TO LEAD MILITARY BATTERY MARKET IN 2022
 
4 PREMIUM INSIGHTS (Page No. - 49)
    4.1 ATTRACTIVE GROWTH OPPORTUNITIES IN MILITARY BATTERY INDUSTRY
           FIGURE 11 INCREASING DEMAND FOR FIGHTER AIRCRAFT IN MILITARY OPERATIONS EXPECTED TO DRIVE MILITARY BATTERY MARKET FROM 2022 TO 2027
    4.2 MILITARY BATTERY MARKET, BY INSTALLATION
           FIGURE 12 OEM SEGMENT ESTIMATED TO LEAD MARKET IN 2022
    4.3 MILITARY BATTERY INDUSTRY , BY POWER DENSITY
           FIGURE 13 LESS THAN 100 WH/KG SEGMENT PROJECTED LEAD MARKET FROM 2022 TO 2027
    4.4 MILITARY BATTERY MARKET, BY COMPOSITION
           FIGURE 14 LEAD-ACID SEGMENT PROJECTED TO LEAD MARKET FROM 2022 TO 2027
    4.5 MILITARY BATTERY INDUSTRY, BY APPLICATION
           FIGURE 15 NON-PROPULSION SEGMENT PROJECTED TO LEAD THE MARKET FROM 2022 TO 2027
    4.6 MILITARY BATTERY MARKET, BY COUNTRY
           FIGURE 16 CHINA PROJECTED TO REGISTER HIGHEST CAGR IN MILITARY BATTERY MARKET OUTLOOK FROM 2022 TO 2027
 
5 MARKET OVERVIEW (Page No. - 52)
    5.1 INTRODUCTION
    5.2 MARKET DYNAMICS
           FIGURE 17 MILITARY BATTERY MARKET ANALYSIS: DRIVERS, RESTRAINTS, OPPORTUNITIES, AND CHALLENGES
           5.2.1 DRIVERS
                    5.2.1.1 Rising adoption of ground vehicles and UAVs
                    5.2.1.2 Increased use of lightweight and high-power density batteries in sophisticated military systems
                    5.2.1.3 Rising military expenditure on new platforms
           5.2.2 RESTRAINTS
                    5.2.2.1 Regulations on lithium batteries
           5.2.3 OPPORTUNITIES
                    5.2.3.1 Advancements in material sciences and battery technology
                    5.2.3.2 Innovations in smart battery technology
                    5.2.3.3 Emerging markets in Southeast Asia
           5.2.4 CHALLENGES
                    5.2.4.1 Design challenges associated with manufacturing batteries
                    5.2.4.2 Recovery from pandemic
    5.3 AVERAGE PRICE ANALYSIS
           5.3.1 AVERAGE SELLING PRICE OF MILITARY BATTERIES
                    FIGURE 18 AVERAGE SELLING PRICES OF KEY PLAYERS
           5.3.2 AVERAGE SELLING PRICE OF MILITARY BATTERY TYPES
                    TABLE 2 AVERAGE SELLING PRICE TRENDS OF MILITARY BATTERIES, 2020 (USD MILLION)
    5.4 RANGES AND SCENARIOS
           FIGURE 19 COVID-19 IMPACT ON MILITARY BATTERY INDUSTRY: 3 GLOBAL SCENARIOS
    5.5 VALUE CHAIN ANALYSIS OF MARKET
           FIGURE 20 VALUE CHAIN ANALYSIS
    5.6 TRENDS/DISRUPTION IMPACTING CUSTOMER BUSINESS
           5.6.1 REVENUE SHIFT AND NEW REVENUE POCKETS FOR MILITARY BATTERY MANUFACTURERS
                    FIGURE 21 REVENUE SHIFT FOR MILITARY BATTERY MARKET PLAYERS
    5.7 MILITARY BATTERY MARKET ECOSYSTEM
           5.7.1 PROMINENT COMPANIES
           5.7.2 PRIVATE AND SMALL ENTERPRISES
           5.7.3 MARKET ECOSYSTEM
                    FIGURE 22 MARKET ECOSYSTEM MAP: MILITARY BATTERY INDUSTRY
                    TABLE 3 MARKET ECOSYSTEM
    5.8 TRADE DATA STATISTICS
           5.8.1 IMPORT DATA STATISTICS
                    TABLE 4 IMPORT VALUE OF LITHIUM-ION BATTERIES (PRODUCT HARMONIZED SYSTEM CODE: 850760) (USD THOUSAND)
           5.8.2 EXPORT DATA STATISTICS
                    TABLE 5 EXPORT VALUE OF LITHIUM-ION BATTERIES (PRODUCT HARMONIZED SYSTEM CODE: 850760) (USD THOUSAND)
    5.9 PORTER’S FIVE FORCES ANALYSIS
           TABLE 6 MILITARY BATTERY MARKET: PORTER’S FIVE FORCE ANALYSIS
           5.9.1 THREAT OF NEW ENTRANTS
           5.9.2 THREAT OF SUBSTITUTES
           5.9.3 BARGAINING POWER OF SUPPLIERS
           5.9.4 BARGAINING POWER OF BUYERS
           5.9.5 INTENSITY OF COMPETITIVE RIVALRY
    5.10 KEY STAKEHOLDERS & BUYING CRITERIA
           5.10.1 KEY STAKEHOLDERS IN BUYING PROCESS
                    FIGURE 23 INFLUENCE OF STAKEHOLDERS IN BUYING PROCESS FOR TOP 3 APPLICATIONS
                    TABLE 7 INFLUENCE OF STAKEHOLDERS IN BUYING PROCESS FOR TOP 3 APPLICATIONS (%)
           5.10.2 BUYING CRITERIA
                    FIGURE 24 KEY BUYING CRITERIA FOR TOP 3 APPLICATIONS
                    TABLE 8 KEY BUYING CRITERIA FOR TOP 3 APPLICATIONS
    5.11 KEY CONFERENCES & EVENTS IN 2022-2023
                    TABLE 9 AEROSTRUCTURES MARKET: DETAILED LIST OF CONFERENCES & EVENTS
           5.11.1 TARIFF AND REGULATORY LANDSCAPE
                    5.11.1.1 Regulatory bodies, government agencies, and other organizations
                               TABLE 10 NORTH AMERICA: LIST OF REGULATORY BODIES, GOVERNMENT AGENCIES, AND OTHER ORGANIZATIONS
                               TABLE 11 EUROPE: LIST OF REGULATORY BODIES, GOVERNMENT AGENCIES, AND OTHER ORGANIZATIONS
                               TABLE 12 ASIA PACIFIC: LIST OF REGULATORY BODIES, GOVERNMENT AGENCIES, SAND OTHER ORGANIZATIONS
    5.12 TARIFF AND REGULATORY LANDSCAPE
           5.12.1 NORTH AMERICA
           5.12.2 EUROPE
 
6 INDUSTRY TRENDS (Page No. - 72)
    6.1 INTRODUCTION
    6.2 TECHNOLOGY TRENDS
           FIGURE 25 TECHNOLOGY TRENDS IN MILITARY BATTERY MARKET
           6.2.1 WIRELESS CHARGING FOR DRONES
           6.2.2 CONFORMABLE WEARABLE BATTERIES
           6.2.3 ADVANCEMENTS IN LITHIUM-ION FILM TECHNOLOGY
           6.2.4 NEXT-GENERATION SOLID-STATE BATTERY TECHNOLOGY
           6.2.5 HYBRID BATTERIES
    6.3 TECHNOLOGY ANALYSIS
    6.4 USE CASE ANALYSIS
           6.4.1 SMALL TACTICAL UNIVERSAL BATTERY FOR HANDHELD MILITARY APPLICATIONS
           6.4.2 THALES’ STRATOBUS POWERED USING LIGHTWEIGHT LITHIUM METAL BATTERIES
    6.5 IMPACT OF MEGATRENDS
    6.6 INNOVATIONS AND PATENT REGISTRATIONS
 
7 MILITARY BATTERY MARKET, BY PLATFORM (Page No. - 78)
    7.1 INTRODUCTION
           FIGURE 26 BY PLATFORM, GROUND SEGMENT PROJECTED TO LEAD MARKET FROM 2022 TO 2027
           TABLE 13 MILITARY BATTERY MARKET, BY PLATFORM, 2018–2021 (USD MILLION)
           TABLE 14 MARKET, BY PLATFORM, 2022–2027 (USD MILLION)
    7.2 GROUND
           TABLE 15 GROUND: MARKET, BY TYPE, 2018–2021 (USD MILLION)
           TABLE 16 GROUND: MARKET, BY TYPE, 2022–2027 (USD MILLION)
           7.2.1 ARMORED VEHICLES
                    7.2.1.1 Growing demand for armored vehicles to drive segment
           7.2.2 OPERATING BASES
                    7.2.2.1 Communication equipment and electrification of equipment to drive segment
           7.2.3 SOLDIERS
                    7.2.3.1 Increasing adoption of advanced military wearables to drive segment
    7.3 AIRBORNE
           TABLE 17 AIRBORNE: MILITARY BATTERY MARKET ANALYSIS, BY TYPE, 2018–2021 (USD MILLION)
           TABLE 18 AIRBORNE: MILITARY BATTERY MARKET OUTLOOK, BY TYPE, 2022–2027 (USD MILLION)
           7.3.1 FIGHTER AIRCRAFT
                    7.3.1.1 Rising need to gain airborne dominance globally to drive market growth
           7.3.2 SPECIAL MISSION AIRCRAFT
                    7.3.2.1 Ability to carry heavy payloads and fly longer durations to drive market growth
           7.3.3 TRANSPORT AIRCRAFT
                    7.3.3.1 Increasing demand for transport aircraft across regions to drive market growth
           7.3.4 MILITARY HELICOPTERS
                    7.3.4.1 Increasing usage for ISR missions and rescue operations to drive demand
    7.4 MARINE
           TABLE 19 MARINE: MILITARY BATTERY MARKET, BY TYPE, 2018–2021 (USD MILLION)
           TABLE 20 MARINE: MARKET, BY TYPE, 2022–2027 (USD MILLION)
           7.4.1 DESTROYERS
                    7.4.1.1 Defense forces of several countries focusing on integrating electric propulsive destroyers into their fleet to gain high operational efficiency
           7.4.2 FRIGATES
                    7.4.2.1 Naval forces of various countries planning to install hybrid propulsion systems for frigates
           7.4.3 AMPHIBIOUS SHIPS
                    7.4.3.1 Amphibious warship development programs to drive segment
           7.4.4 SUBMARINES
                    7.4.4.1 Several countries currently using or developing electric propulsion systems for their submarine fleet
           7.4.5 OFFSHORE PATROL VESSELS
                    7.4.5.1 Growing adoption of Offshore Patrol Vessels (OPVs) for hybrid and electric propulsion setups
           7.4.6 CORVETTES
                    7.4.6.1 Replacing aging corvettes to drive segment
 
8 MILITARY BATTERY MARKET, BY COMPOSITION (Page No. - 86)
    8.1 INTRODUCTION
           FIGURE 27 BY COMPOSITION, LEAD-ACID SEGMENT TO COMMAND LARGEST MARKET SIZE DURING FORECAST PERIOD
           TABLE 21 MILITARY BATTERY MARKET SIZE, BY COMPOSITION, 2018–2021 (USD MILLION)
           TABLE 22 MILITARY BATTERYMARKET SIZE, BY COMPOSITION, 2022–2027 (USD MILLION)
    8.2 LITHIUM-BASED
           8.2.1 LITHIUM NICKEL MANGANESE COBALT OXIDE (LI-NMC)
                    8.2.1.1 Lithium nickel manganese cobalt oxide (LI-NMC) offers longer lifecycle at low cost
           8.2.2 LITHIUM IRON PHOSPHATE (LFP)
                    8.2.2.1 Lithium iron phosphate batteries are characterized by their safe operations
           8.2.3 LITHIUM COBALT OXIDE (LCO)
                    8.2.3.1 Demand for high capacity batteries drives segment’s growth
           8.2.4 LITHIUM TITANATE OXIDE (LTO)
                    8.2.4.1 Demand for fast-charging batteries drives segment’s growth
           8.2.5 LITHIUM MANGANESE OXIDE (LMO)
                    8.2.5.1 Growing preference for thermally stable batteries drives segment’s growth
           8.2.6 LITHIUM NICKEL COBALT ALUMINUM OXIDE (NCA)
                    8.2.6.1 High adoption in armored vehicles drives segment’s growth
    8.3 LEAD-ACID
           8.3.1 INCREASING NUMBER OF ARMORED VEHICLES AND AIRCRAFT TO DRIVE SEGMENT
    8.4 NICKEL-BASED
           8.4.1 GROWING POPULARITY OF STRATEGIC DRONES IN DEFENSE SECTOR TO FUEL DEMAND
    8.5 THERMAL
           8.5.1 INCREASING NUMBER OF ARMS AND AMMUNITION TO DRIVE SEGMENT
    8.6 OTHERS
 
9 MILITARY BATTERY MARKET, BY APPLICATION (Page No. - 91)
    9.1 INTRODUCTION
           FIGURE 28 BY APPLICATION, NON-PROPULSION SEGMENT PROJECTED TO LEAD MILITARY BATTERY MARKET DURING FORECAST PERIOD
           TABLE 23 MILITARY BATTERY MARKET SIZE, BY APPLICATION, 2018–2021 (USD MILLION)
           TABLE 24 MARKET SIZE, BY APPLICATION, 2022–2027 (USD MILLION)
    9.2 PROPULSION
           9.2.1 DEVELOPMENT OF ELECTRIC AIRCRAFT TO DRIVE MARKET GROWTH
    9.3 NON-PROPULSION
           9.3.1 REPLACEMENT OF ANALOG ELECTRONICS WITH DIGITAL SYSTEMS TO DRIVE MARKET GROWTH
 
10 MILITARY BATTERIES MARKET, BY TYPE (Page No. - 94)
     10.1 INTRODUCTION
               FIGURE 29 BY TYPE, RECHARGEABLE SEGMENT PROJECTED TO LEAD MARKET FROM 2022 TO 2027
               TABLE 25 MILITARY BATTERY MARKET, BY TYPE, 2018–2021 (USD MILLION)
               TABLE 26 MARKET, BY TYPE, 2022–2027 (USD MILLION)
     10.2 NON-RECHARGEABLE
             10.2.1 APPLICATION IN HIGH ENERGY DENSITY REQUIREMENTS TO DRIVE SEGMENT
             10.2.2 RESERVE
             10.2.3 PRIMARY
     10.3 RECHARGEABLE
             10.3.1 INCREASING NUMBER OF HANDHELD DEVICES FOR MILITARY APPLICATIONS TO DRIVE SEGMENT
 
11 MILITARY BATTERY MARKET, BY INSTALLATION (Page No. - 97)
     11.1 INTRODUCTION
               FIGURE 30 AFTERMARKET SEGMENT TO COMMAND LARGEST MARKET SIZE DURING FORECAST PERIOD
               TABLE 27 MILITARY BATTERY MARKET SIZE, BY INSTALLATION, 2018–2021 (USD MILLION)
               TABLE 28 MARKET SIZE, BY INSTALLATION, 2022–2027 (USD MILLION)
     11.2 OEM
             11.2.1 ELECTRIFICATION OF SYSTEMS AND CHANGING TECHNOLOGY TO DRIVE SEGMENT
     11.3 AFTERMARKET
             11.3.1 REPLACEMENT OF BATTERIES TO FUEL MARKET
 
12 MILITARY BATTERY MARKET, BY POWER DENSITY (Page No. - 100)
     12.1 INTRODUCTION
               FIGURE 31 BY POWER DENSITY, LESS THAN 100 WH/KG SEGMENT PROJECTED TO LEAD MARKET FROM 2022 TO 2027
               TABLE 29 MILITARY BATTERY MARKET, BY POWER DENSITY, 2018–2021 (USD MILLION)
               TABLE 30 MARKET, BY POWER DENSITY, 2022–2027 (USD MILLION)
     12.2 LESS THAN 100 WH/KG
             12.2.1 GROWING ADOPTION IN ARMORED VEHICLES AND OPERATING BASES
     12.3 100-200 WH/KG
             12.3.1 GROWING MODERNIZATION OF SOLDIER SYSTEMS USING 100 TO 200 WH/KG BATTERIES
     12.4 MORE THAN 200 WH/KG
             12.4.1 ADVENT OF ELECTRIC PROPULSION IN MILITARY PLATFORMS
 
13 MILITARY BATTERY MARKET, BY VOLTAGE (Page No. - 103)
     13.1 INTRODUCTION
               FIGURE 32 BY VOLTAGE, 12-24 V SEGMENT PROJECTED TO LEAD MARKET FROM 2022 TO 2027
               TABLE 31 MARKET, BY VOLTAGE, 2018–2021 (USD MILLION)
               TABLE 32 MARKET, BY VOLTAGE, 2022–2027 (USD MILLION)
     13.2 LESS THAN 12 V
             13.2.1 RISING DEMAND FOR BETTER COMMUNICATION NETWORKS TO DRIVE SEGMENT
     13.3 12-24 V
             13.3.1 INCREASING NUMBER OF UNMANNED SOLUTIONS TO DRIVE SEGMENT
     13.4 MORE THAN 24 V
             13.4.1 INCREASING NUMBER OF MILITARY BASES TO DRIVE SEGMENT
 
14 REGIONAL ANALYSIS (Page No. - 106)
     14.1 INTRODUCTION
               FIGURE 33 MILITARY BATTERY MARKET IN ASIA PACIFIC PROJECTED TO GROW AT HIGHEST RATE FROM 2022 TO 2027
               TABLE 33 MILITARY BATTERY INDUSTRY, BY PLATFORM, 2018–2021 (USD MILLION)
               TABLE 34 MILITARY BATTERY MARKET SHARE, BY PLATFORM, 2022–2027 (USD MILLION)
               TABLE 35 MILITARY BATTERY MARKET SIZE, BY COMPOSITION, 2018–2021 (USD MILLION)
               TABLE 36 MARKET, BY COMPOSITION, 2022–2027 (USD MILLION)
               TABLE 37 MARKET, BY TYPE, 2018–2021 (USD MILLION)
               TABLE 38 MARKET, BY TYPE, 2022–2027 (USD MILLION)
               TABLE 39 MARKET, BY INSTALLATION, 2018–2021 (USD MILLION)
               TABLE 40 MARKET, BY INSTALLATION, 2022–2027 (USD MILLION)
               TABLE 41 MARKET, BY POWER DENSITY, 2018–2021 (USD MILLION)
               TABLE 42 MARKET, BY POWER DENSITY, 2022–2027 (USD MILLION)
               TABLE 43 MARKET, BY VOLTAGE, 2018–2021 (USD MILLION)
               TABLE 44 MARKET, BY VOLTAGE, 2022–2027 (USD MILLION)
               TABLE 45 MARKET, BY REGION, 2018–2021 (USD MILLION)
               TABLE 46 MARKET, BY REGION, 2022–2027 (USD MILLION)
     14.2 NORTH AMERICA
             14.2.1 PESTLE ANALYSIS: NORTH AMERICA
                       FIGURE 34 NORTH AMERICA MILITARY BATTERY MARKET SNAPSHOT
                       TABLE 47 NORTH AMERICA: MARKET, BY PLATFORM, 2018–2021 (USD MILLION)
                       TABLE 48 NORTH AMERICA: MARKET, BY PLATFORM, 2022–2027 (USD MILLION)
                       TABLE 49 NORTH AMERICA: MARKET, BY VOLTAGE, 2018–2021 (USD MILLION)
                       TABLE 50 NORTH AMERICA: MARKET, BY VOLTAGE,  2022–2027 (USD MILLION)
                       TABLE 51 NORTH AMERICA: MARKET, BY COUNTRY,  2018–2021 (USD MILLION)
                       TABLE 52 NORTH AMERICA: MARKET, BY COUNTRY, 2022–2027 (USD MILLION)
             14.2.2 US
                       14.2.2.1 Increased spending on innovative technologies by US defense organizations and private players to fuel market growth
                                   TABLE 53 US: MILITARY BATTERY MARKET, BY PLATFORM, 2018–2021 (USD MILLION)
                                   TABLE 54 US: MARKET, BY PLATFORM, 2022–2027 (USD MILLION)
                                   TABLE 55 US: MARKET, BY VOLTAGE, 2018–2021 (USD MILLION)
                                   TABLE 56 US: MARKET, BY VOLTAGE, 2022–2027 (USD MILLION)
             14.2.3 CANADA
                       14.2.3.1 Increasing military procurements and growing demand for UAVs drive market
                                   TABLE 57 CANADA: MILITARY BATTERY MARKET, BY PLATFORM, 2018–2021 (USD MILLION)
                                   TABLE 58 CANADA: MARKET, BY PLATFORM, 2022–2027 (USD MILLION)
                                   TABLE 59 CANADA: MARKET, BY VOLTAGE, 2018–2021 (USD MILLION)
                                   TABLE 60 CANADA: MARKET, BY VOLTAGE,  2022–2027 (USD MILLION)
     14.3 EUROPE
             14.3.1 PESTLE ANALYSIS: EUROPE
                       FIGURE 35 EUROPE MILITARY BATTERY MARKET SNAPSHOT
                       TABLE 61 EUROPE: MARKET, BY PLATFORM, 2018–2021 (USD MILLION)
                       TABLE 62 EUROPE: MARKET, BY PLATFORM, 2022–2027 (USD MILLION)
                       TABLE 63 EUROPE: MARKET, BY VOLTAGE, 2018–2021 (USD MILLION)
                       TABLE 64 EUROPE: MARKET, BY VOLTAGE, 2022–2027 (USD MILLION)
                       TABLE 65 EUROPE: MARKET, BY COUNTRY, 2018–2021 (USD MILLION)
                       TABLE 66 EUROPE: MARKET, BY COUNTRY, 2022–2027 (USD MILLION)
             14.3.2 UK
                       14.3.2.1 Procurement of new airborne platforms including UAVs, helicopters, and aircraft to drive market
                                   TABLE 67 UK: MILITARY BATTERY MARKET, BY PLATFORM, 2018–2021 (USD MILLION)
                                   TABLE 68 UK: MARKET, BY PLATFORM, 2022–2027 (USD MILLION)
                                   TABLE 69 UK: MARKET, BY VOLTAGE, 2018–2021 (USD MILLION)
                                   TABLE 70 UK: MARKET, BY VOLTAGE, 2022–2027 (USD MILLION)
             14.3.3 FRANCE
                       14.3.3.1 Increased military spending and aerospace sector fuel market growth
                                   TABLE 71 FRANCE: MARKET, BY PLATFORM, 2018–2021 (USD MILLION)
                                   TABLE 72 FRANCE: MARKET, BY PLATFORM, 2022–2027 (USD MILLION)
                                   TABLE 73 FRANCE: MARKET, BY VOLTAGE, 2018–2021 (USD MILLION)
                                   TABLE 74 FRANCE: MARKET, BY VOLTAGE, 2022–2027 (USD MILLION)
             14.3.4 GERMANY
                       14.3.4.1 Investments in UGVs to develop multifunctional and technologically advanced land or ground robots
                                   TABLE 75 GERMANY: MILITARY BATTERY MARKET, BY PLATFORM, 2018–2021 (USD MILLION)
                                   TABLE 76 GERMANY: MARKET, BY PLATFORM, 2022–2027 (USD MILLION)
                                   TABLE 77 GERMANY: MARKET, BY VOLTAGE, 2018–2021 (USD MILLION)
                                   TABLE 78 GERMANY: MARKET, BY VOLTAGE, 2022–2027 (USD MILLION)
             14.3.5 RUSSIA
                       14.3.5.1 Rising geopolitical tensions and increasing military expenditure to propel market growth
                                   TABLE 79 RUSSIA: MARKET, BY PLATFORM, 2018–2021 (USD MILLION)
                                   TABLE 80 RUSSIA: MARKET, BY PLATFORM, 2022–2027 (USD MILLION)
                                   TABLE 81 RUSSIA: MARKET, BY VOLTAGE, 2018–2021 (USD MILLION)
                                   TABLE 82 RUSSIA: MARKET, BY VOLTAGE, 2022–2027 (USD MILLION)
             14.3.6 ITALY
                       14.3.6.1 Rising demand for drones and UAVs to drive market
                                   TABLE 83 ITALY: MILITARY BATTERY MARKET, BY PLATFORM, 2018–2021 (USD MILLION)
                                   TABLE 84 ITALY: MARKET, BY PLATFORM, 2022–2027 (USD MILLION)
                                   TABLE 85 ITALY: MARKET, BY VOLTAGE, 2018–2021 (USD MILLION)
                                   TABLE 86 ITALY: MARKET, BY VOLTAGE, 2022–2027 (USD MILLION)
             14.3.7 REST OF EUROPE
                       14.3.7.1 Rising border conflicts to fuel market growth
                                   TABLE 87 REST OF EUROPE: MARKET, BY PLATFORM, 2018–2021 (USD MILLION)
                                   TABLE 88 REST OF EUROPE: MARKET, BY PLATFORM, 2022–2027 (USD MILLION)
                                   TABLE 89 REST OF EUROPE: MARKET, BY VOLTAGE, 2018–2021 (USD MILLION)
                                   TABLE 90 REST OF EUROPE: MARKET, BY VOLTAGE, 2022–2027 (USD MILLION)
     14.4 ASIA PACIFIC
             14.4.1 PESTLE ANALYSIS: ASIA PACIFIC
                       FIGURE 36 ASIA PACIFIC MILITARY BATTERY MARKET SNAPSHOT
                       TABLE 91 ASIA PACIFIC: MARKET, BY PLATFORM, 2018–2021 (USD MILLION)
                       TABLE 92 ASIA PACIFIC: MARKET, BY PLATFORM, 2022–2027 (USD MILLION)
                       TABLE 93 ASIA PACIFIC: MARKET, BY VOLTAGE, 2018–2021 (USD MILLION)
                       TABLE 94 ASIA PACIFIC: MARKET, BY VOLTAGE, 2022–2027 (USD MILLION)
                       TABLE 95 ASIA PACIFIC: MARKET, BY COUNTRY, 2018–2021 (USD MILLION)
                       TABLE 96 ASIA PACIFIC: MARKET, BY COUNTRY, 2022–2027 (USD MILLION)
             14.4.2 CHINA
                       14.4.2.1 Presence of major drone manufacturing companies to boost market growth
                                   TABLE 97 CHINA: MILITARY BATTERY MARKET, BY PLATFORM, 2018–2021 (USD MILLION)
                                   TABLE 98 CHINA: MARKET, BY PLATFORM, 2022–2027 (USD MILLION)
                                   TABLE 99 CHINA: MARKET, BY VOLTAGE, 2018–2021 (USD MILLION)
                                   TABLE 100 CHINA: MARKET, BY VOLTAGE, 2022–2027 (USD MILLION)
             14.4.3 INDIA
                       14.4.3.1 In-house development of military equipment to drive market growth
                                   TABLE 101 INDIA: MARKET, BY PLATFORM, 2018–2021 (USD MILLION)
                                   TABLE 102 INDIA: MARKET, BY PLATFORM, 2022–2027 (USD MILLION)
                                   TABLE 103 INDIA: MARKET, BY VOLTAGE, 2018–2021 (USD MILLION)
                                   TABLE 104 INDIA: MARKET, BY VOLTAGE, 2022–2027 (USD MILLION)
             14.4.4 JAPAN
                       14.4.4.1 Technological advancements and significant defense budget to drive market
                                   TABLE 105 JAPAN: MILITARY BATTERY MARKET, BY PLATFORM, 2018–2021 (USD MILLION)
                                   TABLE 106 JAPAN: MARKET, BY PLATFORM, 2022–2027 (USD MILLION)
                                   TABLE 107 JAPAN: MARKET, BY VOLTAGE, 2018–2021 (USD MILLION)
                                   TABLE 108 JAPAN: MARKET, BY VOLTAGE, 2022–2027 (USD MILLION)
             14.4.5 SOUTH KOREA
                       14.4.5.1 Increased spending by armed forces on UAVs to drive market
                                   TABLE 109 SOUTH KOREA: MARKET, BY PLATFORM, 2018–2021 (USD MILLION)
                                   TABLE 110 SOUTH KOREA: MARKET, BY PLATFORM, 2022–2027 (USD MILLION)
                                   TABLE 111 SOUTH KOREA: MARKET, BY VOLTAGE, 2018–2021 (USD MILLION)
                                   TABLE 112 SOUTH KOREA: MARKET, BY VOLTAGE, 2022–2027 (USD MILLION)
             14.4.6 AUSTRALIA
                       14.4.6.1 Increasing modernization of combat fleets drives market growth
                                   TABLE 113 AUSTRALIA: MILITARY BATTERY MARKET, BY PLATFORM, 2018–2021 (USD MILLION)
                                   TABLE 114 AUSTRALIA: MARKET, BY PLATFORM, 2022–2027 (USD MILLION)
                                   TABLE 115 AUSTRALIA: MARKET, BY VOLTAGE, 2018–2021 (USD MILLION)
                                   TABLE 116 AUSTRALIA: MARKET, BY VOLTAGE, 2022–2027 (USD MILLION)
             14.4.7 REST OF ASIA PACIFIC
                       TABLE 117 REST OF ASIA PACIFIC: MARKET, BY PLATFORM, 2018–2021 (USD MILLION)
                       TABLE 118 REST OF ASIA PACIFIC: MARKET, BY PLATFORM, 2022–2027 (USD MILLION)
                       TABLE 119 REST OF ASIA PACIFIC: MARKET, BY VOLTAGE, 2018–2021 (USD MILLION)
                       TABLE 120 REST OF ASIA PACIFIC: MILITARY BATTERY MARKET, BY VOLTAGE, 2022–2027 (USD MILLION)
     14.5 MIDDLE EAST
             14.5.1 PESTLE ANALYSIS: MIDDLE EAST
                       FIGURE 37 MIDDLE EAST MILITARY BATTERY MARKET SNAPSHOT
                       TABLE 121 MIDDLE EAST: MARKET, BY PLATFORM, 2018–2021 (USD MILLION)
                       TABLE 122 MIDDLE EAST: MARKET, BY PLATFORM, 2022–2027 (USD MILLION)
                       TABLE 123 MIDDLE EAST: MARKET, BY VOLTAGE, 2018–2021 (USD MILLION)
                       TABLE 124 MIDDLE EAST: MARKET, BY VOLTAGE, 2022–2027 (USD MILLION)
                       TABLE 125 MIDDLE EAST: MARKET, BY COUNTRY, 2018–2021 (USD MILLION)
                       TABLE 126 MIDDLE EAST: MARKET, BY COUNTRY, 2022–2027 (USD MILLION)
             14.5.2 SAUDI ARABIA
                       14.5.2.1 High military expenditure to drive market growth
                                   TABLE 127 SAUDI ARABIA: MILITARY BATTERY MARKET, BY PLATFORM, 2018–2021 (USD MILLION)
                                   TABLE 128 SAUDI ARABIA: MARKET, BY PLATFORM, 2022–2027 (USD MILLION)
                                   TABLE 129 SAUDI ARABIA: MARKET, BY VOLTAGE, 2018–2021 (USD MILLION)
                                   TABLE 130 SAUDI ARABIA: MARKET, BY VOLTAGE, 2022–2027 (USD MILLION)
             14.5.3 ISRAEL
                       14.5.3.1 Increase spending on R&D of drones to drive market growth
                                   TABLE 131 ISRAEL: MARKET, BY PLATFORM,  2018–2021 (USD MILLION)
                                   TABLE 132 ISRAEL: MARKET, BY PLATFORM, 2022–2027 (USD MILLION)
                                   TABLE 133 ISRAEL: MARKET, BY VOLTAGE, 2018–2021 (USD MILLION)
                                   TABLE 134 ISRAEL: MARKET, BY VOLTAGE, 2022–2027 (USD MILLION)
             14.5.4 UAE
                       14.5.4.1 Tensions in neighboring states to drive market growth
             14.5.5 REST OF MIDDLE EAST
                       TABLE 135 REST OF MIDDLE EAST: MILITARY BATTERY MARKET, BY PLATFORM, 2018–2021 (USD MILLION)
                       TABLE 136 REST OF MIDDLE EAST: MARKET, BY PLATFORM, 2022–2027 (USD MILLION)
                       TABLE 137 REST OF MIDDLE EAST: MARKET, BY VOLTAGE, 2018–2021 (USD MILLION)
                       TABLE 138 REST OF MIDDLE EAST: MARKET, BY VOLTAGE, 2022–2027 (USD MILLION)
     14.6 REST OF THE WORLD
             14.6.1 PESTLE ANALYSIS: REST OF THE WORLD
                       TABLE 139 REST OF THE WORLD: MILITARY BATTERY MARKET, BY PLATFORM,  2018–2021 (USD MILLION)
                       TABLE 140 REST OF THE WORLD: MARKET, BY PLATFORM, 2022–2027 (USD MILLION)
                       TABLE 141 REST OF THE WORLD: MARKET, BY VOLTAGE, 2018–2021 (USD MILLION)
                       TABLE 142 REST OF THE WORLD: MARKET, BY VOLTAGE,  2022–2027 (USD MILLION)
                       TABLE 143 REST OF THE WORLD: MARKET, BY REGION,  2018–2021 (USD MILLION)
                       TABLE 144 REST OF THE WORLD: MARKET, BY REGION,  2022–2027 (USD MILLION)
             14.6.2 LATIN AMERICA
                       14.6.2.1 Increase demand for military unmanned vehicles to drive market
                                   TABLE 145 LATIN AMERICA: MILITARY BATTERY MARKET, BY PLATFORM,  2018–2021 (USD MILLION)
                                   TABLE 146 LATIN AMERICA: MARKET, BY PLATFORM, 2022–2027 (USD MILLION)
                                   TABLE 147 LATIN AMERICA: MARKET, BY VOLTAGE, 2018–2021 (USD MILLION)
                                   TABLE 148 LATIN AMERICA: MARKET, BY VOLTAGE, 2022–2027 (USD MILLION)
             14.6.3 AFRICA
                       14.6.3.1 Focus on securing borders and improving military capabilities to drive market
                                   TABLE 149 AFRICA: MILITARY BATTERY MARKET, BY PLATFORM, 2018–2021 (USD MILLION)
                                   TABLE 150 AFRICA: MARKET, BY PLATFORM, 2022–2027 (USD MILLION)
                                   TABLE 151 AFRICA: MARKET, BY VOLTAGE, 2018–2021 (USD MILLION)
                                   TABLE 152 AFRICA: MARKET, BY VOLTAGE, 2022–2027 (USD MILLION)
 
15 COMPETITIVE LANDSCAPE (Page No. - 152)
     15.1 INTRODUCTION 
             15.1.1 COMPETITIVE OVERVIEW
                        TABLE 153 KEY DEVELOPMENTS BY LEADING PLAYERS IN MILITARY BATTERY MARKET BETWEEN 2018 AND 2021
                        FIGURE 38 MARKET EVALUATION FRAMEWORK: ACQUISITION IS KEY STRATEGY ADOPTED BY MARKET PLAYERS
     15.2 MARKET RANKING ANALYSIS OF KEY PLAYERS, 2020 
             FIGURE 39 RANKING ANALYSIS OF TOP 5 PLAYERS: MILITARY BATTERY MARKET, 2020
             FIGURE 40 MARKET SHARE OF KEY PLAYERS, 2020
             FIGURE 41 REVENUE ANALYSIS OF TOP 5 MARKET PLAYERS, 2020
     15.3 COMPANY PRODUCT FOOTPRINT ANALYSIS 
             TABLE 154 COMPANY PRODUCT FOOTPRINT
             TABLE 155 COMPANY REGION FOOTPRINT
     15.4 COMPANY EVALUATION QUADRANT 
             15.4.1 STAR
             15.4.2 EMERGING LEADER
             15.4.3 PERVASIVE
             15.4.4 PARTICIPANT
                        FIGURE 42 MARKET COMPETITIVE LEADERSHIP MAPPING, 2020
     15.5 START-UP/SME EVALUATION QUADRANT 
             15.5.1 PROGRESSIVE COMPANY
             15.5.2 RESPONSIVE COMPANY
             15.5.3 STARTING BLOCK
             15.5.4 DYNAMIC COMPANY
                        FIGURE 43 MILITARY BATTERY MARKET (STARTUP) COMPETITIVE LEADERSHIP MAPPING, 2020
     15.6 COMPETITIVE BENCHMARKING 
             15.6.1 MILITARY BATTERY MARKET: DETAILED LIST OF KEY STARTUP/SMES
             15.6.2 MILITARY BATTERY MARKET: COMPETITIVE BENCHMARKING OF KEY PLAYERS [STARTUPS/SMES]
     15.7 COMPETITIVE SCENARIO 
             15.7.1 MARKET EVALUATION FRAMEWORK
             15.7.2 PRODUCT LAUNCHES AND DEVELOPMENTS
                        TABLE 156 PRODUCT LAUNCHES AND DEVELOPMENTS, 2018–2021
             15.7.3 DEALS
                        TABLE 157 DEALS, 2018–2021
             15.7.4 OTHER DEALS
                        TABLE 158 OTHER DEALS, 2018–2021
 
16 COMPANY PROFILES: KEY PLAYERS (Page No. - 166)
     16.1 INTRODUCTION 
(Business overview, Products/Solutions/Services offered, Recent Developments, MnM view, Key strengths and right to win, Weaknesses and competitive threats)*      
     16.2 KEY PLAYERS 
             16.2.1 ENERSYS
                        TABLE 159 ENERSYS: BUSINESS OVERVIEW
                        FIGURE 44 ENERSYS: COMPANY SNAPSHOT
                        TABLE 160 ENERSYS: DEALS
                        TABLE 161 ENERSYS: PRODUCT LAUNCH
                        TABLE 162 ENERSYS: OTHERS
             16.2.2 BAE SYSTEMS PLC
                        TABLE 163 BAE SYSTEMS PLC: BUSINESS OVERVIEW
                        FIGURE 45 BAE SYSTEMS PLC: COMPANY SNAPSHOT
             16.2.3 GS YUASA INTERNATIONAL LTD
                        TABLE 164 GS YUASA INTERNATIONAL LTD: BUSINESS OVERVIEW
                        FIGURE 46 GS YUASA INTERNATIONAL LTD: COMPANY SNAPSHOT
                        TABLE 165 GS YUASA INTERNATIONAL LTD: DEALS
             16.2.4 SAFT (TOTAL)
                        TABLE 166 SAFT: BUSINESS OVERVIEW
                        FIGURE 47 SAFT (TOTAL): COMPANY SNAPSHOT
                        TABLE 167 SAFT (TOTAL): DEALS
             16.2.5 EXIDE TECHNOLOGIES
                        TABLE 168 EXIDE TECHNOLOGIES: BUSINESS OVERVIEW
                        TABLE 169 EXIDE TECHNOLOGIES: PRODUCT LAUNCH
                        TABLE 170 EXIDE TECHNOLOGIES: DEALS
             16.2.6 EXIDE INDUSTRIES
                        TABLE 171 EXIDE INDUSTRIES: BUSINESS OVERVIEW
                        FIGURE 48 EXIDE INDUSTRIES: COMPANY SNAPSHOT
                        TABLE 172 EXIDE INDUSTRIES: OTHERS
             16.2.7 ULTRALIFE CORPORATION
                        TABLE 173 ULTRALIFE CORPORATION: BUSINESS OVERVIEW
                        FIGURE 49 ULTRALIFE CORPORATION: COMPANY SNAPSHOT
                        TABLE 174 ULTRALIFE CORPORATION: DEALS
             16.2.8 AROTECH CORPORATION
                        TABLE 175 AROTECH CORPORATION: BUSINESS OVERVIEW
                        TABLE 176 AROTECH CORPORATION: DEALS
             16.2.9 BREN-TRONICS
                        TABLE 177 BREN-TRONICS: BUSINESS OVERVIEW
                        TABLE 178 BREN-TRONICS: DEALS
             16.2.10 EAGLEPICHER TECHNOLOGIES
                        TABLE 179 EAGLEPICHER TECHNOLOGIES: BUSINESS OVERVIEW
                        TABLE 180 EAGLEPICHER TECHNOLOGIES: DEALS
             16.2.11 BST SYSTEMS, INC.
                        TABLE 181 BST SYSTEMS, INC: BUSINESS OVERVIEW
                        TABLE 182 BST SYSTEMS, INC: DEALS
             16.2.12 CONCORDE
                        TABLE 183 CONCORDE: BUSINESS OVERVIEW
                        TABLE 184 CONCORDE: DEALS
             16.2.13 LINCAD
                        TABLE 185 LINCAD: BUSINESS OVERVIEW
                        TABLE 186 LINCAD: DEALS
             16.2.14 KOREA SPECIAL BATTERY CO., LTD.
                        TABLE 187 KOREA SPECIAL BATTERY CO., LTD.: BUSINESS OVERVIEW
             16.2.15 ECOBAT BATTERY TECHNOLOGIES
                        TABLE 188 ECOBAT BATTERY TECHNOLOGIES: BUSINESS OVERVIEW
*Details on Business overview, Products/Solutions/Services offered, Recent Developments, MnM view, Key strengths and right to win, Strategic choices, Weaknesses and competitive threats might not be captured in case of unlisted companies.  
     16.3 OTHER PLAYERS 
             16.3.1 DENCHI POWER
             16.3.2 KOKAM
             16.3.3 MATHEW ASSOCIATES
             16.3.4 NAVITAS SYSTEMS
             16.3.5 TELEDYNE TECHNOLOGIES
             16.3.6 CELL-CON
             16.3.7 LECLANCHE SA
             16.3.8 STERLING PLANB ENERGY SOLUTIONS
             16.3.9 SION POWER
             16.3.10 LIFELINE BATTERIES
 
17 APPENDIX (Page No. - 206)
     17.1 DISCUSSION GUIDE 
     17.2 KNOWLEDGE STORE: MARKETSANDMARKETS’ SUBSCRIPTION PORTAL 
     17.3 AVAILABLE CUSTOMIZATIONS 
     17.4 RELATED REPORTS 
     17.5 AUTHOR DETAILS 
 

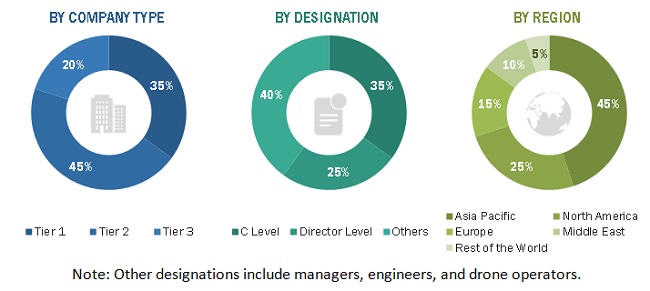
This research study involved the extensive use of secondary sources, directories, and databases, such as D&B Hoovers, Bloomberg Businessweek, and Factiva to identify and collect information relevant to the military battery market. Primary sources included industry experts from the core and related industries as well as preferred suppliers, manufacturers, solution providers, technology developers, alliances, and organizations related to all the segments of this industry’s value chain. All primary sources were interviewed to obtain and verify critical qualitative and quantitative information as well as to assess prospects for the growth of the market during the forecast period.

Secondary Research:

The share of companies in the military battery market was determined using secondary data made available through paid and unpaid sources and by analyzing their product portfolios. The companies were rated based on the performance and quality of their products. These data points were further validated by primary sources.

Secondary sources that were referred to for this research study on the military battery market included financial statements of companies offering and developing military battery products and solutions and information from various trade, business, and professional associations, among others. Secondary data was collected and analyzed to arrive at the overall size of the military battery market, which was further validated by primary respondents.

Primary Research:

Extensive primary research was conducted after obtaining information about the current scenario of the military battery market through secondary research. Several primary interviews were conducted with market experts from both, the demand- and supply-side across 5 major regions, namely, North America, Europe, Asia Pacific, Latin America and the Middle East and Africa. This primary data was collected through questionnaires, mails, and telephonic interviews.
Military Battery Market Size, and Share

To know about the assumptions considered for the study, download the pdf brochure

Market Size Estimation

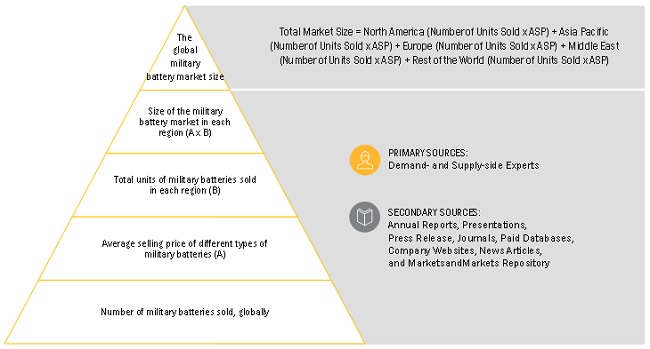
Both, the top-down and bottom-up approaches were used to estimate and validate the size of the military battery market.

The research methodology that was used to estimate the size of the military battery market includes the following details.

Key players in the military battery market were identified through secondary research, and their market share was determined through primary and secondary research. This included a study of the annual and financial reports of the top market players and extensive interviews of leaders such as chief executive officers, directors, and marketing executives of the leading companies operating in the military battery market.

All percentage shares, splits, and breakdowns were determined using secondary sources and were verified through primary sources. All possible parameters that affect the markets covered in this research study were accounted for, viewed in extensive detail, verified through primary research, and analyzed to obtain the final quantitative and qualitative data on the military battery market. This data was consolidated, enhanced with detailed inputs, analyzed by MarketsandMarkets, and presented in this report.

Market size estimation methodology: Bottom-up approach
Military Battery Market Size, and Share

To know about the assumptions considered for the study, Request for Free Sample Report

Data Triangulation

After arriving at the overall size of the military battery market from the market size estimation process explained above, the total market has been split into several segments and subsegments. The data triangulation and market breakdown procedures explained below have been implemented, wherever applicable, to complete the overall market engineering process and arrive at the exact statistics for various market segments and subsegments. The data was triangulated by studying various factors and trends from both the demand and supply sides. Along with this, the market size was validated using both, top-down and bottom-up approaches.

Objectives of the Study

  • To define, describe, segment, and forecast the size of the military battery market based on platform, type, application, composition, installation, voltage, power density, and region for the forecast period from 2022 to 2027
  • To forecast the size of various segments of the market with respect to five major regions, namely, North America, Europe, Asia Pacific, the Middle East, and the Rest of the World (RoW), along with the major countries in each of these regions
  • To identify and analyze the key drivers, restraints, opportunities, and challenges influencing the growth of the market
  • To identify opportunities for stakeholders in the market by studying key market and technology trends
  • To analyze competitive developments such as contracts, agreements, acquisitions & partnerships, new product launches & developments, and R&D activities in the market
  • To estimate the procurement of military batteries by different countries to track the market size of military batteries
  • To provide a comprehensive competitive landscape of the market along with an overview of the different strategies adopted by key players to strengthen their position in the market
  • To identify transportation industry trends, market trends, and technology trends currently prevailing in the market
  • To analyze micromarkets1 with respect to individual technological trends and their contribution to the total market
  • To analyze opportunities in the market for stakeholders by identifying key market trends
  • To profile key market players and comprehensively analyze their market share and core competencies2
  • To provide a detailed competitive landscape of the market, along with an analysis of business and strategies such as mergers & acquisitions, partnerships, agreements, and product developments in the military battery market
  • To identify detailed financial positions, key products, and unique selling points of leading companies in the market

Available Customizations:

Along with market data, MarketsandMarkets offers customizations as per the specific needs of a company. The following customization options are available for the report:

Company Information

  • Detailed analysis and profiling of additional market players (up to 5)
  • Market analysis of additional countries (subject to the data availability)
Custom Market Research Services

We will customize the research for you, in case the report listed above does not meet with your exact requirements. Our custom research will comprehensively cover the business information you require to help you arrive at strategic and profitable business decisions.

Request Customization

Instant Answers with GPT - Ask Now!

Ask real questions. Get complete answers !
Report Code
AS 6434
Published ON
May, 2022
Choose License Type
BUY NOW
  • SHARE
X
Request Customization
Speak to Analyst
Speak to Analyst
OR FACE-TO-FACE MEETING
PERSONALIZE THIS RESEARCH
  • Triangulate with your Own Data
  • Get Data as per your Format and Definition
  • Gain a Deeper Dive on a Specific Application, Geography, Customer or Competitor
  • Any level of Personalization
REQUEST A FREE CUSTOMIZATION
LET US HELP YOU!
  • What are the Known and Unknown Adjacencies Impacting the Military Battery Market
  • What will your New Revenue Sources be?
  • Who will be your Top Customer; what will make them switch?
  • Defend your Market Share or Win Competitors
  • Get a Scorecard for Target Partners
CUSTOMIZED WORKSHOP REQUEST
+1-888-600-6441
  • Call Us
  • +1-888-600-6441 (Corporate office hours)
  • +1-888-600-6441 (US/Can toll free)
  • +44-800-368-9399 (UK office hours)
CONNECT WITH US
ABOUT TRUST ONLINE
©2024 MarketsandMarkets Research Private Ltd. All rights reserved
DMCA.com Protection Status Website Feedback