Military Lighting Market

Military Lighting Market by Product (LED, Non-LED), Type (Internal Lighting, External Lighting, Others), End Use (Ground, Marine, Airborne), and Region - Global Forecast to 2027

Report Code: AS 6529 Aug, 2022, by marketsandmarkets.com

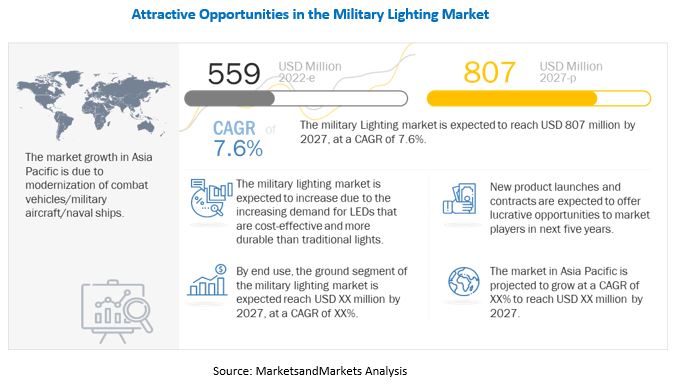
[203 Pages Report] The military lighting market is projected to grow from USD 559 million in 2022 to USD 807 million by 2027, at a CAGR of 7.6% from 2022 to 2027.

Military lighting products include the ones installed in military shelters, military airports/airfields, and soldier lights, such as combat helmet lighting. Lights in military shelters generally consist of gooseneck and task/drop lights. The number of lights installed depends on the shelter type, and, generally, hard shelters have double the number of lights of soft shelters as the accommodation capacity for hard shelters is double that of soft shelters.

Airport lights are used to guide aircraft during take-off and landing. In the early 1990s, lighting was developed for runway edges and then taxiway edges. It expanded to centerline lighting, touchdown zone lighting, and approach light systems. Taxiway guidance signage became illuminated, and runway guard light systems were established.

Lights used in military airports can be segmented based on type and position. Runway lighting systems, taxiway light systems, EALS, and apron lights are the various forms of lights considered under types. Whereas the categories of light by position include in-pavement/inset lights, elevated airfields, and precision approach path indicator (PAPI). Armed forces also use solar LED helipads to improve the operational efficiency of their systems.

Various players such as Astronics Corp. (US), Honeywell International (US), Raytheon Technologies (US), Glamox (Norway), and Orion Energy Systems (US) among others, are prominent players operating in the military lighting market.
Military Lighting Market

To know about the assumptions considered for the study, Request for Free Sample Report

Military lighting Market Dynamics:

Driver: Modernization and upgrade of military vehicles, aircraft, naval ships

Governments around the world are investing heavily in modernizing their armed forces in terms of weapon capabilities and equipment. Most countries are focusing on modernizing the helmet lighting systems of their soldiers along with the lighting systems of armored vehicles. The improved lighting systems would be better suited for covert operations and would be equipped with night vision capabilities. This requirement of line fitting and retrofitting advanced LEDs in naval, airborne, and ground applications is expected to drive the military lighting industry across the globe. In June 2020, Orion Energy Systems received a contract worth USD 1.3 million from the US government for a retrofit project.

Restraint: Short-to-medium-term impact on lighting component supply due to US–China trade conflict

The US-China trade conflict started in March 2018. Being the two largest economic powers in world, the trade conflict between these two countries has substantially transformed the trading dynamics across globe, specifically in the defense electronics vertical, as China is one of the largest producers of electronics whereas the US is the largest consumer of the same. Thus, the profitability of several lighting product manufacturers across globe have been influenced negatively. Though the effect of this trade conflict between the US and China is short-to-medium term, it has more widespread effect on other developing economies, including Brazil, Indonesia, and India.

Opportunity: Compatibilityof LEDs with military, navy, air force operations

The high cost incurred on the development of radar systems is one of the major factors hindering the growth of the radar systems market and thus, affecting the military lightings market. Since radar is one of Low temperatures present a challenge to fluorescent lamps and can affect their operation; LEDs are ideal for operations in low-temperature settings. LEDs operate well in cold settings such as outdoor winter settings, freezer rooms, and grocery store coolers. Temperature ranges can be below zero degrees Fahrenheit to over 100 degrees Fahrenheit. Also, LEDs can be combined in any shape to produce highly efficient illumination. Individual LEDs can be dimmed, resulting in dynamic control of light, color, and distribution. These functionalities of LEDs offer an opportunity for the military lighting market to grow.

Challenges: Existing defense backlog

Boeing (US) and Airbus (France) constitute the largest market share of military orders among all other manufacturers. These companies receive the greatest number of military orders; however, their manufacturing capacities are limited, thereby creating a large backlog of military deliveries. Due to COVID-19, 2020 was a very challenging year, and 2021 was the year of recovery for these companies.

Military lighting Market Ecosystem:

The key stakeholders in the military lighting market ecosystem include companies which provide platforms and soldier systems. The major influencers in this market are investors, funders, academic researchers, integrators, service providers, and licencing agencies.

Interior lighting segment to grow at fastest rate in military lighting market

Growing use of map and chart lights while maintaining night vision to see outside the aircraft is driving the demand for effective cockpit lights. Additionally, there are glare shield lights to flood light the instrument panel, dome lights, floor lights, emergency lights, and oxygen mask lights. New aircraft and retrofits use LEDs in the cockpit to increase reliability and reduce lifecycle costs. These solid-state parts consume less power and have no coiled filaments, which can weaken from vibration and temperature extremes.

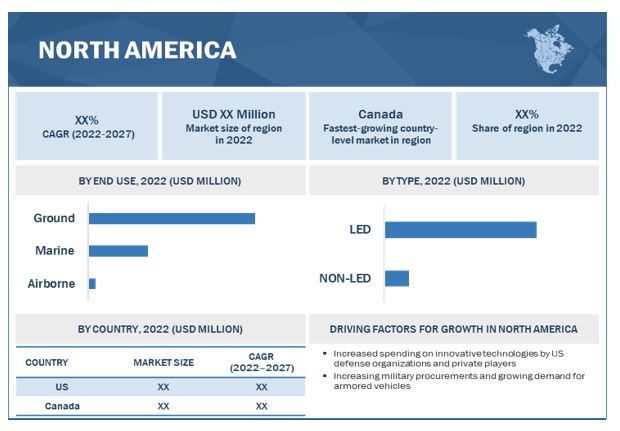
In terms of value, North America led the military lighting market

The US and Canada are expected to invest in the modernization and upgrade programs of their military capabilities to build an army that is capable of asymmetric warfare. Hence, the market for military lightings in North America is projected to witness significant growth during the forecast period. Astronics Corp. (US), Honeywell International (US), Raytheon Technologies (US), Glamox (Norway), and Orion Energy Systems (US) are the leading manufacturers of military lightings in the region.
Military Lighting Market by Region

To know about the assumptions considered for the study, download the pdf brochure

Top Military Lighting Companies - Key Market Players

The military lighting companies are dominated by a few globally established players such as Astronics Corp. (US), Honeywell International (US), Raytheon Technologies (US), Glamox (Norway), and Orion Energy Systems (US). The players are mostly engaged in new product launches & developments and having a strong global presence will enhance their position in the military lighting market. These players are primarily focusing on entering new markets by launching technologically advanced and cost-effective platforms and infrastructure. Apart from new product launches & developments, these players also adopted the partnerships contracts, & agreements strategy.  

Get online access to the report on the World's First Market Intelligence Cloud

  • Easy to Download Historical Data & Forecast Numbers
  • Company Analysis Dashboard for high growth potential opportunities
  • Research Analyst Access for customization & queries
  • Competitor Analysis with Interactive dashboard
  • Latest News, Updates & Trend analysis
Request Sample

Scope of the Report

Report Metric

Details

Market size available for years

2019-2027

Base year considered

2021

Forecast period

2022-2027

Forecast units

Value (USD)

Segments covered

Product, Type, End Use

Geographies covered

North America, Europe, Asia Pacific, Middle East, Rest of the World

Companies covered

Astronics Corp. (US), Honeywell International (US), Raytheon Technologies (US), Glamox (Norway), and Orion Energy Systems (US) among others

This research report categorizes the Military lighting Market based on Product, Type, End Use, and Region.

By Product

  • Interior Lighting
  • Exterior Lighting
  • Others

By Type

  • LED
  • Non-LED

By End Use

  • Ground
  • Marine
  • Airborne

By Region

  • North America
  •  Europe
  • Asia Pacific
  • Middle East
  • Rest of the World

Recent Developments

  • In June 2022, Rheinmetall BAE Systems Land (RBSL) and Rheinmetall Land Systeme (RSL) together awarded a contract worth USD 4.4 million contract to Oxley Group. According to the contract, the company will provide LEDs for the British Army’s new Boxer vehicles.
  • In May 2022, Astronics Corporation announced a strategic agreement with LG Display to provide market-leading OLED display technologies to the aviation sector. Through this partnership, Astronics has access to a wide range of OLED displays from LG Display, as well as technical assistance for development and integration from LG Display engineering resources.
  • In January 2022, Anglia Components strengthened its partnership with MARL International by becoming MARL’s Master Distributor for the UK and Ireland. As a Master Distributor, Anglia will not only maintain a sizable inventory of basic items for customers and other resellers but will also provide support for clients who need customized goods.
  • In September 2021, Babcock International Group has awarded the contract to Consolite Technology Ltd (UK) to provide the General and Navigation Lighting System for the Type 31 General Purpose Frigates. The agreement covers all general lighting, including internal compartment lighting and external lighting for all weather decks.
  • In April 2021, Glamox and Norwegian business Luminell Group entered an agreement to acquire 100% of Luminell’s shares. Luminell has a solid reputation as a premium developer and supplier of floodlights, searchlights, and lighting controllers in the marine and offshore lighting sector.

Frequently Asked Questions (FAQs):

To speak to our analyst for a discussion on the above findings, click Speak to Analyst


TABLE OF CONTENTS
 
1 INTRODUCTION (Page No. - 30)
    1.1 STUDY OBJECTIVES
    1.2 MARKET DEFINITION
           1.2.1 INCLUSIONS AND EXCLUSIONS
                    TABLE 1 MILITARY LIGHTING MARKET: INCLUSIONS AND EXCLUSIONS
    1.3 MARKETS COVERED
           FIGURE 1 MILITARY LIGHTING MARKET SEGMENTATION
           1.3.1 YEARS CONSIDERED
    1.4 CURRENCY CONSIDERED
    1.5 LIMITATIONS
    1.6 STAKEHOLDERS
    1.7 SUMMARY OF CHANGES
 
2 RESEARCH METHODOLOGY (Page No. - 35)
    2.1 RESEARCH DATA
           FIGURE 2 REPORT PROCESS FLOW
           FIGURE 3 RESEARCH DESIGN
           2.1.1 SECONDARY DATA
                    2.1.1.1 Key data from secondary sources
           2.1.2 PRIMARY DATA
                    2.1.2.1 Key data from primary sources
                    2.1.2.2 Breakdown of primaries
                               FIGURE 4 BREAKDOWN OF PRIMARY INTERVIEWS: BY COMPANY TYPE, DESIGNATION, AND REGION
                    2.1.2.3 Primary insights
                               FIGURE 5 KEY INSIGHTS FROM PRIMARY SOURCES
    2.2 FACTOR ANALYSIS
           2.2.1 INTRODUCTION
           2.2.2 DEMAND-SIDE INDICATORS
           2.2.3 SUPPLY-SIDE INDICATORS
    2.3 MARKET SIZE ESTIMATION
           2.3.1 BOTTOM-UP APPROACH
                    FIGURE 6 MARKET SIZE ESTIMATION METHODOLOGY: BOTTOM-UP APPROACH
           2.3.2 TOP-DOWN APPROACH
                    FIGURE 7 MARKET SIZE ESTIMATION METHODOLOGY: TOP-DOWN APPROACH
    2.4 DATA TRIANGULATION
           FIGURE 8 DATA TRIANGULATION
    2.5 RESEARCH ASSUMPTIONS
    2.6 RISK ANALYSIS
 
3 EXECUTIVE SUMMARY (Page No. - 44)
    FIGURE 9 GROUND SEGMENT ESTIMATED TO ACCOUNT FOR LARGEST SHARE OF MARKET IN 2022
    FIGURE 10 NORTH AMERICA ESTIMATED TO DOMINATE MARKET DURING FORECAST PERIOD
    FIGURE 11 LED SEGMENT ESTIMATED TO HOLD LARGER SHARE OF MARKET IN 2022
    FIGURE 12 ASIA PACIFIC TO GROW AT HIGHEST CAGR DURING FORECAST PERIOD
 
4 PREMIUM INSIGHTS (Page No. - 47)
    4.1 ATTRACTIVE GROWTH OPPORTUNITIES IN MILITARY LIGHTING MARKET
           FIGURE 13 INCREASING DEMAND FOR LEDS DRIVES MILITARY LIGHTING MARKET
    4.2 MARKET, BY REGION
           FIGURE 14 NORTH AMERICA PROJECTED TO LEAD MARKET FROM 2022 TO 2027
    4.3 MARKET, BY END USE
           FIGURE 15 GROUND SEGMENT PROJECTED TO DOMINATE MARKET FROM 2022 TO 2027
    4.4 MILITARY LIGHTING MARKET, BY COUNTRY
           FIGURE 16 CHINA PROJECTED TO REGISTER HIGHEST CAGR FROM 2022 TO 2027
 
5 MARKET OVERVIEW (Page No. - 49)
    5.1 INTRODUCTION
    5.2 MARKET DYNAMICS
           FIGURE 17 MILITARY LIGHTING MARKET: DRIVERS, RESTRAINTS, OPPORTUNITIES, AND CHALLENGES
           5.2.1 DRIVERS
                    5.2.1.1 Modernization and upgrade of military vehicles, aircraft, and naval ships
                    5.2.1.2 Use of LEDs as efficient alternative to incandescent and fluorescent lights
                               TABLE 2 COST COMPARISONS
                    5.2.1.3 Enhanced safety and quality features of LEDs
           5.2.2 RESTRAINTS
                    5.2.2.1 Lower lifespan of existing incandescent lights
                    5.2.2.2 Short-to-medium-term impact on lighting component supply due to US-China trade conflict
           5.2.3 OPPORTUNITIES
                    5.2.3.1 Compatibility of LEDs with military/navy/air force operations
                    5.2.3.2 Increasing demand for intelligent military lighting solutions
           5.2.4 CHALLENGES
                    5.2.4.1 High initial cost
                    5.2.4.2 Existing defense backlog
    5.3 MILITARY LIGHTING MARKET ECOSYSTEM
           5.3.1 PROMINENT COMPANIES
           5.3.2 START-UPS AND SMALL ENTERPRISES
           5.3.3 END USERS
                    FIGURE 18 MILITARY LIGHTING MARKET ECOSYSTEM
                    TABLE 3 MARKET ECOSYSTEM
    5.4 TRENDS/DISRUPTIONS IMPACTING CUSTOMER BUSINESS
           5.4.1 REVENUE SHIFT AND NEW REVENUE POCKETS FOR MILITARY LIGHTING MARKET
                    FIGURE 19 REVENUE SHIFT IN MARKET
    5.5 VALUE CHAIN ANALYSIS OF MILITARY LIGHTING MARKET
           FIGURE 20 VALUE CHAIN ANALYSIS
    5.6 PORTER’S FIVE FORCES ANALYSIS
           TABLE 4 MILITARY LIGHTING MARKET: PORTER’S FIVE FORCE ANALYSIS
           FIGURE 21 MARKET: PORTER’S FIVE FORCE ANALYSIS
           5.6.1 THREAT OF NEW ENTRANTS
           5.6.2 THREAT OF SUBSTITUTES
           5.6.3 BARGAINING POWER OF SUPPLIERS
           5.6.4 BARGAINING POWER OF BUYERS
           5.6.5 INTENSITY OF COMPETITIVE RIVALRY
    5.7 USE CASE ANALYSIS
           5.7.1 IOT-BASED SMART LIGHTING
                    TABLE 5 SMART MILITARY LIGHTING
    5.8 AVERAGE SELLING PRICE ANALYSIS
           FIGURE 22 AVERAGE SELLING PRICE, BY END USE
    5.9 TRADE ANALYSIS
           5.9.1 EXPORT SCENARIO OF MILITARY LIGHTING
                    TABLE 6 COUNTRY-WISE EXPORTS OF MILITARY LED FLOODLIGHTS, 2020–2021 (USD THOUSAND)
                    TABLE 7 COUNTRY-WISE IMPORTS OF MILITARY LED FLOODLIGHTS, 2020–2021 (USD THOUSAND)
                    TABLE 8 COUNTRY-WISE EXPORTS OF PORTABLE LIGHT SYSTEMS, 2020–2021 (USD THOUSAND)
                    TABLE 9 COUNTRY-WISE IMPORTS OF PORTABLE LIGHT SYSTEMS, 2020–2021 (USD THOUSAND)
    5.10 KEY STAKEHOLDERS & BUYING CRITERIA
           5.10.1 KEY STAKEHOLDERS ON BUYING PROCESS
                    FIGURE 23 INFLUENCE OF STAKEHOLDERS ON BUYING PROCESS FOR TOP THREE PLATFORMS
                    TABLE 10 INFLUENCE OF STAKEHOLDERS ON BUYING PROCESS FOR TOP THREE PLATFORMS (%)
           5.10.2 BUYING CRITERIA
                    FIGURE 24 KEY BUYING CRITERIA FOR TOP THREE PLATFORMS
                    TABLE 11 KEY BUYING CRITERIA FOR TOP 3 PLATFORMS
    5.11 TARIFF AND REGULATORY LANDSCAPE
           5.11.1 REGULATORY BODIES, GOVERNMENT AGENCIES, AND OTHER ORGANIZATIONS
                    TABLE 12 NORTH AMERICA: REGULATORY BODIES, GOVERNMENT AGENCIES, AND OTHER ORGANIZATIONS
                    TABLE 13 EUROPE: REGULATORY BODIES, GOVERNMENT AGENCIES, AND OTHER ORGANIZATIONS
                    TABLE 14 ASIA PACIFIC: REGULATORY BODIES, GOVERNMENT AGENCIES, AND OTHER ORGANIZATIONS
                    TABLE 15 MIDDLE EAST & AFRICA: REGULATORY BODIES, GOVERNMENT AGENCIES, AND OTHER ORGANIZATIONS
                    TABLE 16 LATIN AMERICA: REGULATORY BODIES, GOVERNMENT AGENCIES, AND OTHER ORGANIZATIONS
    5.12 KEY CONFERENCES & EVENTS, 2022–2023
                    TABLE 17 MILITARY LIGHTING MARKET: CONFERENCES & EVENTS
 
6 INDUSTRY TRENDS (Page No. - 69)
    6.1 INTRODUCTION
    6.2 SUPPLY CHAIN ANALYSIS
           6.2.1 MAJOR COMPANIES
           6.2.2 SMALL AND MEDIUM ENTERPRISES
           6.2.3 END USERS/CUSTOMERS
                    FIGURE 25 SUPPLY CHAIN ANALYSIS OF MILITARY LIGHTING MARKET
    6.3 EMERGING INDUSTRY TRENDS
           6.3.1 VISIBLE LIGHT COMMUNICATION (VLC)
           6.3.2 SOLAR LIGHTING SYSTEMS
           6.3.3 REMOTE SOURCE LIGHTING
           6.3.4 LIGHT EMITTING DIODE (LED)
                    6.3.4.1 Benefits of LED over traditional lighting systems
           6.3.5 ORGANIC LIGHT EMITTING DIODE (OLED)
    6.4 PATENT ANALYSIS
           TABLE 18 KEY PATENTS, 2019-2022
    6.5 IMPACT OF MEGATRENDS
           6.5.1 NET-ZERO IMITATIVE
           6.5.2 LED FOR NAVAL SHIPS
 
7 MILITARY LIGHTING MARKET, BY TYPE (Page No. - 76)
    7.1 INTRODUCTION
           FIGURE 26 LED SEGMENT PROJECTED TO GROW AT HIGHER CAGR DURING FORECAST PERIOD
           TABLE 19 LED: MILITARY LIGHTING MARKET, BY REGION, 2019–2021 (USD MILLION)
           TABLE 20 LED: MARKET, BY REGION, 2022–2027 (USD MILLION)
           TABLE 21 NON-LED: MARKET, BY REGION, 2019–2021 (USD MILLION)
           TABLE 22 NON-LED: MARKET, BY REGION, 2022–2027 (USD MILLION)
    7.2 NON-LED
           7.2.1 NEEDED FOR ILLUMINATION OF LARGE AREAS
    7.3 LED
           7.3.1 INCREASING CONTRACTS TO UPGRADE AND RETROFIT EXISTING LIGHTING
 
8 MILITARY LIGHTING MARKET, BY PRODUCT (Page No. - 80)
    8.1 INTRODUCTION
           FIGURE 27 INTERIOR SEGMENT TO REGISTER FASTER GROWTH DURING FORECAST PERIOD
           TABLE 23 MILITARY LIGHTING MARKET, BY PRODUCT, 2019–2021 (USD MILLION)
           TABLE 24 MARKET, BY PRODUCT, 2022–2027 (USD MILLION)
    8.2 INTERIOR LIGHTING
           8.2.1 COCKPIT LIGHTS
                    8.2.1.1 Growing use of map and chart lights
           8.2.2 CABIN LIGHTS
                    8.2.2.1 Used in dedicated cabin lighting
                               TABLE 25 MILITARY INTERIOR LIGHTING MARKET, BY REGION, 2019–2021 (USD MILLION)
                               TABLE 26 MILITARY INTERIOR LIGHTING MARKET, BY REGION, 2022–2027 (USD MILLION)
    8.3 EXTERIOR LIGHTING
           8.3.1 ANTI-COLLISION LIGHTS
                    8.3.1.1 Needed for improved visibility
           8.3.2 LANDING LIGHTS
                    8.3.2.1 Required to avoid other aircraft and bird strikes
           8.3.3 POSITION/NAVIGATION LIGHTS
                    8.3.3.1 Essential for information regarding location, movement, and position of aircraft
           8.3.4 OBSTRUCTION LIGHTS
                    8.3.4.1 Useful in identifying fixed obstructions on superstructures
           8.3.5 WING & ENGINE INSPECTION LIGHTS
                    8.3.5.1 Needed to observe general condition of wings
           8.3.6 DECK STATUS LIGHTS
                    8.3.6.1 Importance in observing status of flight deck
           8.3.7 HOVERING LIGHTS
                    8.3.7.1 Growing use in military helicopters
           8.3.8 EMERGENCY LIGHTS
                    8.3.8.1 Needed for safe evacuation during emergencies
           8.3.9 FORMATION LIGHTS
                    8.3.9.1 Useful in flying in close formation at night
           8.3.10 EXPLOSION-PROOF LIGHTS
                    8.3.10.1 Usage in emergency and war situations
           8.3.11 CONTROL ROOM LIGHTS
                    8.3.11.1 Dimming option critical to these lights
           8.3.12 MINI FLOODLIGHTS
                    8.3.12.1 Essential in illuminating critical pathways and emergency routes
           8.3.13 COMPARTMENT LIGHTS
                    8.3.13.1 Requirement in illumination of important compartments
                                TABLE 27 MILITARY EXTERIOR LIGHTING MARKET, BY REGION, 2019–2021 (USD MILLION)
                                TABLE 28 MILITARY EXTERIOR LIGHTING MARKET, BY REGION, 2022–2027 (USD MILLION)
    8.4 OTHERS
           TABLE 29 OTHERS: MILITARY LIGHTING MARKET, BY REGION, 2019–2021 (USD MILLION)
           TABLE 30 OTHERS: MARKET, BY REGION, 2022–2027 (USD MILLION)
 
9 MILITARY LIGHTING MARKET, BY END USE (Page No. - 88)
    9.1 INTRODUCTION
           FIGURE 28 GROUND SEGMENT PROJECTED TO BE FASTEST DURING FORECAST PERIOD
           TABLE 31 MILITARY LIGHTING MARKET, BY END USE, 2019–2021 (USD MILLION)
           TABLE 32 MARKET, BY END USE, 2022–2027 (USD MILLION)
    9.2 GROUND
           TABLE 33 GROUND: MARKET, BY REGION, 2019–2021 (USD MILLION)
           TABLE 34 GROUND: MARKET, BY REGION, 2022–2027 (USD MILLION)
           9.2.1 ARMORED VEHICLES
                    9.2.1.1 Increasing LAMV demand and OEM solutions
           9.2.2 MILITARY SHELTERS
                    9.2.2.1 Hard shelters
                               9.2.2.1.1 Need for less EMC emissions in hard shelters
                    9.2.2.2 Soft shelters
                               9.2.2.2.1 Require quick assembly and covert and emergency lighting systems
           9.2.3 SOLDIER LIGHTS
                    9.2.3.1 Demand for quick responses and alertness to drive segment
           9.2.4 AIRFIELD LIGHTING
                    9.2.4.1 Solar airfield lighting systems
                               9.2.4.1.1 Offer cost-effective lighting solutions
                    9.2.4.2 In-pavement/inset airfield lights
                               9.2.4.2.1 Need for strong and durable lights
                    9.2.4.3 Elevated airfield lights
                               9.2.4.3.1 Demand for economical lights to drive segment
    9.3 AIRBORNE
           TABLE 35 AIRBORNE: MILITARY LIGHTING MARKET, BY REGION, 2019–2021 (USD MILLION)
           TABLE 36 AIRBORNE: MARKET, BY REGION, 2022–2027 (USD MILLION)
           9.3.1 FIGHTER AIRCRAFT
                    9.3.1.1 Require more external lights
           9.3.2 TRANSPORT AIRCRAFT
                    9.3.2.1 Use cockpit lights
           9.3.3 MILITARY HELICOPTERS
                    9.3.3.1 Need to improve visibility of military helicopters
           9.3.4 SPECIAL MISSION AIRCRAFT
                    9.3.4.1 Growing number of global special missions
           9.3.5 UNMANNED AERIAL VEHICLES (UAV)
                    9.3.5.1 Need customized lighting systems
    9.4 MARINE
           TABLE 37 MARINE: MILITARY LIGHTING MARKET, BY REGION, 2019–2021 (USD MILLION)
           TABLE 38 MARINE: MARKET, BY REGION, 2022–2027 (USD MILLION)
           9.4.1 DESTROYERS
                    9.4.1.1 Need long-endurance lighting systems
           9.4.2 FRIGATES
                    9.4.2.1 Increasing number of contracts for navigation lighting systems
           9.4.3 CORVETTES
                    9.4.3.1 Growing demand from naval forces
           9.4.4 AMPHIBIOUS SHIPS
                    9.4.4.1 Require replacement of fluorescent lighting with LED
           9.4.5 SUBMARINES
                    9.4.5.1 Need for optical characteristics to reduce fatigue
           9.4.6 AIRCRAFT CARRIERS
                    9.4.6.1 Growing importance in warfare
 
10 REGIONAL ANALYSIS (Page No. - 98)
     10.1 INTRODUCTION
           FIGURE 29 NORTH AMERICA TO HOLD DOMINANT SHARE OF MILITARY LIGHTING MARKET IN 2022
           TABLE 39 MILITARY LIGHTING, BY REGION, 2019–2021 (USD MILLION)
           TABLE 40 MILITARY LIGHTING, BY REGION, 2022–2027 (USD MILLION)
     10.2 NORTH AMERICA
             10.2.1 PESTLE ANALYSIS
                        FIGURE 30 NORTH AMERICA: MILITARY LIGHTING MARKET SNAPSHOT
                        TABLE 41 NORTH AMERICA: MARKET, BY COUNTRY, 2019–2021 (USD MILLION)
                        TABLE 42 NORTH AMERICA: MARKET, BY COUNTRY, 2022–2027 (USD MILLION)
                        TABLE 43 NORTH AMERICA: MARKET, BY END USE, 2019–2021 (USD MILLION)
                        TABLE 44 NORTH AMERICA: MARKET, BY END USE, 2022–2027 (USD MILLION)
                        TABLE 45 NORTH AMERICA: MARKET, BY TYPE, 2019–2021 (USD MILLION)
                        TABLE 46 NORTH AMERICA: MARKET, BY TYPE, 2022–2027 (USD MILLION)
                        TABLE 47 NORTH AMERICA: MARKET, BY PRODUCT, 2019–2021 (USD MILLION)
                        TABLE 48 NORTH AMERICA: MARKET, BY PRODUCT, 2022–2027 (USD MILLION)
             10.2.2 US
                        10.2.2.1 Presence of top military lighting manufacturers
                                     TABLE 49 US: MILITARY LIGHTING MARKET, BY END USE, 2019–2021 (USD MILLION)
                                     TABLE 50 US: MARKET, BY END USE, 2022–2027 (USD MILLION)
                                     TABLE 51 US: MARKET, BY TYPE 2019–2021 (USD MILLION)
                                     TABLE 52 US: MARKET, BY TYPE, 2022–2027 (USD MILLION)
             10.2.3 CANADA
                        10.2.3.1 Increasing military shelter procurements
                                     TABLE 53 CANADA: MILITARY LIGHTING MARKET, BY END USE, 2019–2021 (USD MILLION)
                                     TABLE 54 CANADA: MARKET, BY END USE, 2022–2027 (USD MILLION)
                                     TABLE 55 CANADA: MARKET, BY TYPE, 2019–2021 (USD MILLION)
                                     TABLE 56 CANADA: MARKET, BY TYPE, 2022–2027 (USD MILLION)
     10.3 EUROPE
             10.3.1 PESTLE ANALYSIS
                        FIGURE 31 EUROPE: MILITARY LIGHTING MARKET SNAPSHOT
                        TABLE 57 EUROPE: MARKET, BY COUNTRY, 2019–2021 (USD MILLION)
                        TABLE 58 EUROPE: MARKET, BY COUNTRY, 2022–2027 (USD MILLION)
                        TABLE 59 EUROPE: MARKET, BY END USE, 2019–2021 (USD MILLION)
                        TABLE 60 EUROPE: MARKET, BY END USE, 2022–2027 (USD MILLION)
                        TABLE 61 EUROPE: MARKET, BY TYPE, 2019–2021 (USD MILLION)
                        TABLE 62 EUROPE: MARKET, BY TYPE, 2022–2027 (USD MILLION)
                        TABLE 63 EUROPE: MARKET, BY PRODUCT, 2019–2021 (USD MILLION)
                        TABLE 64 EUROPE: MARKET, BY PRODUCT, 2022–2027 (USD MILLION)
             10.3.2 RUSSIA
                        10.3.2.1 Rising geopolitical tensions and military expenditure
                                     TABLE 65 RUSSIA: MILITARY LIGHTING MARKET, BY END USE, 2019–2021 (USD MILLION)
                                     TABLE 66 RUSSIA: MARKET, BY END USE, 2022–2027 (USD MILLION)
                                     TABLE 67 RUSSIA: MARKET, BY TYPE, 2019–2021 (USD MILLION)
                                     TABLE 68 RUSSIA: MARKET, BY TYPE, 2022–2027 (USD MILLION)
             10.3.3 FRANCE
                        10.3.3.1 Increasing military spending
                                     TABLE 69 FRANCE: MILITARY LIGHTING MARKET, BY END USE, 2019–2021 (USD MILLION)
                                     TABLE 70 FRANCE: MARKET, BY END USE, 2022–2027 (USD MILLION)
                                     TABLE 71 FRANCE: MARKET, BY TYPE, 2019–2021 (USD MILLION)
                                     TABLE 72 FRANCE: MARKET, BY TYPE, 2022–2027 (USD MILLION)
             10.3.4 UK
                        10.3.4.1 Procurement of new airborne platforms
                                     TABLE 73 UK: MILITARY LIGHTING MARKET, BY END USE, 2019–2021 (USD MILLION)
                                     TABLE 74 UK: MARKET, BY END USE, 2022–2027 (USD MILLION)
                                     TABLE 75 UK: MARKET, BY TYPE, 2019–2021 (USD MILLION)
                                     TABLE 76 UK: MARKET, BY TYPE, 2022–2027 (USD MILLION)
             10.3.5 GERMANY
                        10.3.5.1 Investments in developing multifunctional and technologically advanced land-based operations
                                     TABLE 77 GERMANY: MILITARY LIGHTING MARKET, BY END USE, 2019–2021 (USD MILLION)
                                     TABLE 78 GERMANY: MARKET, BY END USE, 2022–2027 (USD MILLION)
                                     TABLE 79 GERMANY: MARKET, BY TYPE, 2019–2021 (USD MILLION)
                                     TABLE 80 GERMANY: MARKET, BY TYPE, 2022–2027 (USD MILLION)
             10.3.6 ITALY
                        10.3.6.1 Continuous investments in procurement of advanced aircraft
                                     TABLE 81 ITALY: MILITARY LIGHTING MARKET, BY END USE, 2019–2021 (USD MILLION)
                                     TABLE 82 ITALY: MARKET, BY END USE 2022–2027 (USD MILLION)
                                     TABLE 83 ITALY: MARKET, BY TYPE, 2019–2021 (USD MILLION)
                                     TABLE 84 ITALY: MARKET, BY TYPE, 2022–2027 (USD MILLION)
             10.3.7 SPAIN
                        10.3.7.1 Growing military budget to meet NATO obligations by 2028
                                     TABLE 85 SPAIN: MILITARY LIGHTING MARKET, BY END USE 2019–2021 (USD MILLION)
                                     TABLE 86 SPAIN: MARKET, BY END USE 2022–2027 (USD MILLION)
                                     TABLE 87 SPAIN: MARKET, BY TYPE, 2019–2021 (USD MILLION)
                                     TABLE 88 SPAIN: MARKET, BY TYPE, 2022–2027 (USD MILLION)
             10.3.8 REST OF EUROPE
                        TABLE 89 REST OF EUROPE: MILITARY LIGHTING MARKET, BY END USE, 2019–2021 (USD MILLION)
                        TABLE 90 REST OF EUROPE: MARKET, BY END USE, 2022–2027 (USD MILLION)
                        TABLE 91 REST OF EUROPE: MARKET, BY TYPE, 2019–2021, 2019–2021 (USD MILLION)
                        TABLE 92 REST OF EUROPE: MARKET, BY TYPE, 2022–2027 (USD MILLION)
     10.4 ASIA PACIFIC
             10.4.1 PESTLE ANALYSIS
                        FIGURE 32 ASIA PACIFIC: MILITARY LIGHTING MARKET SNAPSHOT
                        TABLE 93 ASIA PACIFIC: MARKET, BY COUNTRY, 2019–2021 (USD MILLION)
                        TABLE 94 ASIA PACIFIC: MARKET, BY COUNTRY, 2022–2027 (USD MILLION)
                        TABLE 95 ASIA PACIFIC: MARKET, BY END USE, 2019–2021 (USD MILLION)
                        TABLE 96 ASIA PACIFIC: MARKET, BY END USE, 2022–2027 (USD MILLION)
                        TABLE 97 ASIA PACIFIC: MARKET, BY TYPE, 2019–2021 (USD MILLION)
                        TABLE 98 ASIA PACIFIC: MARKET, BY TYPE, 2022–2027 (USD MILLION)
                        TABLE 99 ASIA PACIFIC: MARKET, BY PRODUCT, 2019–2021 (USD MILLION)
                        TABLE 100 ASIA PACIFIC: MARKET, BY PRODUCT, 2022–2027 (USD MILLION)
             10.4.2 CHINA
                        10.4.2.1 Growing defense funding
                                     TABLE 101 CHINA: MILITARY LIGHTING MARKET, BY END USE, 2019–2021 (USD MILLION)
                                     TABLE 102 CHINA: MARKET, BY END USE, 2022–2027 (USD MILLION)
                                     TABLE 103 CHINA: MARKET, BY TYPE, 2019–2021 (USD MILLION)
                                     TABLE 104 CHINA: MARKET, BY TYPE, 2022–2027 (USD MILLION)
             10.4.3 INDIA
                        10.4.3.1 In-house development of military equipment
                                     TABLE 105 INDIA: MILITARY LIGHTING MARKET, BY END USE, 2019–2021 (USD MILLION)
                                     TABLE 106 INDIA: MARKET, BY END USE, 2022–2027 (USD MILLION)
                                     TABLE 107 INDIA: MARKET, BY TYPE, 2019–2021 (USD MILLION)
                                     TABLE 108 INDIA: MARKET, BY TYPE, 2022–2027 (USD MILLION)
             10.4.4 AUSTRALIA
                        10.4.4.1 Increasing modernization of combat fleets
                                     TABLE 109 AUSTRALIA: MILITARY LIGHTING MARKET, BY END USE, 2019–2021 (USD MILLION)
                                     TABLE 110 AUSTRALIA: MARKET, BY END USE, 2022–2027 (USD MILLION)
                                     TABLE 111 AUSTRALIA: MARKET, BY TYPE, 2019–2021 (USD MILLION)
                                     TABLE 112 AUSTRALIA: MARKET, BY TYPE, 2022–2027 (USD MILLION)
             10.4.5 JAPAN
                        10.4.5.1 Ever-growing technological advancements and investments
                                     TABLE 113 JAPAN: MILITARY LIGHTING MARKET, BY END USE, 2019–2021 (USD MILLION)
                                     TABLE 114 JAPAN: MARKET, BY END USE, 2022–2027 (USD MILLION)
                                     TABLE 115 JAPAN: MARKET, BY TYPE, 2019–2021 (USD MILLION)
                                     TABLE 116 JAPAN: MARKET, BY TYPE, 2022–2027 (USD MILLION)
             10.4.6 SOUTH KOREA
                        10.4.6.1 Increased spending on aircraft
                                     TABLE 117 SOUTH KOREA: MILITARY LIGHTING MARKET, BY END USE, 2019–2021 (USD MILLION)
                                     TABLE 118 SOUTH KOREA: MARKET, BY END USE, 2022–2027 (USD MILLION)
                                     TABLE 119 SOUTH KOREA: MARKET, BY TYPE, 2019–2021 (USD MILLION)
                                     TABLE 120 SOUTH KOREA: MARKET, BY TYPE, 2022–2027 (USD MILLION)
             10.4.7 REST OF ASIA PACIFIC
                        TABLE 121 REST OF ASIA PACIFIC: MILITARY LIGHTING MARKET, BY END USE, 2019–2021 (USD MILLION)
                        TABLE 122 REST OF ASIA PACIFIC: MARKET, BY END USE, 2022–2027 (USD MILLION)
                        TABLE 123 REST OF ASIA PACIFIC: MARKET, BY TYPE, 2019–2021 (USD MILLION)
                        TABLE 124 REST OF ASIA PACIFIC: MARKET, BY TYPE, 2022–2027 (USD MILLION)
     10.5 MIDDLE EAST
             10.5.1 PESTLE ANALYSIS
                        FIGURE 33 MIDDLE EAST: MILITARY LIGHTING MARKET SNAPSHOT
                        TABLE 125 MIDDLE EAST: MARKET, BY END USE, 2019–2021 (USD MILLION)
                        TABLE 126 MIDDLE EAST: MARKET, BY END USE, 2022–2027 (USD MILLION)
                        TABLE 127 MIDDLE EAST: MARKET, BY TYPE, 2019–2021 (USD MILLION)
                        TABLE 128 MIDDLE EAST: MARKET, BY TYPE, 2022–2027 (USD MILLION)
                        TABLE 129 MIDDLE EAST: MARKET, BY PRODUCT, 2019–2021 (USD MILLION)
                        TABLE 130 MIDDLE EAST: MARKET, BY KILL SYSTEM TYPE, 2022–2027 (USD MILLION)
                        TABLE 131 MIDDLE EAST: MARKET, BY COUNTRY, 2019–2021 (USD MILLION)
                        TABLE 132 MIDDLE EAST: MARKET, BY COUNTRY, 2022–2027 (USD MILLION)
             10.5.2 TURKEY
                        10.5.2.1 High military expenditure
                                     TABLE 133 TURKEY: MILITARY LIGHTING MARKET, BY END USE, 2019–2021 (USD MILLION)
                                     TABLE 134 TURKEY: MARKET, BY END USE, 2022–2027 (USD MILLION)
                                     TABLE 135 TURKEY: MARKET, BY TYPE, 2019–2021 (USD MILLION)
                                     TABLE 136 TURKEY: MARKET, BY TYPE, 2022–2027 (USD MILLION)
             10.5.3 ISRAEL
                        10.5.3.1 Increased spending on fleet modernization
                                     TABLE 137 ISRAEL: MILITARY LIGHTING MARKET, BY END USE, 2019–2021 (USD MILLION)
                                     TABLE 138 ISRAEL: MARKET, BY END USE, 2022–2027 (USD MILLION)
                                     TABLE 139 ISRAEL: MARKET, BY TYPE, 2019–2021 (USD MILLION)
                                     TABLE 140 ISRAEL: MARKET, BY TYPE, 2022–2027 (USD MILLION)
             10.5.4 UAE
                        10.5.4.1 Intensifying geopolitical threats
                                     TABLE 141 UAE: MILITARY LIGHTING MARKET, BY END USE, 2019–2021 (USD MILLION)
                                     TABLE 142 UAE: MARKET, BY END USE, 2022–2027 (USD MILLION)
                                     TABLE 143 UAE: MARKET, BY TYPE, 2019–2021 (USD MILLION)
                                     TABLE 144 UAE: MARKET, BY TYPE, 2022–2027 (USD MILLION)
             10.5.5 SAUDI ARABIA
                        10.5.5.1 Regional tensions with Iran
                                     TABLE 145 SAUDI ARABIA: MILITARY LIGHTING MARKET, BY END USE, 2019–2021 (USD MILLION)
                                     TABLE 146 SAUDI ARABIA: MARKET, BY END USE, 2022–2027 (USD MILLION)
                                     TABLE 147 SAUDI ARABIA: MARKET, BY TYPE, 2019–2021 (USD MILLION)
                                     TABLE 148 SAUDI ARABIA: MARKET, BY TYPE, 2022–2027 (USD MILLION)
             10.5.6 REST OF MIDDLE EAST
                        TABLE 149 REST OF MIDDLE EAST: MILITARY LIGHTING MARKET, BY END USE, 2019–2021 (USD MILLION)
                        TABLE 150 REST OF MIDDLE EAST: MARKET, BY END USE, 2022–2027 (USD MILLION)
                        TABLE 151 REST OF MIDDLE EAST: MARKET, BY TYPE, 2019–2021 (USD MILLION)
                        TABLE 152 REST OF MIDDLE EAST: MARKET, BY TYPE, 2022–2027 (USD MILLION)
     10.6 REST OF THE WORLD
             10.6.1 PESTLE ANALYSIS
                        TABLE 153 REST OF THE WORLD: MILITARY LIGHTING MARKET, BY END USE, 2019–2021 (USD MILLION)
                        TABLE 154 REST OF THE WORLD: MARKET, BY END USE, 2022–2027 (USD MILLION)
                        TABLE 155 REST OF THE WORLD: MARKET, BY TYPE, 2019–2021 (USD MILLION)
                        TABLE 156 REST OF THE WORLD: MARKET, BY TYPE, 2022–2027 (USD MILLION)
                        TABLE 157 REST OF THE WORLD: MARKET, BY PRODUCT, 2019–2021 (USD MILLION)
                        TABLE 158 REST OF THE WORLD: MARKET, BY PRODUCT, 2022–2027 (USD MILLION)
                        TABLE 159 REST OF THE WORLD: MARKET, BY REGION, 2019–2021 (USD MILLION)
                        TABLE 160 REST OF THE WORLD: MARKET, BY REGION, 2022–2027 (USD MILLION)
             10.6.2 LATIN AMERICA
                        10.6.2.1 Increasing procurement of battle tanks by Brazil
                                     TABLE 161 LATIN AMERICA: MILITARY LIGHTING MARKET, BY END USE, 2019–2021 (USD MILLION)
                                     TABLE 162 LATIN AMERICA: MARKET, BY END USE, 2022–2027 (USD MILLION)
                                     TABLE 163 LATIN AMERICA: MARKET, BY TYPE, 2019–2021 (USD MILLION)
                                     TABLE 164 LATIN AMERICA: MARKET, BY TYPE, 2022–2027 (USD MILLION)
             10.6.3 AFRICA
                        10.6.3.1 Increase in establishment of military shelters
                                     TABLE 165 AFRICA: MILITARY LIGHTING MARKET, BY END USE, 2019–2021 (USD MILLION)
                                     TABLE 166 AFRICA: MARKET, BY END USE, 2022–2027 (USD MILLION)
                                     TABLE 167 AFRICA: MARKET, BY TYPE, 2019–2021 (USD MILLION)
                                     TABLE 168 AFRICA: MARKET, BY TYPE, 2022–2027 (USD MILLION)
 
11 COMPETITIVE LANDSCAPE (Page No. - 147)
     11.1 INTRODUCTION 
     11.2 COMPETITIVE OVERVIEW 
             TABLE 169 KEY DEVELOPMENTS BY LEADING PLAYERS IN MILITARY LIGHTING MARKET BETWEEN 2019 AND 2022
     11.3 MARKET RANKING ANALYSIS OF KEY PLAYERS, 2021 
             FIGURE 34 RANKING ANALYSIS OF TOP FIVE PLAYERS: MILITARY LIGHTING MARKET, 2021
     11.4 MARKET SHARE OF KEY PLAYERS, 2021 
             FIGURE 35 MARKET SHARE OF KEY PLAYERS
     11.5 REVENUE ANALYSIS OF TOP 5 MARKET PLAYERS, 2019–2021 
             FIGURE 36 REVENUE ANALYSIS OF TOP FIVE MARKET PLAYERS
     11.6 COMPANY PRODUCT FOOTPRINT ANALYSIS 
             TABLE 170 COMPANY PRODUCT FOOTPRINT
             TABLE 171 COMPANY REGION FOOTPRINT
     11.7 COMPANY EVALUATION QUADRANT 
             11.7.1 STARS
             11.7.2 EMERGING LEADERS
             11.7.3 PERVASIVE COMPANIES
             11.7.4 PARTICIPANTS
                        FIGURE 37 MARKET COMPETITIVE LEADERSHIP MAPPING, 2021
     11.8 START-UP EVALUATION QUADRANT 
             11.8.1 PROGRESSIVE COMPANIES
             11.8.2 RESPONSIVE COMPANIES
             11.8.3 STARTING BLOCKS
             11.8.4 DYNAMIC COMPANIES
                        FIGURE 38 COMPETITIVE LEADERSHIP MAPPING OF SMES/START-UPS, 2021
     11.9 COMPETITIVE BENCHMARKING 
                        TABLE 172 MILITARY LIGHT MARKET: DETAILED LIST OF KEY START-UPS/SMES
     11.1 COMPETITIVE SCENARIO 
             11.10.1 MARKET EVALUATION FRAMEWORK
             11.10.2 DEALS
                        TABLE 173 MILITARY LIGHTING MARKET: DEALS, JULY 2019–MAY 2022
 
12 COMPANY PROFILES (Page No. - 159)
     12.1 INTRODUCTION 
(Business overview, Products/Solutions/Services offered, Recent Developments, MnM view, Key strengths, Strategic choices, Weaknesses and competitive threats) *  
     12.2 KEY PLAYERS 
             12.2.1 ASTRONICS CORPORATION
                        TABLE 174 ASTRONICS CORP: BUSINESS OVERVIEW
                        FIGURE 39 ASTRONICS CORP: COMPANY SNAPSHOT
                        TABLE 175 ASTRONICS CORP: PRODUCTS OFFERED
                        TABLE 176 ASTRONICS CORP: DEALS
             12.2.2 HONEYWELL INTERNATIONAL.
                        TABLE 177 HONEYWELL INTERNATIONAL: BUSINESS OVERVIEW
                        FIGURE 40 HONEYWELL INTERNATIONAL: COMPANY SNAPSHOT
                        TABLE 178 HONEYWELL INTERNATIONAL: PRODUCTS OFFERED
                        TABLE 179 HONEYWELL INTERNATIONAL: DEALS
             12.2.3 RAYTHEON TECHNOLOGIES
                        TABLE 180 RAYTHEON TECHNOLOGIES: BUSINESS OVERVIEW
                        FIGURE 41 RAYTHEON TECHNOLOGIES: COMPANY SNAPSHOT
                        TABLE 181 RAYTHEON TECHNOLOGIES: PRODUCTS OFFERED
             12.2.4 GLAMOX
                        TABLE 182 GLAMOX: BUSINESS OVERVIEW
                        FIGURE 42 GLAMOX: COMPANY SNAPSHOT
                        TABLE 183 GLAMOX: PRODUCTS OFFERED
                        TABLE 184 GLAMOX: DEALS
             12.2.5 ORION ENERGY SYSTEMS
                        TABLE 185 ORION ENERGY SYSTEMS: BUSINESS OVERVIEW
                        FIGURE 43 ORION ENERGY SYSTEMS: COMPANY SNAPSHOT
                        TABLE 186 ORION ENERGY SYSTEMS: PRODUCTS OFFERED
             12.2.6 LIGHTPARTNER LICHTSYSTEME GMBH & CO. KG
                        TABLE 187 LIGHTPARTNER LICHTSYSTEME GMBH & CO. KG: BUSINESS OVERVIEW
                        TABLE 188 LIGHTPARTNER LICHTSYSTEME GMBH: PRODUCTS OFFERED
             12.2.7 CONSOLITE TECHNOLOGY
                        TABLE 189 CONSOLITE TECHNOLOGY: BUSINESS OVERVIEW
                        TABLE 190 CONSOLITE TECHNOLOGY: PRODUCTS OFFERED
                        TABLE 191 CONSOLITE TECHNOLOGY: DEALS
             12.2.8 KARL DOSE GMBH
                        TABLE 192 KARL DOSE GMBH: BUSINESS OVERVIEW
                        TABLE 193 KARL DOSE GMBH: PRODUCTS OFFERED
             12.2.9 WISKA HOPPMANN GMBH
                        TABLE 194 WISK HOPPMANN GMBH: BUSINESS OVERVIEW
                        TABLE 195 WISKA HOPPMANN GMBH: PRODUCTS OFFERED
             12.2.10 OXLEY GROUP
                        TABLE 196 OXLEY GROUP: BUSINESS OVERVIEW
                        TABLE 197 OXLEY GROUP: PRODUCTS OFFERED
                        TABLE 198 OXLEY GROUP: DEALS
             12.2.11 MARL INTERNATIONAL
                        TABLE 199 MARL INTERNATIONAL: BUSINESS OVERVIEW
                        TABLE 200 MARL INTERNATIONAL: PRODUCTS OFFERED
                        TABLE 201 MARL INTERNATIONAL: DEALS
             12.2.12 ADB SAFEGATE
                        TABLE 202 ADB SAFEGATE: BUSINESS OVERVIEW
                        TABLE 203 ADB SAFEGATE: PRODUCTS OFFERED
             12.2.13 THE L.C. DOANE COMPANY
                        TABLE 204 THE L.C. DOANE COMPANY: BUSINESS OVERVIEW
                        TABLE 205 THE L.C. DOANE COMPANY: PRODUCTS OFFERED
             12.2.14 UNILUX GEOMAR S.A.
                        TABLE 206 UNILUX GEOMAR: BUSINESS OVERVIEW
                        TABLE 207 UNILUX GEOMAR: PRODUCTS OFFERED
             12.2.15 OPTONAVAL GMBH
                        TABLE 208 OPTONAVAL GMBH: BUSINESS OVERVIEW
                        TABLE 209 OPTONAVAL GMBH: PRODUCTS OFFERED
*Details on Business overview, Products/Solutions/Services offered, Recent Developments, MnM view, Key strengths, Strategic choices, Weaknesses and competitive threats might not be captured in case of unlisted companies.  
     12.3 OTHER PLAYERS 
             12.3.1 SODERBERG MANUFACTURING COMPANY
                        TABLE 210 SODERBERG MANUFACTURING COMPANY: COMPANY OVERVIEW
             12.3.2 LOPOLIGHT COMPANY
                        TABLE 211 LOPOLIGHT: COMPANY OVERVIEW
             12.3.3 PETERS AND BEY COMPANY
                        TABLE 212 PETERS AND BEY COMPANY: COMPANY OVERVIEW
             12.3.4 CILAS COMPANY
                        TABLE 213 CILAS COMPANY: COMPANY OVERVIEW
             12.3.5 CALZONI
                        TABLE 214 CALZONI: COMPANY OVERVIEW
             12.3.6 COBHAM LIMITED
                        TABLE 215 COBHAM LIMITED: COMPANY OVERVIEW
             12.3.7 ZODIAC AEROSPACE
                        TABLE 216 ZODIAC AEROSPACE: COMPANY OVERVIEW
             12.3.8 AGI HOLDINGS
                        TABLE 217 AGI HOLDINGS LLC: COMPANY OVERVIEW
             12.3.9 DEN HAAN ROTTERDAM (DHR)
                        TABLE 218 DEN HAAN ROTTERDAM (DHR): COMPANY OVERVIEW
             12.3.10 DAEYANG
                        TABLE 219 DAEYANG: COMPANY OVERVIEW
 
13 APPENDIX (Page No. - 198)
     13.1 DISCUSSION GUIDE 
     13.2 KNOWLEDGESTORE: MARKETSANDMARKETS’ SUBSCRIPTION PORTAL 
     13.3 CUSTOMIZATION OPTIONS 
     13.4 RELATED REPORTS 
     13.5 AUTHOR DETAILS 


This research study involved the extensive use of secondary sources, directories, and databases, such as D&B Hoovers, Bloomberg Businessweek, and Factiva to identify and collect information relevant to the military lighting market. Primary sources included industry experts from the core and related industries as well as preferred suppliers, manufacturers, solution providers, technology developers, alliances, and organizations related to all the segments of this industry’s value chain. All primary sources were interviewed to obtain and verify critical qualitative and quantitative information as well as to assess prospects for the growth of the market during the forecast period.

Secondary Research

The share of companies in the military lighting market was determined using secondary data made available through paid and unpaid sources and by analyzing their product portfolios. The companies were rated based on the performance and quality of their products. These data points were further validated by primary sources.

Secondary sources that were referred to for this research study on the military lighting market included financial statements of companies offering and developing military lighting products and solutions and information from various trade, business, and professional associations, among others. Secondary data was collected and analyzed to arrive at the overall size of the military lighting market, which was further validated by primary respondents.

Primary Research

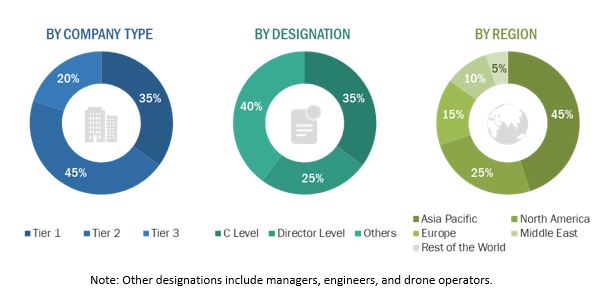
Extensive primary research was conducted after obtaining information about the current scenario of the military lighting market through secondary research. Several primary interviews were conducted with market experts from both, the demand- and supply-side across 5 major regions, namely, North America, Europe, Asia Pacific, and the Middle East and Rest of the World. This primary data was collected through questionnaires, mails, and telephonic interviews.
Military Lighting Market Size, and Share

To know about the assumptions considered for the study, download the pdf brochure

Market Size Estimation

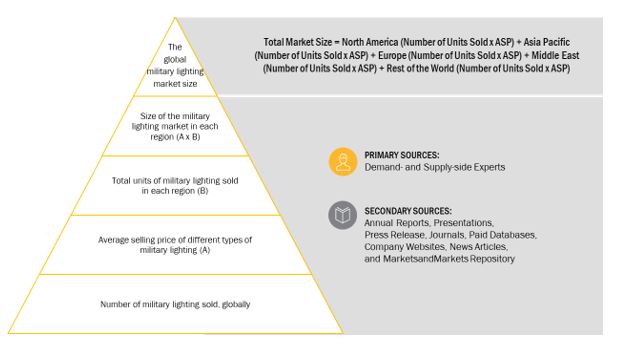
Both, the top-down and bottom-up approaches were used to estimate and validate the size of the military lighting market.

The research methodology that was used to estimate the size of the military lighting market includes the following details.

Key players in the military lighting market were identified through secondary research, and their market share was determined through primary and secondary research. This included a study of the annual and financial reports of the top market players and extensive interviews of leaders such as chief executive officers, directors, and marketing executives of the leading companies operating in the military lighting market.

All percentage shares, splits, and breakdowns were determined using secondary sources and were verified through primary sources. All possible parameters that affect the markets covered in this research study were accounted for, viewed in extensive detail, verified through primary research, and analyzed to obtain the final quantitative and qualitative data on the military lighting market. This data was consolidated, enhanced with detailed inputs, analyzed by MarketsandMarkets, and presented in this report.

Market size estimation methodology: Bottom-up approach
Military Lighting Market Size, and Bottom-up approach

Data Triangulation

After arriving at the overall size of the military lighting market from the market size estimation process explained above, the total market has been split into several segments and subsegments. The data triangulation and market breakdown procedures explained below have been implemented, wherever applicable, to complete the overall market engineering process and arrive at the exact statistics for various market segments and subsegments. The data was triangulated by studying various factors and trends from both the demand and supply sides. Along with this, the market size was validated using both, top-down and bottom-up approaches.

Objectives of the Study

  • To define, describe, segment, and forecast the size of the military lighting market based on product, type, end use, and region for the forecast period from 2022 to 2027
  • To forecast the size of various segments of the market with respect to five major regions, namely, North America, Europe, Asia Pacific, the Middle East, and the Rest of the World (RoW), along with the major countries in each of these regions
  • To identify and analyze the key drivers, restraints, opportunities, and challenges influencing the growth of the market
  • To identify opportunities for stakeholders in the market by studying key market and technology trends
  • To analyze competitive developments such as contracts, agreements, acquisitions & partnerships, new product launches & developments, and R&D activities in the market
  • To estimate the procurement of military lighting by different countries to track the market size of military lighting
  • To provide a comprehensive competitive landscape of the market along with an overview of the different strategies adopted by key players to strengthen their position in the market
  • To identify transportation industry trends, market trends, and technology trends currently prevailing in the market
  • To analyze micromarkets1 with respect to individual technological trends and their contribution to the total market
  • To analyze opportunities in the market for stakeholders by identifying key market trends
  • To profile key market players and comprehensively analyze their market share and core competencies2
  • To provide a detailed competitive landscape of the market, along with an analysis of business and strategies such as mergers & acquisitions, partnerships, agreements, and product developments in the military lighting market
  • To identify detailed financial positions, key products, and unique selling points of leading companies in the market

Available Customizations:

Along with market data, MarketsandMarkets offers customizations as per the specific needs of a company. The following customization options are available for the report:

Company Information

  • Detailed analysis and profiling of additional market players (up to 5)
  • Market analysis of additional countries (subject to the data availability)
Custom Market Research Services

We will customize the research for you, in case the report listed above does not meet with your exact requirements. Our custom research will comprehensively cover the business information you require to help you arrive at strategic and profitable business decisions.

Request Customization

Instant Answers with GPT - Ask Now!

Ask real questions. Get complete answers !
Report Code
AS 6529
Published ON
Aug, 2022
Choose License Type
BUY NOW
  • SHARE
X
Request Customization
Speak to Analyst
Speak to Analyst
OR FACE-TO-FACE MEETING
PERSONALIZE THIS RESEARCH
  • Triangulate with your Own Data
  • Get Data as per your Format and Definition
  • Gain a Deeper Dive on a Specific Application, Geography, Customer or Competitor
  • Any level of Personalization
REQUEST A FREE CUSTOMIZATION
LET US HELP YOU!
  • What are the Known and Unknown Adjacencies Impacting the Military Lighting Market
  • What will your New Revenue Sources be?
  • Who will be your Top Customer; what will make them switch?
  • Defend your Market Share or Win Competitors
  • Get a Scorecard for Target Partners
CUSTOMIZED WORKSHOP REQUEST
+1-888-600-6441
  • Call Us
  • +1-888-600-6441 (Corporate office hours)
  • +1-888-600-6441 (US/Can toll free)
  • +44-800-368-9399 (UK office hours)
CONNECT WITH US
ABOUT TRUST ONLINE
©2024 MarketsandMarkets Research Private Ltd. All rights reserved
DMCA.com Protection Status Website Feedback