Mobile Marketing Market by Component (Platform and Services), Channel, Organization Size (SMES and Large Enterprises), Vertical (Retail and Ecommerce, Travel and Logistics, Automotive, and Telecom and IT), and Region - Global Forecast to 2024


Mobile Marketing Market Size
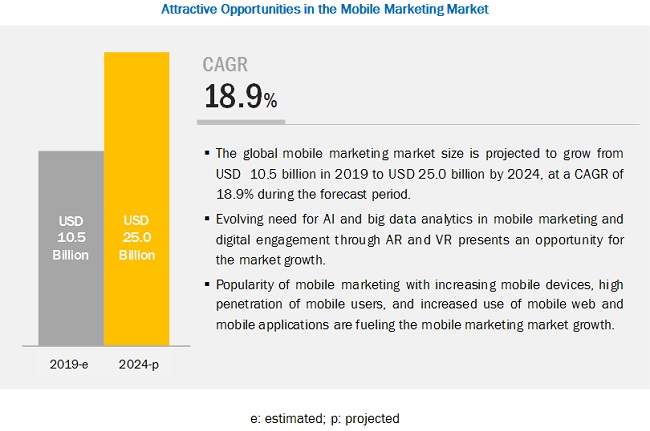
The size of the mobile marketing market is anticipated to increase from USD 10.5 billion in 2019 to USD 25.5 billion by 2024. with a CAGR of 18.9% over the forecast period.
Mobile Marketing Market Growth
The major factors driving the mobile marketing industry include the popularity of mobile marketing with increasing mobile devices, high penetration of mobile users, growth of social media and advertising, and increased use of mobile web and mobile applications.
Services segment to grow at the highest CAGR during the forecast period
Based on component, the services segment of the mobile marketing market is projected to grow at the highest CAGR during the forecast period. The services segment of the mobile marketing industry is expected to have a promising future due to the integration of various marketing applications. Services help organizations in building successful customer relationships by continuously supporting them through their business tenure. They also benefit organizations by enhancing marketing project execution and streamlining marketing operations.
SMEs segment to lead the mobile marketing market in 2019
Based on organization size, the SMEs (Small and Medium Enterprises) segment is projected to lead the mobile marketing market during the forecast period. SMEs in all verticals and regions are now taking advantage of the current mobile technology. Several SMEs already have mobile sites and mobile applications, which make mobile marketing one of the most effective and economical marketing channels for them. They are now shifting from traditional marketing to digital marketing and a majority of their marketing expenditure now goes into digital marketing channels. Marketing through SMS is one of the most cost-effective channels available to the SMEs and is being widely adopted in this user segment. Location-based marketing is another opportunity for SMEs to reach the targeted audience at the right time and place.
Telecom and IT segment to grow at the highest CAGR during the forecast period
Based on vertical, the telecom and IT segment of the mobile marketing market is projected to grow at the highest CAGR during the forecast period. Mobile marketing solutions have been finding their way into the telecom and IT vertical for the last 10 years. Telecommunications companies use mobile marketing as a channel to communicate with their customers to enhance customer loyalty, increase brand awareness, and generate revenue consistently. The ever-changing preferences of customers and increasing usage of the internet, laptops, tablets, and mobile phones mandate telecom service providers to understand customer preferences, behavior, and trends in the IT industry.
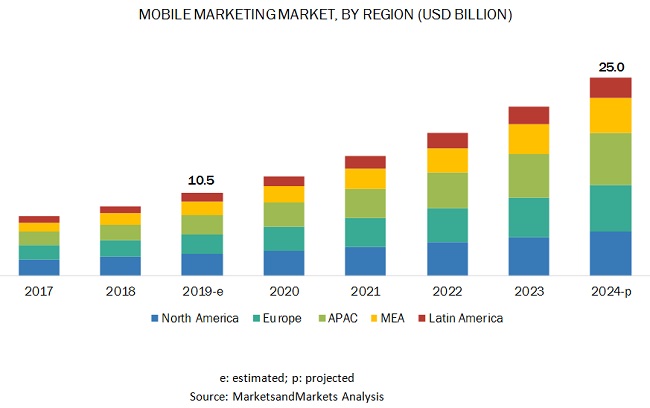
North America to lead the mobile marketing market in 2019
North America is estimated to be the largest revenue contributor to the global mobile marketing market in 2019, and the trend is expected to continue during the forecast period due to the rapid adoption of mobile marketing platform and services among enterprises in this region. North America has been an early adopter and a host to innovative initiatives for advanced technologies. Moreover, there is a significant rise in automated marketing spending by organizations due to increasing competition faced by these organizations to achieve new customers, satisfy old customers, and retain these customers. Most mobile marketing platform vendors, including the major players, have a direct or an indirect presence in this region via distributors, and resellers, such as Adobe, Airship, Braze, Swrve, and Oracle.
In Asia Pacific (APAC), the market is projected to grow at the highest CAGR of 22.1% during the forecast period, owing to the demand for mobile marketing platform and services in countries such as China, Japan, Australia, and the rest of APAC. As in APAC, organizations have started believing that mobile marketing can create a competitive edge over the others, offer better communications between the customer and the company, and help create a strong brand image, leading them to transform from the legacy marketing strategies to mobile marketing.
Key Market Players For Mobile Marketing Market
The major factor expected to hinder the growth of the mobile marketing market is the security and privacy concerns for confidential data and complications in the implementation of mobile marketing platform.
Key market players profiled in this report include Airship (US), Swrve Inc. (US), Vibes (US), Braze, Inc. (US), Adobe (US), Acoustic, L.P. (US), Localytics (US), Oracle (US), Salesforce (US), SAP (Germany), Marketo (US), Pyze Inc. (US), FollowAnalytics (US), Xtremepush (UK), IMI Mobile Private Limited (UK), MoEngage (UK), Punchh (US), Sailthru (US), Leanplum (US), and Netcore Solutions (India). These players have adopted various growth strategies, such as partnerships, agreements, and collaborations; and new product launches and product enhancements to further expand their presence in the mobile marketing market and broaden their customer base.
Scope of Mobile Marketing Market Report
|
Report Metric |
Details |
|
Market value in 2024 |
USD 25.0 Billion |
|
Market value in 2019 |
USD 10.5 Billion |
|
Market growth rate |
18.9% CAGR |
|
Largest Market |
North America |
|
Market size available for years |
2017-2024 |
|
Base year considered |
2018 |
|
Forecast period |
2019-2024 |
|
Segments covered |
Component (Platform and Services), Channel, Organization Size, Vertical, and Region |
|
Regions covered |
North America, Europe, APAC, Latin America, and MEA |
|
Companies covered |
Vendors covered in the mobile marketing market include Airship (US), Swrve Inc. (US), Vibes (US), Braze, Inc. (US), Adobe (US), Acoustic, L.P. (US), Localytics (US), Oracle (US), Salesforce (US), SAP (Germany), Marketo (US), Pyze Inc. (US), FollowAnalytics (US), Xtremepush (UK), IMI Mobile Private Limited (UK), MoEngage (UK Punchh (US), Sailthru (US), Leanplum (US), and Netcore Solutions (India). |
This research report categorizes the mobile marketing market to forecast revenues and analyze trends in each of the following submarkets:
Based on Component
- Platform
- Services
Mobile Marketing Market Based on Channel
- Messaging
- Push notification
- Mobile Emails
- Quick Response (QR) Code
- Location-based Marketing
- In-app Messages
- Mobile Web
- Others
Based on Organization Size
- Small and Medium Enterprises (SMEs)
- Large Enterprises
Mobile Marketing Market Based on Vertical
- Retail and eCommerce
- Travel and Logistics
- Automotive
- BFSI
- Telecom and IT
- Media and Entertainment
- Healthcare
- Government
- Others (includes energy, education, real estate, and utilities and power)
Based on Region
-
North America
- US
- Canada
-
Europe
- UK
- Germany
- Rest of Europe
-
APAC
- China
- Japan
- ANZ
- Rest of APAC
-
MEA
- UAE
- South Africa
- Rest of MEA
-
Latin America
- Brazil
- Mexico
- Rest of Latin America
Key questions addressed by the report
- What are the growth opportunities in the mobile marketing market?
- What is the competitive landscape scenario in the market?
- What are the regulations that are expected to have an impact on the market?
- How have mobile marketing platform and services evolved from traditional technologies?
- What are the dynamics of the market?
To speak to our analyst for a discussion on the above findings, click Speak to Analyst
Table of Contents
1 Introduction (Page No. - 18)
1.1 Objectives of the Study
1.2 Market Definition
1.2.1 Inclusions and Exclusions
1.3 Market Scope
1.3.1 Market Segmentation
1.3.2 Regional Scope
1.3.3 Years Considered for the Study
1.4 Currency
1.5 Stakeholders
2 Research Methodology (Page No. - 21)
2.1 Research Data
2.1.1 Secondary Data
2.1.2 Primary Data
2.1.2.1 Breakdown of Primaries
2.1.2.2 Key Industry Insights
2.2 Data Triangulation
2.3 Market Size Estimation
2.3.1 Top-Down Approach
2.3.2 Bottom-Up Approach
2.4 Market Forecast
2.5 Research Assumptions
2.6 Limitations
3 Executive Summary (Page No. - 27)
4 Premium Insights (Page No. - 32)
4.1 Attractive Opportunities in the Market
4.2 Asia Pacific Mobile Marketing Market, By Component and Country
4.3 Market Major Countries
5 Market Overview and Industry Trends (Page No. - 34)
5.1 Introduction
5.2 Market Dynamics
5.2.1 Drivers
5.2.1.1 Popularity of Mobile Marketing With Increasing Mobile Devices
5.2.1.2 High Penetration of Mobile Users
5.2.1.3 Growth of Social Media and Advertising
5.2.1.4 Increased Use of Mobile Web and Mobile Applications
5.2.2 Restraints
5.2.2.1 Security and Privacy Concerns for Confidential Data
5.2.2.2 Complication in Implementation
5.2.3 Opportunities
5.2.3.1 Evolving Need for AI and Big Data Analytics in Mobile Marketing
5.2.3.2 Digital Engagement Through AR and VR
5.2.3.3 Marketing Through Different Social Media Platforms
5.2.4 Challenges
5.2.4.1 Selection of Relevant Mobile Marketing Techniques and Vendors
5.2.4.2 Understanding Consumer Behavior
5.3 Industry Trends
5.3.1 Technology Innovation, Social, Mobile, Analytics, and Cloud (SMAC)
5.3.2 Case Studies
5.3.2.1 Case Study 1: Gsn Games Takes Mobile Engagement to the Next Level Using Airship
5.3.2.2 Case Study 2: Arnotts Engaged With Púca for Christmas Gifts App With Mobile Vouchers
5.3.2.3 Case Study 3: Condé Nast Uses Adobe Marketing Cloud to Reach Its Core Audiences and Boost Revenue for the Company and Advertisers Through Optimized Content and Experiences
5.3.3 Regulatory Implications
5.3.3.1 Mobile Marketing Association (MMA)
5.3.3.2 Federal Trade Commission (FTC)
6 Mobile Marketing Market By Component (Page No. - 43)
6.1 Introduction
6.2 Platform
6.2.1 Increasing Need to Enhance Mobile Marketing Processes Driving the Growth of Mobile Marketing Platform
6.3 Services
6.3.1 Growing Need for Integrating Mobile Marketing Platform With Other Enterprise Business Applications to Drive the Growth of Mobile Marketing Services
7 Mobile Marketing Market By Channel (Page No. - 47)
7.1 Introduction
7.2 Messaging
7.3 Push Notification
7.4 Mobile Email
7.5 Quick Response Code
7.6 Location-Based Marketing
7.7 In-App Messaging
7.8 Mobile Web
7.9 Others
8 Mobile Marketing Market By Organization Size (Page No. - 50)
8.1 Introduction
8.2 Small and Medium-Sized Enterprises
8.2.1 Need for A Cost-Effective and Comprehensive Solution to Drive the Growth of Market Across Small and Medium-Sized Enterprises
8.3 Large Enterprises
8.3.1 Ability to Adopt Advanced Technologies Driving the Growth of Mobile Marketing in Large Enterprises
9 Mobile Marketing Market By Vertical (Page No. - 54)
9.1 Introduction
9.2 Retail and eCommerce
9.2.1 Increased Adoption of Smartphones and Tablets, and Usage of Mobile Internet Offer Great Opportunities to Retailers
9.3 Travel and Logistics
9.3.1 Mobile Devices Offer Travel Companies Great Marketing Platform to Attract and Retain Customers, and Increase Sales
9.4 Automotive
9.4.1 Mobile Marketing Offers Real-Time and Two-Way Communication to Customers
9.5 Banking, Financial Services, and Insurance
9.5.1 Need to Promote Financial Offerings Driving the Demand for Mobile Marketing in the BFSI Vertical
9.6 Telecom and IT
9.6.1 Advent of Technological Advancements to Boost the Adoption of Mobile Marketing Solutions in the Telecom and IT Vertical
9.7 Media and Entertainment
9.7.1 Increased Need to Enhance Customer Experience Driving the Market Growth in the Media and Entertainment Vertical
9.8 Healthcare
9.8.1 Growing Need to Deliver Personalized and Relevant Content to Prospects Driving the Market Growth in the Healthcare Vertical
9.9 Government
9.9.1 Increased Usage of SMS Communication Channel to Boost the Mobile Marketing Growth in the Government Vertical
9.10 Others
10 Mobile Marketing Market By Region (Page No. - 65)
10.1 Introduction
10.2 North America
10.2.1 United States
10.2.1.1 Presence of Major Key Vendors to Drive the Growth of Market in the US
10.2.2 Canada
10.2.2.1 Growing Adoption of SMAC Technologies to Drive the Growth of Market in Canada
10.3 Europe
10.3.1 United Kingdom
10.3.1.1 Growing Multichannel Marketing and Technological Advancements to Drive the Growth of Market in the UK
10.3.2 Germany
10.3.2.1 Growing Need for Providing Enhanced Customer Experience to Drive the Growth of Market in Germany
10.3.3 Rest of Europe
10.4 Asia Pacific
10.4.1 China
10.4.1.1 Rising Adoption of Mobile Devices and Increasing Internet Penetration to Encourage Enterprises to Adopt Mobile Marketing in China
10.4.2 Japan
10.4.2.1 High Penetration of Information Technology Helps Change Customer Opinions Regarding Mobile Marketing
10.4.3 Australia and New Zealand
10.4.3.1 Rise in Digitalization Among Enterprises to Drive the Mobile Marketing Market Growth in ANZ
10.4.4 Rest of Asia Pacific
10.5 Middle East and Africa
10.5.1 United Arab Emirates
10.5.1.1 Rise in the Adoption of Cloud Services to Drive the Growth of Market in UAE
10.5.2 South Africa
10.5.2.1 Growing Need for Maximizing Roi to Drive the Growth of Market in South Africa
10.5.3 Rest of Middle East and Africa
10.6 Latin America
10.6.1 Brazil
10.6.1.1 Growing Adoption of the Internet to Drive the Growth of Market in Brazil
10.6.2 Mexico
10.6.2.1 Increased Awareness Among Enterprises to Smoothen Marketing Activities Driving the Growth of Market in Mexico
10.6.3 Rest of Latin America
11 Competitive Landscape (Page No. - 109)
11.1 Competitive Leadership Mapping
11.1.1 Visionary Leaders
11.1.2 Innovators
11.1.3 Dynamic Differentiators
11.1.4 Emerging Companies
11.2 Strength of Product Portfolio
11.3 Business Strategy Excellence
11.4 Key Players in the Market, 2019
12 Company Profiles (Page No. - 113)
12.1 Airship
(Business Overview, Platforms Offered, Recent Developments, and SWOT Analysis)*
12.2 Swrve
12.3 Vibes
12.4 Adobe
12.5 Braze
12.6 Acoustic
12.7 Localytics
12.8 Oracle
12.9 Salesforce
12.10 SAP
12.11 Marketo
12.12 Pyze
12.13 FollowAnalytics
12.14 Xtremepush
12.15 Imimobile
12.16 MoEngage
12.17 Punchh
12.18 Sailthru
12.19 Leanplum
12.20 Netcore Solutions
*Details on Business Overview, Platforms Offered, Recent Developments, and SWOT Analysis Might Not Be Captured in Case of Unlisted Companies.
12.21 Right-To-Win
13 Appendix (Page No. - 147)
13.1 Industry Experts
13.2 Discussion Guide
13.3 Knowledge Store: Marketsandmarkets’ Subscription Portal
13.4 Available Customizations
13.5 Related Reports
13.6 Author Details
List of Tables (109 Tables)
Table 1 Factor Analysis
Table 2 Mobile Marketing Market Size, By Component, 2017–2024 (USD Million)
Table 3 Platform: Market Size By Region, 2017–2024 (USD Million)
Table 4 Services: Market Size By Region, 2017–2024 (USD Million)
Table 5 Mobile Marketing Market Size, By Organization Size, 2017–2024 (USD Million)
Table 6 Small and Medium-Sized Enterprises: Market Size By Region, 2017–2024 (USD Million)
Table 7 Large Enterprises: Market Size By Region, 2017–2024 (USD Million)
Table 8 Mobile Marketing Market Size By Vertical, 2017–2024 (USD Million)
Table 9 Retail and eCommerce: Market Size By Region, 2017–2024 (USD Million)
Table 10 Travel and Logistics: Market Size By Region, 2017–2024 (USD Million)
Table 11 Automotive: Mobile Marketing Market Size, By Region, 2017–2024 (USD Million)
Table 12 Banking, Financial Services, and Insurance: Market Size By Region, 2017–2024 (USD Million)
Table 13 Telecom and IT: Market Size By Region, 2017–2024 (USD Million)
Table 14 Media and Entertainment: Market Size By Region, 2017–2024 (USD Million)
Table 15 Healthcare: Market Size By Region, 2017–2024 (USD Million)
Table 16 Government: Market Size By Region, 2017–2024 (USD Million)
Table 17 Others: Market Size By Region, 2017–2024 (USD Million)
Table 18 Mobile Marketing Market Size, By Region, 2017–2024 (USD Million)
Table 19 North America: Market Size By Component, 2017–2024 (USD Million)
Table 20 North America: Market Size By Organization Size, 2017–2024 (USD Million)
Table 21 North America: Market Size By Vertical, 2017–2024 (USD Million)
Table 22 North America: Mobile Marketing Market Size, By Country, 2017–2024 (USD Million)
Table 23 North America: Platform Market Size, By Country, 2017–2024 (USD Million)
Table 24 North America: Services Market Size, By Country, 2017–2024 (USD Million)
Table 25 North America: Small and Medium-Sized Enterprises Market Size, By Country, 2017–2024 (USD Million)
Table 26 North America: Large Enterprises Market Size, By Country, 2017–2024 (USD Million)
Table 27 North America: Retail and eCommerce Market Size, By Country, 2017–2024 (USD Million)
Table 28 North America: Travel and Logistics Market Size, By Country, 2017–2024 (USD Million)
Table 29 North America: Automotive Market Size, By Country, 2017–2024 (USD Million)
Table 30 North America: Banking, Financial Services, and Insurance Market Size, By Country, 2017–2024 (USD Million)
Table 31 North America: Telecom and IT Market Size, By Country, 2017–2024 (USD Million)
Table 32 North America: Media and Entertainment Market Size, By Country, 2017–2024 (USD Million)
Table 33 North America: Healthcare Market Size, By Country, 2017–2024 (USD Million)
Table 34 North America: Government Market Size, By Country, 2017–2024 (USD Million)
Table 35 North America: Others Market Size, By Country, 2017–2024 (USD Million)
Table 36 United States: Market Size By Component, 2017–2024 (USD Million)
Table 37 United States: Market Size By Organization Size, 2017–2024 (USD Million)
Table 38 United States: Market Size By Vertical, 2017–2024 (USD Million)
Table 39 Canada: Mobile Marketing Market Size, By Component, 2017–2024 (USD Million)
Table 40 Canada: Market Size By Organization Size, 2017–2024 (USD Million)
Table 41 Canada: Market Size By Vertical, 2017–2024 (USD Million)
Table 42 Europe: Market Size By Component, 2017–2024 (USD Million)
Table 43 Europe: Market Size By Organization Size, 2017–2024 (USD Million)
Table 44 Europe: Market Size By Vertical, 2017–2024 (USD Million)
Table 45 Europe: Market Size By Country, 2017–2024 (USD Million)
Table 46 Europe: Platform Market Size, By Country, 2017–2024 (USD Million)
Table 47 Europe: Services Market Size, By Country, 2017–2024 (USD Million)
Table 48 Europe: Small and Medium-Sized Enterprises Market Size, By Country, 2017–2024 (USD Million)
Table 49 Europe: Large Enterprises Market Size, By Country, 2017–2024 (USD Million)
Table 50 Europe: Retail and eCommerce Market Size, By Country, 2017–2024 (USD Million)
Table 51 Europe: Travel and Logistics Market Size, By Country, 2017–2024 (USD Million)
Table 52 Europe: Automotive Market Size, By Country, 2017–2024 (USD Million)
Table 53 Europe: Banking, Financial Services, and Insurance Market Size, By Country, 2017–2024 (USD Million)
Table 54 Europe: Telecom and IT Market Size, By Country, 2017–2024 (USD Million)
Table 55 Europe: Media and Entertainment Market Size, By Country, 2017–2024 (USD Million)
Table 56 Europe: Healthcare Market Size, By Country, 2017–2024 (USD Million)
Table 57 Europe: Government Market Size, By Country, 2017–2024 (USD Million)
Table 58 Europe: Others Market Size, By Country, 2017–2024 (USD Million)
Table 59 United Kingdom: Market Size By Component, 2017–2024 (USD Million)
Table 60 United Kingdom : Market Size By Organization Size, 2017–2024 (USD Million)
Table 61 United Kingdom : Market Size By Vertical, 2017–2024 (USD Million)
Table 62 Germany: Mobile Marketing Market Size, By Component, 2017–2024 (USD Million)
Table 63 Germany: Market Size By Organization Size, 2017–2024 (USD Million)
Table 64 Germany: Market Size By Vertical, 2017–2024 (USD Million)
Table 65 Rest of Europe: Mobile Marketing Market Size, By Component, 2017–2024 (USD Million)
Table 66 Rest of Europe: Market Size By Organization Size, 2017–2024 (USD Million)
Table 67 Rest of Europe: Market Size By Vertical, 2017–2024 (USD Million)
Table 68 Asia Pacific: Mobile Marketing Market Size, By Component, 2017–2024 (USD Million)
Table 69 Asia Pacific: Market Size By Organization Size, 2017–2024 (USD Million)
Table 70 Asia Pacific: Market Size By Vertical, 2017–2024 (USD Million)
Table 71 Asia Pacific: Market Size By Country, 2017–2024 (USD Million)
Table 72 China: Mobile Marketing Market Size, By Component, 2017–2024 (USD Million)
Table 73 China: Market Size By Organization Size, 2017–2024 (USD Million)
Table 74 China: Market Size By Vertical, 2017–2024 (USD Million)
Table 75 Japan: Market Size By Component, 2017–2024 (USD Million)
Table 76 Japan: Market Size By Organization Size, 2017–2024 (USD Million)
Table 77 Japan: Market Size By Vertical, 2017–2024 (USD Million)
Table 78 Australia and New Zealand: Mobile Marketing Market Size, By Component, 2017–2024 (USD Million)
Table 79 Australia and New Zealand: Market Size By Organization Size, 2017–2024 (USD Million)
Table 80 Australia and New Zealand: Market Size By Vertical, 2017–2024 (USD Million)
Table 81 Rest of Asia Pacific: Mobile Marketing Market Size, By Component, 2017–2024 (USD Million)
Table 82 Rest of Asia Pacific: Market Size By Organization Size, 2017–2024 (USD Million)
Table 83 Rest of Asia Pacific: Market Size By Vertical, 2017–2024 (USD Million)
Table 84 Middle East and Africa: Mobile Marketing Market Size, By Component, 2017–2024 (USD Million)
Table 85 Middle East and Africa: Market Size By Organization Size, 2017–2024 (USD Million)
Table 86 Middle East and Africa: Market Size By Vertical, 2017–2024 (USD Million)
Table 87 Middle East and Africa: Market Size By Country, 2017–2024 (USD Million)
Table 88 United Arab Emirates: Mobile Marketing Market Size, By Component, 2017–2024 (USD Million)
Table 89 United Arab Emirates: Market Size By Organization Size, 2017–2024 (USD Million)
Table 90 United Arab Emirates: Market Size By Vertical, 2017–2024 (USD Million)
Table 91 South Africa: Mobile Marketing Market Size, By Component, 2017–2024 (USD Million)
Table 92 South Africa: Market Size By Organization Size, 2017–2024 (USD Million)
Table 93 South Africa: Market Size By Vertical, 2017–2024 (USD Million)
Table 94 Rest of Middle East and Africa: Mobile Marketing Market Size, By Component, 2017–2024 (USD Million)
Table 95 Rest of Middle East and Africa: Market Size By Organization Size, 2017–2024 (USD Million)
Table 96 Rest of Middle East and Africa: Market Size By Vertical, 2017–2024 (USD Million)
Table 97 Latin America: Mobile Marketing Market Size, By Component, 2017–2024 (USD Million)
Table 98 Latin America: Market Size By Organization Size, 2017–2024 (USD Million)
Table 99 Latin America: Market Size By Vertical, 2017–2024 (USD Million)
Table 100 Latin America: Market Size By Country, 2017–2024 (USD Million)
Table 101 Brazil: Mobile Marketing Market Size, By Component, 2017–2024 (USD Million)
Table 102 Brazil: Market Size By Organization Size, 2017–2024 (USD Million)
Table 103 Brazil: Market Size By Vertical, 2017–2024 (USD Million)
Table 104 Mexico: Mobile Marketing Market Size, By Component, 2017–2024 (USD Million)
Table 105 Mexico: Market Size By Organization Size, 2017–2024 (USD Million)
Table 106 Mexico: Market Size By Vertical, 2017–2024 (USD Million)
Table 107 Rest of Latin America: Mobile Marketing Market Size, By Component, 2017–2024 (USD Million)
Table 108 Rest of Latin America: Mobile Marketing Market Size, By Organization Size, 2017–2024 (USD Million)
Table 109 Rest of Latin America: Mobile Marketing Market Size, By Vertical, 2017–2024 (USD Million)
List of Figures (28 Figures)
Figure 1 Global Mobile Marketing Market: Research Design
Figure 2 Breakdown of Primary Interviews: By Company, Designation, and Region
Figure 3 Mobile Marketing Market: Top-Down and Bottom-Up Approaches
Figure 4 Market Size, 2019–2024
Figure 5 Platform Segment to Lead the Mobile Marketing Market in 2019
Figure 6 Large Enterprises Segment to have the Fastest Growth Rate During the Forecast Period
Figure 7 Retail and eCommerce Segment to Lead the Market in 2019
Figure 8 Mobile Marketing Market: Regional Snapshot
Figure 9 Increased Use of Mobile Web and Mobile Applications to Drive the Market Growth During the Forecast Period
Figure 10 Platform Segment and China to Account for the Highest Market Shares in Asia Pacific in 2019
Figure 11 Australia and New Zealand and China to Grow at the Fastest Rate During the Forecast Period
Figure 12 Mobile Marketing Market: Drivers, Restraints, Opportunities, and Challenges
Figure 13 Services Segment to Grow at A Higher CAGR During the Forecast Period
Figure 14 Large Enterprises Segment to Grow at A Higher CAGR During the Forecast Period
Figure 15 Telecom and IT Vertical to Grow at the Highest CAGR During the Forecast Period
Figure 16 North America to Hold the Highest Market Share During the Forecast Period
Figure 17 North America: Market Snapshot
Figure 18 Asia Pacific: Market Snapshot
Figure 19 Mobile Marketing Market: (Global) Competitive Leadership Mapping
Figure 20 Airship: SWOT Analysis
Figure 21 Swrve: SWOT Analysis
Figure 22 Vibes: SWOT Analysis
Figure 23 Adobe: Company Snapshot
Figure 24 Adobe: SWOT Analysis
Figure 25 Braze: SWOT Analysis
Figure 26 Oracle: Company Snapshot
Figure 27 Salesforce: Company Snapshot
Figure 28 SAP: Company Snapshot
The study involved 4 major activities to estimate the current size of the mobile marketing market. An exhaustive secondary research was done to collect information on the mobile marketing industry. The next step was to validate these findings, assumptions, and sizing with industry experts across the value chain using primary research. Both top-down and bottom-up approaches were employed to estimate the complete market size. Thereafter, the market breakup and data triangulation procedures were used to estimate the size and shares of the segments and subsegments of the mobile marketing market.
Secondary Research
In the secondary research process, various secondary sources, such as D&B Hoovers, Bloomberg BusinessWeek, and Dun & Bradstreet, were referred to identify and collect information for this study. These secondary sources included annual reports; press releases; and investor presentations of companies, whitepapers, certified publications; and articles by recognized authors; gold standard and silver standard websites; regulatory bodies; trade directories; and databases.
Primary Research
The mobile marketing market comprises several stakeholders, such as mobile marketing solution providers, consumers, Mobile Network Operators (MNOs), mobile service providers, Operations Support Systems (OSS)/Business Support Systems (BSS) solution providers, software developers and cloud computing, advertising agents, content providers, and mobile applications developers, Information Technology (IT) service providers, consultants/consultancies/advisory firms, and training providers. The demand side of the mobile marketing market consists of all the firms operating in several industry verticals. The supply side includes mobile marketing providers, offering mobile marketing platform and services. Various primary sources from both the supply and demand sides of the market were interviewed to obtain qualitative and quantitative information. Given below is the breakup of the primary respondents:
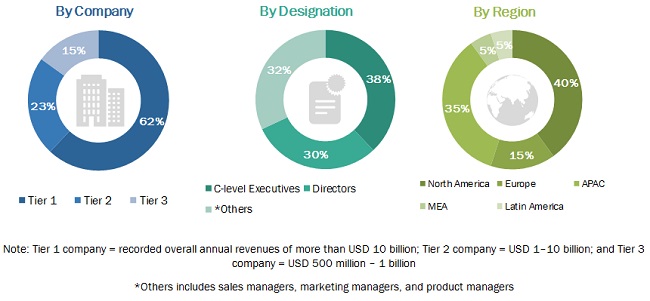
To know about the assumptions considered for the study, download the pdf brochure
Market Size Estimation
The top-down and bottom-up approaches were used to estimate and validate the size of the global mobile marketing market and various other dependent submarkets in the overall market. An exhaustive list of all the vendors who offer mobile marketing platforms and services in the mobile marketing market was prepared while using the top-down approach. The market share for all the vendors in the market was estimated through annual reports, press releases, funding, investor presentations, paid databases, and primary interviews. Each vendor was evaluated based on its component (platform and service). The aggregate of all companies’ revenues was extrapolated to reach the overall market size.
Further, each subsegment was studied and analyzed for its global market size and regional penetration. The markets were triangulated through both primary and secondary research. The primary procedure included extensive interviews for key insights from the industry leaders, such as Chief Executive Officers (CEOs), Vice Presidents (VPs), directors, and marketing executives.
Data Triangulation
After arriving at the overall market size using the market size estimation processes as explained above, the market was split into several segments and subsegments. The data triangulation and market breakup procedures were employed, wherever applicable, to complete the overall market engineering process and arrive at the exact statistics of each market segment and subsegment. The data was triangulated by studying various factors and trends from both the demand and supply sides.
Report Objectives
- To determine and forecast the global mobile marketing market by component (platform and services), channel, organization size, vertical, and region from 2019 to 2024, and analyze the various macroeconomic and microeconomic factors that affect the market growth
- To forecast the size of the market segments with respect to 5 main regions, namely, North America, Europe, Asia Pacific (APAC), Latin America, and the Middle East and Africa (MEA)
- To provide detailed information about the major factors influencing the growth of the mobile marketing market (drivers, restraints, opportunities, and challenges)
- To analyze each submarket with respect to individual growth trends, prospects, and contributions to the overall market
- To analyze the opportunities in the market for stakeholders by identifying the high-growth segments of the mobile marketing market
- To profile the key market players, provide a comparative analysis based on business overviews, regional presence, product offerings, business strategies, and key financials, and illustrate the competitive landscape of the market
- To track and analyze competitive developments, such as mergers and acquisitions, new product/service launches, business expansions, partnerships and collaborations, and Research and Development (R&D) activities in the market
Available customizations
Along with the market data, MarketsandMarkets offers customizations as per the company’s specific needs. The following customization options are available for the report:
Company information
- Detailed analysis and profiling of additional market players (Up to 5)


Growth opportunities and latent adjacency in Mobile Marketing Market