Mobility as a Service Market

Mobility as a Service Market by Service (Ride-Hailing, Car Sharing, micro-mobility, Bus, Train), Solution, Transportation, Vehicle, OS, Business Model, Payment (Subscription, PAYG), Commute (Daily, Last Mile, Occasional) Region - Global Forecast to 2030

Report Code: AT 7286 Aug, 2023, by marketsandmarkets.com

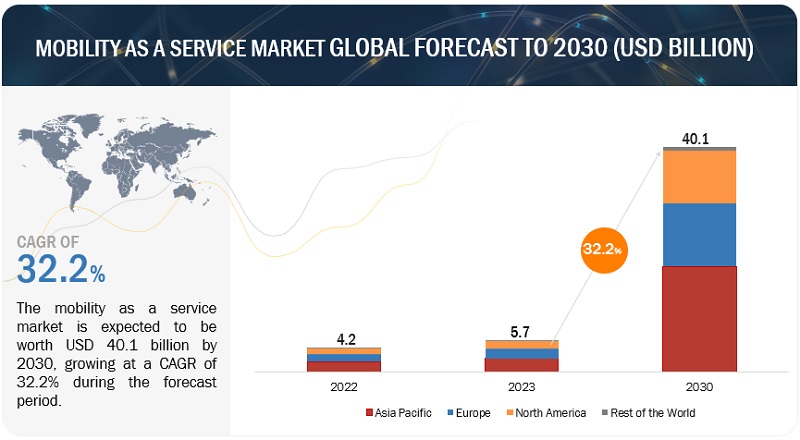
[218 Pages Report] The global mobility as a service market size is valued at USD 5.7 billion in 2023 and is expected to reach USD 40.1 billion by 2030, at a CAGR of 32.2% over the forecast period. With rapid urbanization, congestion and traffic-related challenges are increasing. MaaS offers a solution by providing users with multimodal transportation options, which in turn reduces the number of private vehicles on the road, and alleviates traffic congestion. In most cases, these services are flexible and highly customized per independent user.  Faster internet connectivity, falling vehicle ownership, and the need to reduce traffic congestion and vehicular emissions will fuel the demand for seamless MaaS applications for end-to-end multimodal transport solutions.
Mobility as a Service Market

To know about the assumptions considered for the study, Request for Free Sample Report
Mobility as a Service Market

To know about the assumptions considered for the study, download the pdf brochure

Mobility as a Service Market Dynamics

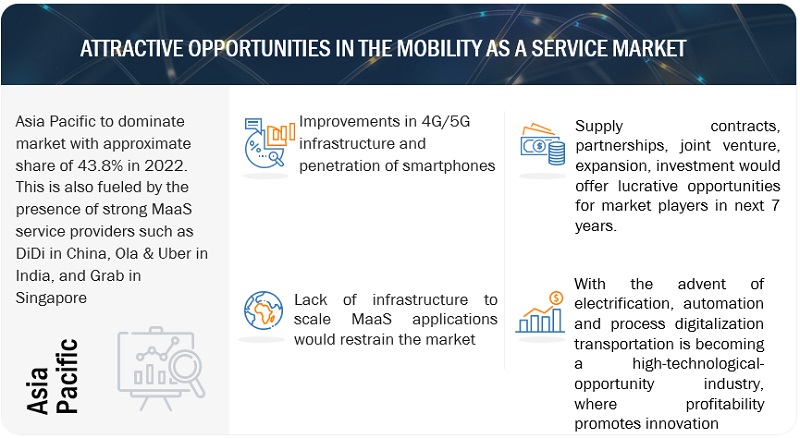
Driver: Improvements in 4G/5G infrastructure and penetration of smartphones

As an internet-enabled service, connectivity is a basic requirement for MaaS. According to the International Telecommunication Union, by the end of 2023, an estimated 64.4% of the global population, or 5.16 billion people, will be using the Internet. Smartphones are vital infrastructure for new mobility models since mobility services like ride-sharing run on smartphones and require good connectivity. Over the last few years, smartphone use has increased significantly across the world, with developed countries accounting for around 80% of smartphone ownership.

5G network and better telecom infrastructure are expected to pave the way for a revolution in cities and in inter-city mobility. Wireless communication technologies (such as DSRC) can help improve traffic safety and increase traffic flow throughput. With onboard units (OBU), connected and automated vehicles (CAVs) can reduce the driver's perception-reaction time and improve safety. Vehicular communication can enable CAVs to collect information from other vehicles and roadside units (RSUs) and coordinate with other CAVs to control and manage the platoon, such as merging, splitting, and maintaining a particular gap. The ongoing development of OBU, RSU, etc., enables and enhances the MaaS of vehicle platooning and would require better and faster telecom infrastructure. Hence, the increasing penetration of smartphones with efficient telecom infrastructure will not only assist vehicle platooning for MaaS but also assist in seamless navigation and payment services through MaaS mobile applications

Restraint: Lack of infrastructure to scale MaaS applications

For MaaS to work, a user must be able to access all available transport modalities on one application. This application needs to host a variety of mobility operators and transport companies with their unique pricing and conditions of service. Mobility as a service, at least in its present form, has little commercial sustainability and will probably not scale due to the complex software involved and difficulties in managing data collected and settling financials. While some operators have the capacity to develop their own software, many cannot. The differences in approach to the software involved, depending on the objectives of the operator, create a disjointed experience for the user and may lead to legal and ethical questions being raised about the handling of data. MaaS pilots around the world have not yet achieved the full set of goals foundational to the idea of MaaS, despite the enthusiasm of municipalities and transport professionals, as well as the proliferation of user apps. Aggregation of mobility services offers journey planning, fare determination, fare payment, and ticketing in one service and subsequently splits the revenue generated by the platform between the transportation providers on the platform.

To be attractive and draw customers away from the car-ownership model, MaaS players must achieve a range of services and options for users at scale, nudging them where necessary to make optimal choices for their personal needs. Stakeholders must thus have a trustworthy partnership with public transport operators, who have much to lose should their assets become under-utilized.

The increased complexity of the software used in developing the application, the lack of a regulatory structure to facilitate the integration of public transport authorities with private transportation providers, and poor infrastructure for payment settlement and ticketing solutions restrict the ability of a MaaS platform to scale; this is likely to stunt the growth of the MaaS market

Opportunities: Inclusion of on-demand ferry and freight services

Urban transportation systems are usually run by state-owned companies, while intercity transport is mostly run by private entities. Thus, pricing for urban transportation is not flexible in general, while ferries (and airlines as well) adopt flexible pricing schemes based on modern revenue-management techniques. With the advent of electrification, automation, and process digitalization, transportation is becoming a high-technological-opportunity industry where profitability promotes innovation. These principles easily apply to MaaS and, more specifically, MaaS in the ferry industry.

In the urban context, mobility is largely based on transport mode ownership. Hence, MaaS aspires to transform the existing asset ownership model into a subscription-based mobility model. However, in the case of sea passenger transportation, very few people own a vehicle (i.e., a ship/catamaran/yacht, etc). Consequently, for sea trips, the main objective of MaaS is to fill the need for an integrated system that offers different transport solutions together and consolidates trip planning and ticketing for every part of the total trip.

MaaS application providers can extend their services in the commercial freight segment as well. Their capability to connect users to on-demand transportation allows them to help supply chain players with their load management. Using MaaS applications can benefit supply chain stakeholders by reducing their overall cost and helping them lower supply chain emissions.

MaaS is also used in Freight Brokering, in which shippers and carriers connect on-demand to ship-specific loads. This involves the integration of different transport modes and services to optimize the movement of goods, making freight logistics more efficient, cost-effective, and sustainable. Existing players in this area include Transfix, Convoy, and Uber Freight, which provide apps that serve as an aggregated marketplace.

Thus, there is a huge opportunity for MaaS application providers to integrate on-demand ferry and freight services into their service offerings to open up new revenue streams.

Challenges: Difficulty in integrating ticketing and payment systems

In order to accomplish complete implementation of MaaS it is important to integrate payment of all the transport modes used in a single app. Thus, the user can manage the entire transportation experience through the MaaS app instead of being redirected to another app or another external system to pay for the ticket. The involvement of different ticketing and payment gateways and the lack of an account-based system has proved to be inconvenient for users, deterring them from adopting MaaS applications.

Seamless partner settlements and financial management are important to encourage a critical mass of operators to participate in a single MaaS platform. The higher the number of transportation providers, the greater the appeal of the application for users.

Sometimes public transport systems have physical barriers and require a ticket validation for access. For validation by MaaS applications, such public transport systems must facilitate the scanning of smartphones. Due to the involvement of multiple stakeholders, such as the payment gateway, ticket verification structures, and financial settlement parties, MaaS application providers are facing logistical and regulatory challenges in integrating a seamless journey planning and ticketing experience for their users.

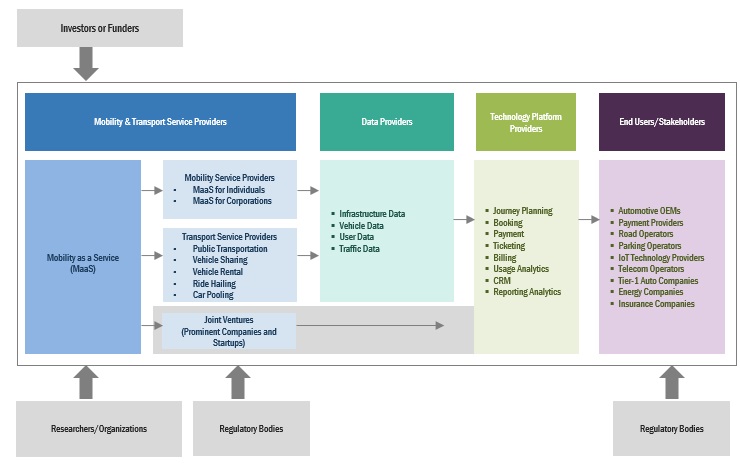
Mobility as a Service Market Ecosystem
Mobility as a Service Market

B2B to dominate the revenue generation business model.

A business-to-business (B2B) model is one in which a business deals in commercial transactions with another business. B2B mobility sharing allows the sharing of mobility services with other businesses to reduce vehicle parking space and the number of fleets by enabling car-sharing services within an organization; this helps to lower traffic congestion and emission from vehicles. The utilization of B2B mobility services improves business processes and results in higher employee satisfaction with improved productivity of the workforce. Major service sector regions like the US and Europe thus have a dominant share in the segment. IoMob (Spain) is the first B2B player to develop and launch a MaaS solution that simultaneously offers intercity mobility travel coupled with intracity and micro-mobility services. For instance, for the Renfe project in Spain, IoMob integrated Renfe’s high-speed and suburban rail service between Madrid and Barcelona with a range of services such as taxis and ride-hailing (Cabify), bike sharing, and car sharing. Europe and North America are expected to drive the B2B business model in the market for mobility as a service, while the Rest of the World is projected to be the fastest-growing regional market. Europe and North America were estimated to account for approximately 71% of the market in 2021. Key players operating in the B2B mobility sharing market include Car2go (Germany), Lyft (US), Sixt (Germany), and Uber (US).

Technology Platforms solutions leads the mobility as a service market in terms of value.

Mobility as a Service (MaaS) technology platforms play a crucial role in enabling the seamless integration of various transportation services and modes into a single, user-friendly interface. The technology platform is basically an app that serves as an open platform for integrated mobility. The purpose of this platform is to facilitate the opening up, interoperability, and utilization of existing services to bring them together and make them accessible. The technology platforms segment in Europe was estimated to hold approximately 38% of the market in 2022. The region is a major contributor to the MaaS sector because of the presence of prominent players such as Moovit (US), Citymapper (UK), and MaaS Global (Finland). Moovit relies on big data technology and released public transit trends during the pandemic, thus promoting the use of technology platforms to refine its services.

Asia Pacific region holds the largest market share in the mobility as a service market in terms of value.

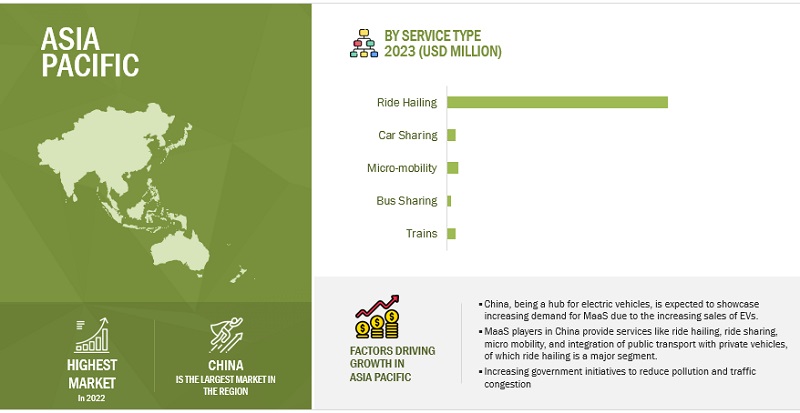
Asia Pacific owing to its large population will hold a significant share of the MaaS market. The region is a growing market for mobility as a service, with China (a global hub for EVs) and Japan (an important automotive hub with a focus on autonomous vehicles) being the major countries driving growth. The presence of prominent ride-sharing providers, MaaS applications, and automotive OEMs such as Uber, Grab, Didi, Toyota, Hyundai, and Honda are expected to prompt product development and push automakers to adopt the technology in their models. A high population growth rate in the region, as well as increasing urbanization, have intensified the need for efficient transportation. Developing countries in the Asia Pacific, especially India, and Indonesia, are projected to experience significant growth in urban transportation, while most other countries are also shifting their focus to smart personal mobility to reduce travel time and congestion. China, being a hub for electric vehicles, is expected to showcase increasing demand for MaaS due to the increasing sales of EVs. The Asia Pacific market is also expected to be driven by the emergence of MaaS in Singapore, Indonesia, and India.

Asia Pacific: Mobility as a Service Market
Mobility as a Service Market Size, and Share

Key Market Players

The global mobility as a service market is led by established players, such as Moovit (Israel), MaaS Global (Finland), Citymapper (UK), FOD Mobility UK Ltd. (UK), and SkedGo (Australia), all of which adopted several strategies to gain traction in the market.

Get online access to the report on the World's First Market Intelligence Cloud

  • Easy to Download Historical Data & Forecast Numbers
  • Company Analysis Dashboard for high growth potential opportunities
  • Research Analyst Access for customization & queries
  • Competitor Analysis with Interactive dashboard
  • Latest News, Updates & Trend analysis
Request Sample

Scope of the Report

Report Attribute

Details

 The base year for estimation

2022

Forecast period

2023 - 2030

Market Growth forecast 

USD 40.1 Billion by 2030 from USD 5.7 Billion in 2023 at 32.2% CAGR

Companies

  • Citymapper (UK)
  • MaaS Global (Helsinki)
  • Skedgo (Australia)
  • FOD Mobility UK Ltd. (UK)
  • Moovit (Israel)

Segments Covered

By Service Type, By Business Model, By Solution Type, Transportation type, Vehicle Type, Application Type, Operating Systems, Propulsion Type, Payment type, Commute type

Region

Asia Pacific (China, Japan, Singapore, Indonesia, Australia, India), North America (US, Canada, Mexico), Europe (Germany, France, Finland, Spain, Netherlands, Italy, Russia, UK, Turkey), Rest of the world (Brazil, South Africa)

The study segments mobility as a service market based on By Service Type, By Business Model, By Solution Type, Transportation type, Vehicle Type, Application Type, Operating Systems, Propulsion Type, Payment type, Commute type, and the region at the regional and global level.

By Service

  • Ride-Hailing
  • Car Sharing
  • Micro-Mobility
  • Bus Sharing
  • Train Services

By Business Model

  • Business-To-Business
  • Business-To-Consumer
  • Peer-To-Peer

By Solution type

  • Technology Platforms
  • Payment Engines
  • Navigation Solutions
  • Telecom Connectivity Providers
  • Ticketing Solutions
  • Insurance Services

By Transporation type

  • Private
  • Public

By Vehicle type

  • Buses
  • Four-Wheelers
  • Micro-Mobility
  • Trains

By Application type

  • Personalized Application Services
  • Journey Management
  • Journey Planning
  • Flexible Payments & Transactions

By Operating System

  • Android
  • iOS
  • Others

By Propulsion Type

  • ICE
  • EV
  • Hybrid electric
  • CNG/LPG

By Payment Type

  • Subscription
  • Pay-as-you-go

By Commute Type

  • Daily
  • Last mile connectivity
  • Occasional

By Region

  • North America
  • Europe
  • Asia Pacific
  • RoW

Recent Developments

  • Moovit, in November 2022, announced a new feature enabling commuters to decrease uncertainty and stress. The feature will allow Moovit users to follow their transit line’s movements along the map in real time for an additional layer of reliable information on route progress. Available for buses, trains, trams, subways, ferries, and even cable cars with GPS tracking, the feature will initially roll out in more than 220 cities across 38 countries.
  • In October 2022, Cycling SDK by Citymapper helped integrate cycle routing and turn-by-turn navigation instantly, with just a few lines of code. SDK is designed to integrate seamlessly with the customer’s product and allows the configuration of colors, fonts, and icons to match the look and feel; it offers a choice of a range of features and details to match the use case.
  • In October 2022, SkedGo announced its support for the Leicester Buses Partnership in the UK. This integration aims to provide travelers with personalized, door-to-door bus trip planning based on their preferences. Additionally, it serves as a platform to highlight and encourage the utilization of various local bus travel choices available in the area.

Frequently Asked Questions (FAQ):

To speak to our analyst for a discussion on the above findings, click Speak to Analyst

TABLE OF CONTENTS
 
1 INTRODUCTION (Page No. - 23)
    1.1 OBJECTIVES 
    1.2 MARKET DEFINITION 
           1.2.1 ADDITIONAL DEFINITIONS/TERMS
    1.3 INCLUSIONS & EXCLUSIONS 
    1.4 MARKET SCOPE 
           FIGURE 1 MARKET SEGMENTATION: MOBILITY AS A SERVICE MARKET
           1.4.1 YEARS CONSIDERED
    1.5 CURRENCY 
    1.6 SUMMARY OF CHANGES 
    1.7 LIMITATIONS 
    1.8 STAKEHOLDERS 
 
2 RESEARCH METHODOLOGY (Page No. - 29)
    2.1 RESEARCH DATA 
           FIGURE 2 MOBILITY AS A SERVICE MARKET: RESEARCH DESIGN
           FIGURE 3 RESEARCH DESIGN MODEL
    2.2 SECONDARY DATA 
           2.2.1 KEY SECONDARY SOURCES
           2.2.2 KEY DATA FROM SECONDARY SOURCES
           2.2.3 PRIMARY DATA
                    FIGURE 4 BREAKDOWN OF PRIMARY INTERVIEWS
           2.2.4 SAMPLING TECHNIQUES & DATA COLLECTION METHODS
           2.2.5 PRIMARY PARTICIPANTS
    2.3 MARKET SIZE ESTIMATION 
           2.3.1 BOTTOM-UP APPROACH
                    FIGURE 5 BOTTOM-UP APPROACH: MOBILITY AS A SERVICE MARKET
           2.3.2 TOP-DOWN APPROACH
                    FIGURE 6 TOP-DOWN APPROACH: MOBILITY AS A SERVICE MARKET
    2.4 MARKET BREAKDOWN AND DATA TRIANGULATION 
           FIGURE 7 DATA TRIANGULATION
    2.5 FACTOR ANALYSIS 
           2.5.1 REGIONAL ECONOMY IMPACT ANALYSIS
           2.5.2 FACTOR ANALYSIS FOR MARKET SIZING: DEMAND- AND SUPPLY-SIDE
    2.6 ASSUMPTIONS AND RISK ASSESSMENT 
    2.7 RESEARCH LIMITATIONS 
 
3 EXECUTIVE SUMMARY (Page No. - 40)
    3.1 REPORT SUMMARY 
           FIGURE 8 MOBILITY AS A SERVICE MARKET OUTLOOK
           FIGURE 9 MOBILITY AS A SERVICE MARKET, BY REGION
 
4 PREMIUM INSIGHTS (Page No. - 43)
    4.1 ATTRACTIVE OPPORTUNITIES FOR MARKET PLAYERS 
           FIGURE 10 INCREASING SMART CITY INITIATIVES WORLDWIDE TO DRIVE MARKET
    4.2 MOBILITY AS A SERVICE MARKET, BY SOLUTION TYPE 
           FIGURE 11 TECHNOLOGY PLATFORMS TO DOMINATE MARKET DURING FORECAST PERIOD
    4.3 MOBILITY AS A SERVICE MARKET, BY SERVICE TYPE 
           FIGURE 12 RIDE HAILING SEGMENT TO LEAD MARKET DURING FORECAST PERIOD
    4.4 MOBILITY AS A SERVICE MARKET, BY APPLICATION TYPE 
           FIGURE 13 JOURNEY PLANNING TO HOLD LARGEST MARKET SHARE DURING FORECAST PERIOD
    4.5 MOBILITY AS A SERVICE MARKET, BY VEHICLE TYPE 
           FIGURE 14 FOUR-WHEELERS TO DOMINATE MARKET DURING FORECAST PERIOD
    4.6 MOBILITY AS A SERVICE MARKET, BY OPERATING SYSTEM 
           FIGURE 15 ANDROID TO BE FASTEST-GROWING SEGMENT DURING FORECAST PERIOD
    4.7 MOBILITY AS A SERVICE MARKET, BY BUSINESS MODEL 
           FIGURE 16 BUSINESS-TO-BUSINESS SEGMENT TO HOLD LARGEST SHARE DURING FORECAST PERIOD
    4.8 MOBILITY AS A SERVICE MARKET, BY TRANSPORTATION TYPE 
           FIGURE 17 PRIVATE TRANSPORTATION TO COMMAND LARGER SHARE DURING FORECAST PERIOD
    4.9 MOBILITY AS A SERVICE MARKET, BY REGION 
           FIGURE 18 ASIA PACIFIC ANTICIPATED TO BE LARGEST MARKET BY 2030
 
5 MARKET OVERVIEW (Page No. - 48)
    5.1 INTRODUCTION 
    5.2 MARKET DYNAMICS 
           FIGURE 19 DRIVERS, RESTRAINTS, OPPORTUNITIES, AND CHALLENGES: MAAS MARKET
           5.2.1 DRIVERS
                    5.2.1.1 Increasing smart city initiatives
                               TABLE 1 UPCOMING RAIL PROJECTS, BY COUNTRY
                    5.2.1.2 Improvements in 4G/5G infrastructure and penetration of smartphones
                               FIGURE 20 GLOBAL INTERNET USAGE, 2010–2023 (BILLION)
                    5.2.1.3 Need to reduce CO2 emissions
                               FIGURE 21 COMPARISON OF DIFFERENT MODALITIES OF TRANSPORT IN TERMS OF CO2 FOOTPRINT
           5.2.2 RESTRAINTS
                    5.2.2.1 Rising post-pandemic demand for car rentals/station-based mobility
                               FIGURE 22 GLOBAL CAR SHARING & CAR RENTAL MARKET, 2020-2027
                    5.2.2.2 Lack of infrastructure to scale MaaS applications
           5.2.3 OPPORTUNITIES
                    5.2.3.1 Increasing use of autonomous cars and electric vehicles
                               FIGURE 23 ELECTRIC VEHICLE SALES, 2019?2027
                    5.2.3.2 Use of big data to refine MaaS offerings
                    5.2.3.3 Inclusion of on-demand ferry and freight services
           5.2.4 CHALLENGES
                    5.2.4.1 Integration of public and private stakeholders
                    5.2.4.2 Limited connectivity in developing countries
                    5.2.4.3 Difficulty in integrating ticketing and payment systems
    5.3 TRENDS/DISRUPTIONS IMPACTING MAAS MARKET 
    5.4 ECOSYSTEM ANALYSIS 
           FIGURE 24 MOBILITY AS A SERVICE ECOSYSTEM
    5.5 TECHNOLOGY ANALYSIS 
           5.5.1 MONTHLY SUBSCRIPTION PLANS
           5.5.2 IMPACT OF MULTIMODAL TRANSPORTATION ON MAAS
                    FIGURE 25 MULTIMODAL MOBILITY PLATFORM
           5.5.3 IMPACT OF AUTONOMOUS VEHICLES ON MAAS
           5.5.4 FIRST MILE & LAST MILE SOLUTIONS
    5.6 REGULATORY FRAMEWORK AND CHALLENGES 
           TABLE 2 KEY REGULATORY CHALLENGES IN IMPLEMENTATION OF MAAS
           5.6.1 MARKET ACCESS & INTEGRATION BARRIERS
           5.6.2 SALES CHANNEL RESTRICTIONS & PAYMENT INTEGRATION
           5.6.3 UNDEFINED PRINCIPLES FOR DATA SHARING & ACCESS
    5.7 AVERAGE JOURNEY COST 
           TABLE 3 JOURNEY PLANNING AVERAGE COST 2022
    5.8 PATENT ANALYSIS 
    5.9 CASE STUDY ANALYSIS 
           5.9.1 MOBILLEO
           5.9.2 CONDUENT
    5.1 KEY CONFERENCES AND EVENTS, 2023?2024 
           5.10.1 BUYING CRITERIA
                    FIGURE 26 KEY BUYING CRITERIA FOR TRANSPORTATION TYPES IN MAAS MARKET
                    TABLE 4 KEY BUYING CRITERIA FOR TRANSPORTATION TYPES IN MAAS MARKET
 
6 RECOMMENDATIONS BY MARKETSANDMARKETS (Page No. - 68)
    6.1 FOCUS ON SOUTHEAST ASIAN COUNTRIES TO ENSURE RAPID REVENUE GROWTH FOR MAAS PLAYERS 
           6.1.1 IMPORTANT REGULATIONS AND ACCREDITATION FOR MAAS DEVELOPMENT
           6.1.2 UI DEVELOPERS SHOULD ENSURE BETTER INTEGRATION OF STAKEHOLDERS
           6.1.3 SERVICE PROVIDERS SHOULD PRIORITIZE PERSONALIZATION
    6.2 CONCLUSION 
 
7 MOBILITY AS A SERVICE MARKET, BY SERVICE TYPE (Page No. - 70)
    7.1 INTRODUCTION 
           7.1.1 INDUSTRY INSIGHTS
                    FIGURE 27 MOBILITY AS A SERVICE MARKET, BY SERVICE TYPE, 2022 VS. 2030 (USD MILLION)
                    TABLE 5 MOBILITY AS A SERVICE MARKET, BY SERVICE TYPE, 2020–2025 (USD MILLION)
                    TABLE 6 MOBILITY AS A SERVICE MARKET, BY SERVICE TYPE, 2026–2030 (USD MILLION)
    7.2 RIDE HAILING 
           7.2.1 E-HAILING TO DRIVE DEMAND
                    TABLE 7 E-HAILING: TOP PLAYERS
                    TABLE 8 RIDE HAILING: MOBILITY AS A SERVICE MARKET, BY REGION, 2020–2025 (USD MILLION)
                    TABLE 9 RIDE HAILING: MOBILITY AS A SERVICE MARKET, BY REGION, 2026–2030 (USD MILLION)
           7.2.2 CAR SHARING
                    7.2.2.1 Presence of top service providers in Europe to boost market
                               TABLE 10 CAR SHARING - TOP PLAYERS
                               TABLE 11 CAR SHARING: MOBILITY AS A SERVICE MARKET, BY REGION, 2020–2025 (USD MILLION)
                               TABLE 12 CAR SHARING: MOBILITY AS A SERVICE MARKET, BY REGION, 2026–2030 (USD MILLION)
           7.2.3 MICROMOBILITY
                    7.2.3.1 Need for last mile connectivity to drive demand
                               TABLE 13 MICROMOBILITY AS A SERVICE MARKET, BY REGION, 2020–2025 (USD MILLION)
                               TABLE 14 MICROMOBILITY AS A SERVICE MARKET, BY REGION, 2026–2030 (USD MILLION)
           7.2.4 BUS SHARING
                    7.2.4.1 Growing use of bus rapid transit systems in Europe to boost segment
                               TABLE 15 BUS SHARING: MOBILITY AS A SERVICE MARKET, BY REGION, 2020–2025 (USD MILLION)
                               TABLE 16 BUS SHARING: MOBILITY AS A SERVICE MARKET, BY REGION, 2026–2030 (USD MILLION)
           7.2.5 TRAIN SERVICES
                    7.2.5.1 Increasing network of high-speed trains to fuel segment growth
                               TABLE 17 TRAIN SERVICES: MOBILITY AS A SERVICE MARKET, BY REGION, 2020–2025 (USD MILLION)
                               TABLE 18 TRAIN SERVICES: MOBILITY AS A SERVICE MARKET, BY REGION, 2026–2030 (USD MILLION)
 
8 MOBILITY AS A SERVICE MARKET, BY BUSINESS MODEL (Page No. - 79)
    8.1 INTRODUCTION 
           8.1.1 INDUSTRY INSIGHTS
                    FIGURE 28 MOBILITY AS A SERVICE MARKET, BY BUSINESS MODEL, 2022 VS. 2030 (USD MILLION)
                    TABLE 19 MOBILITY AS A SERVICE MARKET, BY BUSINESS MODEL, 2020–2025 (USD MILLION)
                    TABLE 20 MOBILITY AS A SERVICE MARKET, BY BUSINESS MODEL, 2026–2030 (USD MILLION)
    8.2 BUSINESS-TO-BUSINESS 
           8.2.1 EUROPE AND NORTH AMERICA TO BE KEY MARKETS
                    TABLE 21 BUSINESS-TO-BUSINESS: MOBILITY AS A SERVICE MARKET, BY REGION, 2020–2025 (USD MILLION)
                    TABLE 22 BUSINESS-TO-BUSINESS: MOBILITY AS A SERVICE MARKET, BY REGION, 2026–2030 (USD MILLION)
    8.3 BUSINESS-TO-CONSUMER 
           8.3.1 ASIA PACIFIC REGION TO DOMINATE MARKET
                    TABLE 23 BUSINESS-TO-CONSUMER: MOBILITY AS A SERVICE MARKET, BY REGION, 2020–2025 (USD MILLION)
                    TABLE 24 BUSINESS-TO-CONSUMER: MOBILITY AS A SERVICE MARKET, BY REGION, 2026–2030 (USD MILLION)
    8.4 PEER-TO-PEER 
           8.4.1 REST OF THE WORLD TO BE FASTEST-GROWING MARKET
                    TABLE 25 PEER-TO-PEER: MOBILITY AS A SERVICE MARKET, BY REGION, 2020–2025 (USD MILLION)
                    TABLE 26 PEER-TO-PEER: MOBILITY AS A SERVICE MARKET, BY REGION, 2026–2030 (USD MILLION)
 
9 MOBILITY AS A SERVICE MARKET, BY SOLUTION TYPE (Page No. - 85)
    9.1 INTRODUCTION 
           9.1.1 INDUSTRY INSIGHTS
                    FIGURE 29 MOBILITY AS A SERVICE MARKET, BY SOLUTION TYPE, 2022 VS. 2030 (USD MILLION)
                    TABLE 27 MOBILITY AS A SERVICE MARKET, BY SOLUTION TYPE, 2020–2025 (USD MILLION)
                    TABLE 28 MOBILITY AS A SERVICE MARKET, BY SOLUTION TYPE, 2026–2030 (USD MILLION)
    9.2 TECHNOLOGY PLATFORMS 
           9.2.1 BIG DATA, IOT, AND MOBILE TECHNOLOGIES TO DRIVE SEGMENT
                    TABLE 29 TECHNOLOGY PLATFORMS: MOBILITY AS A SERVICE MARKET, BY REGION, 2020–2025 (USD MILLION)
                    TABLE 30 TECHNOLOGY PLATFORMS: MOBILITY AS A SERVICE MARKET, BY REGION, 2026–2030 (USD MILLION)
    9.3 PAYMENT ENGINES 
           9.3.1 ASIA PACIFIC TO LEAD SEGMENT THROUGH FORECAST PERIOD
                    TABLE 31 PAYMENT ENGINES: MOBILITY AS A SERVICE MARKET, BY REGION, 2020–2025 (USD MILLION)
                    TABLE 32 PAYMENT ENGINES: MOBILITY AS A SERVICE MARKET, BY REGION, 2026–2030 (USD MILLION)
    9.4 NAVIGATION SOLUTIONS 
           9.4.1 REAL-TIME DATA AND ROUTE PLANNING FEATURES TO BOOST DEMAND
                    TABLE 33 NAVIGATION SOLUTIONS: MOBILITY AS A SERVICE MARKET, BY REGION, 2020–2025 (USD MILLION)
                    TABLE 34 NAVIGATION SOLUTIONS: MOBILITY AS A SERVICE MARKET, BY REGION, 2026–2030 (USD MILLION)
    9.5 TELECOM CONNECTIVITY PROVIDERS 
           9.5.1 5G INFRASTRUCTURE IN ASIA PACIFIC TO BOOST MARKET
                    TABLE 35 TELECOM CONNECTIVITY PROVIDERS: MOBILITY AS A SERVICE MARKET, BY REGION, 2020–2025 (USD MILLION)
                    TABLE 36 TELECOM CONNECTIVITY PROVIDERS: MOBILITY AS A SERVICE MARKET, BY REGION, 2026–2030 (USD MILLION)
    9.6 TICKETING SOLUTIONS 
           9.6.1 INTEGRATED ELECTRONIC TICKETING TO DRIVE MARKET
                    TABLE 37 TICKETING SOLUTIONS: MOBILITY AS A SERVICE MARKET, BY REGION, 2020–2025 (USD MILLION)
                    TABLE 38 TICKETING SOLUTIONS: MOBILITY AS A SERVICE MARKET, BY REGION, 2026–2030 (USD MILLION)
    9.7 INSURANCE SERVICES 
           9.7.1 INCREASING INTEGRATION OF VEHICLES TO DRIVE SEGMENT
                    TABLE 39 INSURANCE SERVICES: MOBILITY AS A SERVICE MARKET, BY REGION, 2020–2025 (USD MILLION)
                    TABLE 40 INSURANCE SERVICES: MOBILITY AS A SERVICE MARKET, BY REGION, 2026–2030 (USD MILLION)
 
10 MOBILITY AS A SERVICE MARKET, BY TRANSPORTATION TYPE (Page No. - 94)
     10.1 INTRODUCTION 
             10.1.1 INDUSTRY INSIGHTS
                       FIGURE 30 MOBILITY AS A SERVICE MARKET, BY TRANSPORTATION TYPE, 2022 VS. 2030 (USD MILLION)
                       TABLE 41 MOBILITY AS A SERVICE MARKET, BY TRANSPORTATION TYPE, 2020–2025 (USD MILLION)
                       TABLE 42 MOBILITY AS A SERVICE MARKET, BY TRANSPORTATION TYPE, 2026–2030 (USD MILLION)
     10.2 PRIVATE 
             10.2.1 GROWING DEMAND FOR PERSONAL MOBILITY OPTIONS TO DRIVE SEGMENT
                       TABLE 43 PRIVATE: MOBILITY AS A SERVICE MARKET, BY REGION, 2020–2025 (USD MILLION)
                       TABLE 44 PRIVATE: MOBILITY AS A SERVICE MARKET, BY REGION, 2026–2030 (USD MILLION)
     10.3 PUBLIC 
             10.3.1 HIGH COST OF VEHICLE OWNERSHIP TO INCREASE USE OF PUBLIC TRANSPORT
                       TABLE 45 PUBLIC: MOBILITY AS A SERVICE MARKET, BY REGION, 2020–2025 (USD MILLION)
                       TABLE 46 PUBLIC: MOBILITY AS A SERVICE MARKET, BY REGION, 2026–2030 (USD MILLION)
11 MOBILITY AS A SERVICE MARKET, BY APPLICATION TYPE (Page No. - 99)
     11.1 INTRODUCTION 
             11.1.1 INDUSTRY INSIGHTS
                       FIGURE 31 MOBILITY AS A SERVICE MARKET, BY APPLICATION TYPE, 2022 VS. 2030 (USD MILLION)
                       TABLE 47 MOBILITY AS A SERVICE MARKET, BY APPLICATION TYPE, 2020–2025 (USD MILLION)
                       TABLE 48 MOBILITY AS A SERVICE MARKET, BY APPLICATION TYPE, 2026–2030 (USD MILLION)
     11.2 PERSONALIZED APPLICATION SERVICES 
             11.2.1 MULTIPLE CUSTOMIZED FEATURES TO DRIVE SEGMENT GROWTH
                       TABLE 49 PERSONALIZED APPLICATION SERVICES: MOBILITY AS A SERVICE MARKET, BY REGION, 2020–2025 (USD MILLION)
                       TABLE 50 PERSONALIZED APPLICATION SERVICES: MOBILITY AS A SERVICE MARKET, BY REGION, 2026–2030 (USD MILLION)
     11.3 JOURNEY MANAGEMENT 
             11.3.1 EXPECTED TO BE FASTEST-GROWING SEGMENT DURING FORECAST PERIOD
                       TABLE 51 JOURNEY MANAGEMENT: MOBILITY AS A SERVICE MARKET, BY REGION, 2020–2025 (USD MILLION)
                       TABLE 52 JOURNEY MANAGEMENT: MOBILITY AS A SERVICE MARKET, BY REGION, 2026–2030 (USD MILLION)
     11.4 JOURNEY PLANNING 
             11.4.1 AVAILABILITY OF REAL-TIME DATA TO DRIVE SEGMENT
                       TABLE 53 JOURNEY PLANNING: MOBILITY AS A SERVICE MARKET, BY REGION, 2020–2025 (USD MILLION)
                       TABLE 54 JOURNEY PLANNING: MOBILITY AS A SERVICE MARKET, BY REGION, 2026–2030 (USD MILLION)
     11.5 FLEXIBLE PAYMENTS & TRANSACTIONS 
             11.5.1 USER-FRIENDLY PAYMENT OPTIONS TO BOOST SEGMENT
                       TABLE 55 FLEXIBLE PAYMENTS & TRANSACTIONS: MOBILITY AS A SERVICE MARKET, BY REGION, 2020–2025 (USD MILLION)
                       TABLE 56 FLEXIBLE PAYMENTS & TRANSACTIONS: MOBILITY AS A SERVICE MARKET, BY REGION, 2026–2030 (USD MILLION)
 
12 MOBILITY AS A SERVICE MARKET, BY VEHICLE TYPE (Page No. - 106)
     12.1 INTRODUCTION 
             12.1.1 INDUSTRY INSIGHTS
                       FIGURE 32 MOBILITY AS A SERVICE MARKET, BY VEHICLE TYPE, 2022 VS. 2030 (USD MILLION)
                       TABLE 57 MOBILITY AS A SERVICE MARKET, BY VEHICLE TYPE, 2020–2025 (USD MILLION)
                       TABLE 58 MOBILITY AS A SERVICE MARKET, BY VEHICLE TYPE, 2026–2030 (USD MILLION)
     12.2 BUSES 
             12.2.1 RISING FUEL PRICES TO DRIVE USE OF BUSES
                       TABLE 59 BUSES: MOBILITY AS A SERVICE MARKET, BY REGION, 2020–2025 (USD MILLION)
                       TABLE 60 BUSES: MOBILITY AS A SERVICE MARKET, BY REGION, 2026–2030 (USD MILLION)
     12.3 FOUR-WHEELERS 
             12.3.1 RISING DEMAND FOR RIDE HAILING AND CAR SHARING TO BOOST SEGMENT
                       TABLE 61 FOUR-WHEELERS: MOBILITY AS A SERVICE MARKET, BY REGION, 2020–2025 (USD MILLION)
                       TABLE 62 FOUR-WHEELERS: MOBILITY AS A SERVICE MARKET, BY REGION, 2026–2030 (USD MILLION)
     12.4 MICROMOBILITY 
             12.4.1 SUITABILITY TO LAST MILE CONNECTIVITY TO DRIVE MARKET
                       TABLE 63 MICROMOBILITY: MOBILITY AS A SERVICE MARKET, BY REGION, 2020–2025 (USD MILLION)
                       TABLE 64 MICROMOBILITY: MOBILITY AS A SERVICE MARKET, BY REGION, 2026–2030 (USD MILLION)
     12.5 TRAINS 
             12.5.1 INVESTMENT IN MONORAILS AND METROS TO BOOST SEGMENT
                       TABLE 65 TRAINS: MOBILITY AS A SERVICE MARKET, BY REGION, 2020–2025 (USD MILLION)
                       TABLE 66 TRAINS: MOBILITY AS A SERVICE MARKET, BY REGION, 2026–2030 (USD MILLION)
 
13 MOBILITY AS A SERVICE MARKET, BY PROPULSION TYPE (Page No. - 113)
     13.1 INTRODUCTION 
             13.1.1 INDUSTRY INSIGHTS
                       FIGURE 33 MOBILITY AS A SERVICE MARKET, BY PROPULSION TYPE, 2022 VS. 2030 (USD MILLION)
                       TABLE 67 MOBILITY AS A SERVICE MARKET, BY PROPULSION TYPE, 2020–2025 (USD MILLION)
                       TABLE 68 MOBILITY AS A SERVICE MARKET, BY PROPULSION TYPE, 2026–2030 (USD MILLION)
     13.2 ICE 
             13.2.1 PHASING OUT OF FOSSIL FUELS TO REDUCE MARKET SHARE
                       TABLE 69 ICE: MOBILITY AS A SERVICE MARKET, BY REGION, 2020–2025 (USD MILLION)
                       TABLE 70 ICE: MOBILITY AS A SERVICE MARKET, BY REGION, 2026–2030 (USD MILLION)
     13.3 EV 
             13.3.1 HIGHER ENERGY EFFICIENCY TO DRIVE SEGMENT
                       TABLE 71 EV: MOBILITY AS A SERVICE MARKET, BY REGION, 2020–2025 (USD MILLION)
                       TABLE 72 EV: MOBILITY AS A SERVICE MARKET, BY REGION, 2026–2030 (USD MILLION)
     13.4 PHEV 
             13.4.1 EXPECTED TO EASE TRANSITION FROM ICE TO EV
                       TABLE 73 PHEV: MOBILITY AS A SERVICE MARKET, BY REGION, 2020–2025 (USD MILLION)
                       TABLE 74 PHEV: MOBILITY AS A SERVICE MARKET, BY REGION, 2026–2030 (USD MILLION)
 
14 MOBILITY AS A SERVICE MARKET, BY OPERATING SYSTEM (Page No. - 119)
     14.1 INTRODUCTION 
             14.1.1 INDUSTRY INSIGHTS
                       FIGURE 34 MOBILITY AS A SERVICE MARKET, BY OPERATING SYSTEM, 2022 VS. 2030 (USD MILLION)
                       TABLE 75 MOBILITY AS A SERVICE MARKET, BY OPERATING SYSTEM, 2020–2025 (USD MILLION)
                       TABLE 76 MOBILITY AS A SERVICE MARKET, BY OPERATING SYSTEM, 2026–2030 (USD MILLION)
     14.2 ANDROID 
             14.2.1 SEGMENT TO DOMINATE GLOBAL MARKET THROUGH FORECAST PERIOD
                       TABLE 77 ANDROID: MOBILITY AS A SERVICE MARKET, BY REGION, 2020–2025 (USD MILLION)
                       TABLE 78 ANDROID: MOBILITY AS A SERVICE MARKET, BY REGION, 2026–2030 (USD MILLION)
     14.3 IOS 
             14.3.1 EXPECTED TO DOMINATE IN NORTH AMERICA THROUGH FORECAST PERIOD
                       TABLE 79 IOS: MOBILITY AS A SERVICE MARKET, BY REGION, 2020–2025 (USD MILLION)
                       TABLE 80 IOS: MOBILITY AS A SERVICE MARKET, BY REGION, 2026–2030 (USD MILLION)
     14.4 OTHER OS 
             14.4.1 NEGLIGIBLE MARKET SHARE EXPECTED DURING FORECAST PERIOD
                       TABLE 81 OTHER OS: MOBILITY AS A SERVICE MARKET, BY REGION, 2020–2025 (USD MILLION)
                       TABLE 82 OTHER OS: MOBILITY AS A SERVICE MARKET, BY REGION, 2026–2030 (USD MILLION)
 
15 MOBILITY AS A SERVICE MARKET FOR ELECTRIC VEHICLES, BY MODE (Page No. - 125)
     15.1 INTRODUCTION 
             15.1.1 INDUSTRY INSIGHTS
                       FIGURE 35 MOBILITY AS A SERVICE MARKET FOR ELECTRIC VEHICLES, BY MODE, 2022 VS. 2030 (USD MILLION)
                       TABLE 83 MOBILITY AS A SERVICE MARKET FOR ELECTRIC VEHICLE, BY MODE, 2020–2025 (USD MILLION)
                       TABLE 84 MOBILITY AS A SERVICE MARKET FOR ELECTRIC VEHICLES, BY MODE, 2026–2030 (USD MILLION)
     15.2 PRIVATE 
             15.2.1 INTRODUCTION OF AUTONOMOUS VEHICLES TO IMPACT SEGMENT GROWTH
                       TABLE 85 PRIVATE: MOBILITY AS A SERVICE MARKET FOR ELECTRIC VEHICLES, BY REGION, 2020–2025 (USD MILLION)
                       TABLE 86 PRIVATE: MOBILITY AS A SERVICE MARKET FOR ELECTRIC VEHICLES, BY REGION, 2026–2030 (USD MILLION)
     15.3 PUBLIC 
             15.3.1 ECONOMIC BENEFITS OF ELECTRIFICATION OF PUBLIC TRANSPORT SERVICES TO DRIVE MARKET
                       TABLE 87 PUBLIC: MOBILITY AS A SERVICE MARKET FOR ELECTRIC VEHICLES, BY REGION, 2020–2025 (USD MILLION)
                       TABLE 88 PUBLIC: MOBILITY AS A SERVICE MARKET FOR ELECTRIC VEHICLES, BY REGION, 2026–2030 (USD MILLION)
 
16 MOBILITY AS A SERVICE MARKET, BY PAYMENT & TRANSPORTATION TYPE (Page No. - 130)
     16.1 INTRODUCTION 
             16.1.1 INDUSTRY INSIGHTS
                       FIGURE 36 MOBILITY AS A SERVICE MARKET, BY PAYMENT TYPE, 2022 VS. 2030 (USD MILLION)
                       TABLE 89 MOBILITY AS A SERVICE MARKET, BY PAYMENT TYPE, 2020–2025 (USD MILLION)
                       TABLE 90 MOBILITY AS A SERVICE MARKET, BY PAYMENT TYPE, 2026–2030 (USD MILLION)
     16.2 SUBSCRIPTION 
             16.2.1 GROWING USE BY DAILY COMMUTERS TO DRIVE DEMAND
                       TABLE 91 SUBSCRIPTION: MOBILITY AS A SERVICE MARKET, BY PAYMENT & TRANSPORTATION TYPE, 2020–2025 (USD MILLION)
                       TABLE 92 SUBSCRIPTION: MOBILITY AS A SERVICE MARKET, BY PAYMENT & TRANSPORTATION TYPE, 2026–2030 (USD MILLION)
     16.3 PAY-AS-YOU-GO 
             16.3.1 TOURISTS AND OCCASIONAL COMMUTERS TO DRIVE SEGMENT
                       TABLE 93 PAY-AS-YOU-GO: MOBILITY AS A SERVICE MARKET, BY PAYMENT & TRANSPORTATION TYPE, 2020–2025 (USD MILLION)
                       TABLE 94 PAY-AS-YOU-GO: MOBILITY AS A SERVICE MARKET, BY PAYMENT & TRANSPORTATION TYPE, 2026–2030 (USD MILLION)
 
17 MOBILITY AS A SERVICE MARKET, BY COMMUTE TYPE (Page No. - 135)
     17.1 INTRODUCTION 
             17.1.1 INDUSTRY INSIGHTS
                       FIGURE 37 MOBILITY AS A SERVICE MARKET, BY COMMUTE TYPE, 2022 VS. 2030 (USD MILLION)
                       TABLE 95 MOBILITY AS A SERVICE MARKET, BY COMMUTE TYPE, 2020–2025 (USD MILLION)
                       TABLE 96 MOBILITY AS A SERVICE MARKET, BY COMMUTE TYPE, 2026–2030 (USD MILLION)
     17.2 DAILY 
             17.2.1 NEW SUBSCRIPTION PACKAGES TO ATTRACT DAILY COMMUTERS
                       TABLE 97 DAILY COMMUTE: MOBILITY AS A SERVICE MARKET, BY BUSINESS MODEL, 2020–2025 (USD MILLION)
                       TABLE 98 DAILY COMMUTE: MOBILITY AS A SERVICE MARKET, BY BUSINESS MODEL, 2026–2030 (USD MILLION)
     17.3 LAST MILE CONNECTIVITY 
             17.3.1 EXPANDING E-COMMERCE TO DRIVE GROWTH OF SEGMENT
                       TABLE 99 LAST MILE CONNECTIVITY COMMUTE: MOBILITY AS A SERVICE MARKET, BY BUSINESS MODEL, 2020–2025 (USD MILLION)
                       TABLE 100 LAST MILE CONNECTIVITY COMMUTE: MOBILITY AS A SERVICE MARKET, BY BUSINESS MODEL, 2026–2030 (USD MILLION)
     17.4 OCCASIONAL 
             17.4.1 B2C BUSINESS MODEL TO DRIVE SEGMENT OWING TO FALLING VEHICLE OWNERSHIP
                       TABLE 101 OCCASIONAL COMMUTE: MOBILITY AS A SERVICE MARKET, BY BUSINESS MODEL, 2020–2025 (USD MILLION)
                       TABLE 102 OCCASIONAL COMMUTE: MOBILITY AS A SERVICE MARKET, BY BUSINESS MODEL, 2026–2030 (USD MILLION)
 
18 MOBILITY AS A SERVICE MARKET, BY REGION (Page No. - 140)
     18.1 INTRODUCTION 
             18.1.1 INDUSTRY INSIGHTS
                       FIGURE 38 MOBILITY AS A SERVICE MARKET, BY REGION, 2022 VS. 2030 (USD MILLION)
                       TABLE 103 MOBILITY AS A SERVICE MARKET, BY REGION, 2020–2025 (USD MILLION)
                       TABLE 104 MOBILITY AS A SERVICE MARKET, BY REGION, 2026–2030 (USD MILLION)
     18.2 ASIA PACIFIC 
               FIGURE 39 ASIA PACIFIC: MOBILITY AS A SERVICE MARKET SNAPSHOT
               TABLE 105 ASIA PACIFIC: MOBILITY AS A SERVICE MARKET, BY COUNTRY, 2020–2025 (USD MILLION)
               TABLE 106 ASIA PACIFIC: MOBILITY AS A SERVICE MARKET, BY COUNTRY, 2026–2030 (USD MILLION)
             18.2.1 CHINA
                       18.2.1.1 Large EV market to drive demand for MaaS
                                   TABLE 107 CHINA: MOBILITY AS A SERVICE MARKET, BY SERVICE TYPE, 2020–2025 (USD MILLION)
                                   TABLE 108 CHINA: MOBILITY AS A SERVICE MARKET, BY SERVICE TYPE, 2026–2030 (USD MILLION)
             18.2.2 JAPAN
                       18.2.2.1 Local MaaS players to boost market
                                   TABLE 109 JAPAN: MOBILITY AS A SERVICE MARKET, BY SERVICE TYPE, 2020–2025 (USD MILLION)
                                   TABLE 110 JAPAN: MOBILITY AS A SERVICE MARKET, BY SERVICE TYPE, 2026–2030 (USD MILLION)
             18.2.3 SINGAPORE
                       18.2.3.1 Increasing government focus on clean transportation to drive market
                                   TABLE 111 SINGAPORE: MOBILITY AS A SERVICE MARKET, BY SERVICE TYPE, 2020–2025 (USD MILLION)
                                   TABLE 112 SINGAPORE: MOBILITY AS A SERVICE MARKET, BY SERVICE TYPE, 2026–2030 (USD MILLION)
             18.2.4 AUSTRALIA
                       18.2.4.1 MaaS partnerships and agreements to be key to market success
                                   TABLE 113 AUSTRALIA: MOBILITY AS A SERVICE MARKET, BY SERVICE TYPE, 2020–2025 (USD MILLION)
                                   TABLE 114 AUSTRALIA: MOBILITY AS A SERVICE MARKET, BY SERVICE TYPE, 2026–2030 (USD MILLION)
             18.2.5 INDONESIA
                       18.2.5.1 New public transport system in Jakarta to propel demand
                                   TABLE 115 INDONESIA: MOBILITY AS A SERVICE MARKET, BY SERVICE TYPE, 2020–2025 (USD MILLION)
                                   TABLE 116 INDONESIA: MOBILITY AS A SERVICE MARKET, BY SERVICE TYPE, 2026–2030 (USD MILLION)
             18.2.6 INDIA
                       18.2.6.1 Significant opportunities for MaaS market in near future
                                   TABLE 117 INDIA: MOBILITY AS A SERVICE MARKET, BY SERVICE TYPE, 2020–2025 (USD MILLION)
                                   TABLE 118 INDIA: MOBILITY AS A SERVICE MARKET, BY SERVICE TYPE, 2026–2030 (USD MILLION)
     18.3 EUROPE 
               FIGURE 40 EUROPE: MOBILITY AS A SERVICE MARKET SNAPSHOT
               TABLE 119 EUROPE: MOBILITY AS A SERVICE MARKET, BY COUNTRY, 2020–2025 (USD MILLION)
               TABLE 120 EUROPE: MOBILITY AS A SERVICE MARKET, BY COUNTRY, 2026–2030 (USD MILLION)
             18.3.1 FINLAND
                       18.3.1.1 Government initiatives to drive market
                                   TABLE 121 FINLAND: MOBILITY AS A SERVICE MARKET, BY SERVICE TYPE, 2020–2025 (USD MILLION)
                                   TABLE 122 FINLAND: MOBILITY AS A SERVICE MARKET, BY SERVICE TYPE, 2026–2030 (USD MILLION)
             18.3.2 GERMANY
                       18.3.2.1 Presence of major automotive OEMs to boost market
                                   TABLE 123 GERMANY: MOBILITY AS A SERVICE MARKET, BY SERVICE TYPE, 2020–2025 (USD MILLION)
                                   TABLE 124 GERMANY: MOBILITY AS A SERVICE MARKET, BY SERVICE TYPE, 2026–2030 (USD MILLION)
             18.3.3 FRANCE
                       18.3.3.1 Government initiatives to bolster market
                                   TABLE 125 FRANCE: MOBILITY AS A SERVICE MARKET, BY SERVICE TYPE, 2020–2025 (USD MILLION)
                                   TABLE 126 FRANCE: MOBILITY AS A SERVICE MARKET, BY SERVICE TYPE, 2026–2030 (USD MILLION)
             18.3.4 UK
                       18.3.4.1 Investment in smart transportation to boost market
                                   TABLE 127 UK: MOBILITY AS A SERVICE MARKET, BY SERVICE TYPE, 2020–2025 (USD MILLION)
                                   TABLE 128 UK: MOBILITY AS A SERVICE MARKET, BY SERVICE TYPE, 2026–2030 (USD MILLION)
             18.3.5 SPAIN
                       18.3.5.1 Efficient mobility infrastructure to support market
                                   TABLE 129 SPAIN: MOBILITY AS A SERVICE MARKET, BY SERVICE TYPE, 2020–2025 (USD MILLION)
                                   TABLE 130 SPAIN: MOBILITY AS A SERVICE MARKET, BY SERVICE TYPE, 2026–2030 (USD MILLION)
             18.3.6 NETHERLANDS
                       18.3.6.1 Ride hailing segment to drive demand
                                   TABLE 131 NETHERLANDS: MOBILITY AS A SERVICE MARKET, BY SERVICE TYPE, 2020–2025 (USD MILLION)
                                   TABLE 132 NETHERLANDS: MOBILITY AS A SERVICE MARKET, BY SERVICE TYPE, 2026–2030 (USD MILLION)
             18.3.7 ITALY
                       18.3.7.1 Increasing use of shared mobility services in cities to drive demand
                                   TABLE 133 ITALY: MOBILITY AS A SERVICE MARKET, BY SERVICE TYPE, 2020–2025 (USD MILLION)
                                   TABLE 134 ITALY: MOBILITY AS A SERVICE MARKET, BY SERVICE TYPE, 2026–2030 (USD MILLION)
             18.3.8 RUSSIA
                       18.3.8.1 Government initiatives to boost market
                                   TABLE 135 RUSSIA: MOBILITY AS A SERVICE MARKET, BY SERVICE TYPE, 2020–2025 (USD MILLION)
                                   TABLE 136 RUSSIA: MOBILITY AS A SERVICE MARKET, BY SERVICE TYPE, 2026–2030 (USD MILLION)
             18.3.9 TURKEY
                       18.3.9.1 Demand for smart mobility to create market opportunities
                                   TABLE 137 TURKEY: MOBILITY AS A SERVICE MARKET, BY SERVICE TYPE, 2020–2025 (USD MILLION)
                                   TABLE 138 TURKEY: MOBILITY AS A SERVICE MARKET, BY SERVICE TYPE, 2026–2030 (USD MILLION)
     18.4 NORTH AMERICA 
               FIGURE 41 NORTH AMERICA: MOBILITY AS A SERVICE MARKET, 2022 VS. 2030 (USD MILLION)
               TABLE 139 NORTH AMERICA: MOBILITY AS A SERVICE MARKET, BY COUNTRY, 2020–2025 (USD MILLION)
               TABLE 140 NORTH AMERICA: MOBILITY AS A SERVICE MARKET, BY COUNTRY, 2026–2030 (USD MILLION)
             18.4.1 US
                       18.4.1.1 Presence of industry leaders to drive market
                                   TABLE 141 US: MOBILITY AS A SERVICE MARKET, BY SERVICE TYPE, 2020–2025 (USD MILLION)
                                   TABLE 142 US: MOBILITY AS A SERVICE MARKET, BY SERVICE TYPE, 2026–2030 (USD MILLION)
             18.4.2 CANADA
                       18.4.2.1 High adoption of innovative technologies to propel market
                                   TABLE 143 CANADA: MOBILITY AS A SERVICE MARKET, BY SERVICE TYPE, 2020–2025 (USD MILLION)
                                   TABLE 144 CANADA: MOBILITY AS A SERVICE MARKET, BY SERVICE TYPE, 2026–2030 (USD MILLION)
             18.4.3 MEXICO
                       18.4.3.1 Need to reduce traffic congestion and pollution to boost demand for MaaS
                                   TABLE 145 MEXICO: MOBILITY AS A SERVICE MARKET, BY SERVICE TYPE, 2020–2025 (USD MILLION)
                                   TABLE 146 MEXICO: MOBILITY AS A SERVICE MARKET, BY SERVICE TYPE, 2026–2030 (USD MILLION)
     18.5 REST OF THE WORLD 
               FIGURE 42 REST OF THE WORLD: MOBILITY AS A SERVICE MARKET, 2022 VS. 2030 (USD MILLION)
               TABLE 147 REST OF THE WORLD: MOBILITY AS A SERVICE MARKET, BY COUNTRY, 2020–2025 (USD MILLION)
               TABLE 148 REST OF THE WORLD: MOBILITY AS A SERVICE MARKET, BY COUNTRY, 2026–2030 (USD MILLION)
             18.5.1 BRAZIL
                       18.5.1.1 Growing popularity of ride sharing services to impact market
                                   TABLE 149 BRAZIL: MOBILITY AS A SERVICE MARKET, BY SERVICE TYPE, 2020–2025 (USD MILLION)
                                   TABLE 150 BRAZIL: MOBILITY AS A SERVICE MARKET, BY SERVICE TYPE, 2026–2030 (USD MILLION)
             18.5.2 SOUTH AFRICA
                                   18.5.2.1 Emergence of local ride hailing companies to drive demand
                                               TABLE 151 SOUTH AFRICA: MOBILITY AS A SERVICE MARKET, BY SERVICE TYPE, 2020–2025 (USD MILLION)
                                               TABLE 152 SOUTH AFRICA: MOBILITY AS A SERVICE MARKET, BY SERVICE TYPE, 2026–2030 (USD MILLION)
 
19 COMPETITIVE LANDSCAPE (Page No. - 170)
     19.1 OVERVIEW 
     19.2 MOBILITY AS A SERVICE MARKET SHARE ANALYSIS, 2022 
               TABLE 153 MARKET SHARE ANALYSIS, 2022
               FIGURE 43 MOBILITY AS A SERVICE MARKET SHARE ANALYSIS, 2022
     19.3 COMPANY EVALUATION QUADRANT 
             19.3.1 STARS
             19.3.2 EMERGING LEADERS
             19.3.3 PERVASIVE PLAYERS
             19.3.4 PARTICIPANTS
             19.3.5 COMPETITIVE LEADERSHIP MAPPING–MAAS PROVIDERS
                       FIGURE 44 COMPETITIVE EVALUATION MATRIX (MOBILITY AS A SERVICE PROVIDERS), 2022
     19.4 COMPETITIVE LEADERSHIP MAPPING – MAAS SMES 
               FIGURE 45 COMPETITIVE EVALUATION MATRIX (MOBILITY AS A SERVICE SMES), 2022
               FIGURE 46 COMPANIES ADOPTED NEW PRODUCT DEVELOPMENTS AND EXPANSIONS AS KEY GROWTH STRATEGIES, 2019–2022
     19.5 COMPETITIVE SCENARIO 
             19.5.1 PRODUCT LAUNCHES
                       TABLE 154 PRODUCT LAUNCHES, FEBRUARY 2019–NOVEMBER 2022
             19.5.2 DEALS
                       TABLE 155 DEALS, MARCH 2019–NOVEMBER 2022
             19.5.3 OTHER DEVELOPMENTS, 2019–2022
                       TABLE 156 OTHER, APRIL 2019–FEBRUARY 2022
     19.6 RIGHT TO WIN 
               TABLE 157 COMPANIES ADOPTED NEW PRODUCT DEVELOPMENTS, PARTNERSHIPS, AND SUPPLY CONTRACTS AS KEY GROWTH STRATEGIES DURING 2019–2022
     19.7 COMPETITIVE BENCHMARKING 
               TABLE 158 MOBILITY AS A SERVICE MARKET: KEY START-UPS/SMES
               TABLE 159 MOBILITY AS A SERVICE MARKET: COMPETITIVE BENCHMARKING OF KEY PLAYERS
 
20 COMPANY PROFILES (Page No. - 184)
(Business overview, Products offered, Recent developments & MnM View)*
     20.1 KEY PLAYERS 
             20.1.1 CITYMAPPER
                       TABLE 160 CITYMAPPER: OVERVIEW
                       TABLE 161 CITYMAPPER: PRODUCT LAUNCHES
             20.1.2 MAAS GLOBAL
                       TABLE 162 MAAS GLOBAL: OVERVIEW
                       TABLE 163 MAAS GLOBAL: PRODUCT LAUNCHES
                       TABLE 164 MAAS GLOBAL: EXPANSIONS
                       TABLE 165 MAAS GLOBAL: DEALS
             20.1.3 MOOVIT
                       TABLE 166 MOOVIT: OVERVIEW
                       TABLE 167 MOOVIT: PRODUCT LAUNCHES
                       TABLE 168 MOOVIT: DEALS
             20.1.4 FOD MOBILITY UK LTD.
                       TABLE 169 FOD MOBILITY UK LTD.: OVERVIEW
                       TABLE 170 FOD MOBILITY UK LTD.: PRODUCT LAUNCHES
                       TABLE 171 FOD MOBILITY UK LTD.: DEALS
             20.1.5 SKEDGO
                       TABLE 172 SKEDGO: OVERVIEW
                       TABLE 173 SKEDGO: PRODUCT LAUNCHES
                       TABLE 174 SKEDGO: DEALS
             20.1.6 UBIGO
                       TABLE 175 UBIGO: OVERVIEW
                       TABLE 176 UBIGO: PRODUCT LAUNCHES
                       TABLE 177 UBIGO: EXPANSIONS
             20.1.7 SPLYT TECHNOLOGIES
                       TABLE 178 SPLYT TECHNOLOGIES: OVERVIEW
                       TABLE 179 SPLYT TECHNOLOGIES: DEALS
             20.1.8 COMMUNAUTO
                       TABLE 180 COMMUNAUTO: OVERVIEW
                       TABLE 181 COMMUNAUTO: DEALS
             20.1.9 QIXXIT
                       TABLE 182 QIXXIT: OVERVIEW
                       TABLE 183 QIXXIT: PRODUCT LAUNCHES
                       TABLE 184 QIXXIT: DEALS
             20.1.10 TRANZER
                       TABLE 185 TRANZER: OVERVIEW
                       TABLE 186 TRANZER: DEALS
*Details on Business overview, Products offered, Recent developments & MnM View might not be captured in case of unlisted companies.
     20.2 OTHER KEY PLAYERS 
             20.2.1 MOOVEL GROUP
                       TABLE 187 MOOVEL GROUP: BUSINESS OVERVIEW
             20.2.2 SMILE MOBILITY
                       TABLE 188 SMILE MOBILITY: BUSINESS OVERVIEW
             20.2.3 SHARE NOW GMBH
                       TABLE 189 SHARE NOW GMBH: BUSINESS OVERVIEW
             20.2.4 VELOCIA INC.
                       TABLE 190 VELOCIA INC.: BUSINESS OVERVIEW
             20.2.5 UBER
                       TABLE 191 UBER: BUSINESS OVERVIEW
             20.2.6 LYFT
                       TABLE 192 LYFT: BUSINESS OVERVIEW
             20.2.7 DIDI CHUXING
                       TABLE 193 DIDI CHUXING: BUSINESS OVERVIEW
             20.2.8 GRAB HOLDINGS INC.
                       TABLE 194 GRAB HOLDINGS INC.: BUSINESS OVERVIEW
             20.2.9 MOBILITYX PTE LTD.
                       TABLE 195 MOBILITYX PTE LTD.: BUSINESS OVERVIEW
             20.2.10 BRIDJ
                       TABLE 196 BRIDJ: BUSINESS OVERVIEW
             20.2.11 ANI TECHNOLOGIES PVT. LTD (OLA)
                       TABLE 197 ANI TECHNOLOGIES PVT. LTD (OLA): BUSINESS OVERVIEW
             20.2.12 MOBILITY TECHNOLOGIES CO., LTD
                       TABLE 198 MOBILITY TECHNOLOGIES CO., LTD: BUSINESS OVERVIEW
             20.2.13 WIWIGO
                       TABLE 199 WIWIGO: BUSINESS OVERVIEW
             20.2.14 EASY TAXI
                       TABLE 200 EASY TAXI: BUSINESS OVERVIEW
             20.2.15 VIA TRANSPORTATION INC.
                       TABLE 201 VIA TRANSPORTATION INC.: BUSINESS OVERVIEW
 
21 APPENDIX (Page No. - 211)
     21.1 KEY INSIGHTS FROM INDUSTRY EXPERTS 
     21.2 DISCUSSION GUIDE 
     21.3 KNOWLEDGESTORE: MARKETSANDMARKETS’ SUBSCRIPTION PORTAL 
     21.4 CUSTOMIZATION OPTIONS 
             21.4.1 MOBILITY AS A SERVICE MARKET, BY CITY
                       21.4.1.1 Helsinki
                       21.4.1.2 Rome
                       21.4.1.3 Paris
                       21.4.1.4 Los Angeles
                       21.4.1.5 Hanover
                       21.4.1.6 Berlin
                       21.4.1.7 Sydney
     21.5 RELATED REPORTS 
     21.6 AUTHOR DETAILS 

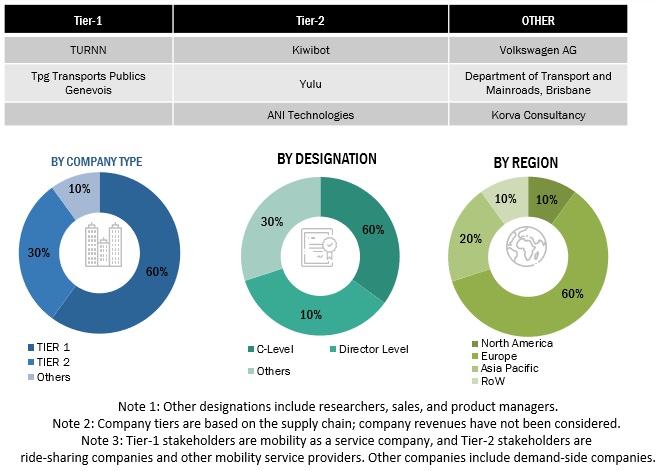
Various secondary sources, directories, and databases have been used to identify and collect information for an extensive study of the mobility as a service (MaaS) market. The study involved four main activities in estimating the current size of the MaaS market: secondary research, validation through primary research, assumptions, and market analysis. Exhaustive secondary research was carried out to collect information on the market, such as the service types as well as the upcoming technologies and trends. The next step was to validate these findings, assumptions, and market analysis with industry experts across the value chain through primary research. The top-down approach was employed to estimate the complete market size for different segments considered in this study.

Secondary Research

The secondary sources referred to for this research study include company publications, technical journals, white papers, magazines, trade & business publications, and other articles published by transport associations. Secondary data was collected and analyzed to arrive at the overall market size, which was further validated through primary research.

Primary Research

Extensive primary research was conducted after obtaining an understanding of mobility as a service market through secondary research. Several primary interviews were conducted with experts from both the demand and supply sides across three major regions—North America, Europe, and Asia Pacific. Participants include taxi service and ride-hailing service providers, public transport companies, car-sharing platforms, and other technology vendors for MaaS apps. Primary data was collected through questionnaires, e-mails, and telephonic interviews. During the canvassing of primaries, we have tried to cover various departments within organizations, including sales, operations, and administration, to provide a holistic viewpoint in our reports.

After interacting with industry participants, we conducted brief sessions with experienced independent consultants to confirm the findings from the primaries. This, along with opinions from in-house subject matter experts, led us to the findings described in the remainder of this report.
Mobility as a Service Market Size, and Share

To know about the assumptions considered for the study, download the pdf brochure

Market Size Estimation

Bottom-Up Approach

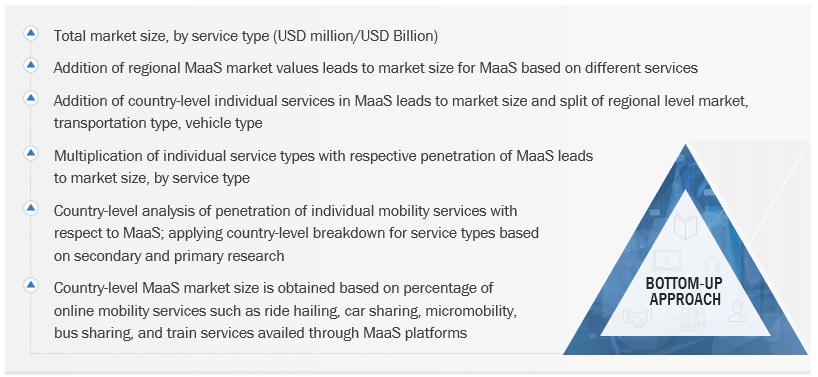
The bottom-up approach was used to estimate and validate the size of the MaaS market by service type, transportation type, and vehicle type. To determine the MaaS market size by service type, the country-level estimated share of the MaaS market for each service was multiplied by the overall ride-sharing market, which includes ride-hailing, car sharing, micro-mobility, bus sharing, and train services.

The country-level market sizes were summed up to arrive at the regional market sizes, which were further totaled to derive the global MaaS market size.

Bottom-Up Approach: Mobility as a Service Market
Mobility as a Service Market Size, and Share

To know about the assumptions considered for the study, Request for Free Sample Report

Top-Down Approach

The market sizes of the business model, propulsion type, mode, solution type, operating system, and application type segments were derived using a top-down approach and were based on the country-level penetration of MaaS and sub-segments. For instance, the application type segment size was derived based on the penetration of MaaS across different countries and the usage level of people. The business model segment size was derived based on acceptance patterns in business-to-business vs. business-to-consumer models, along with penetration in the peer-to-peer model.

The regional market for transportation type and vehicle type was derived by adding up the market numbers for different services relevant to specific transportation or vehicle types.

Top-Down Approach: Mobility as a Service Market

Mobility as a Service Market Size, and Share

Data Triangulation

All percentage shares, splits, and breakdowns were determined using secondary sources and verified through primary sources. All parameters that are expected to affect the markets covered in this research study were accounted for, viewed in extensive detail, verified through primary research, and analyzed to obtain the final quantitative and qualitative data. This data was consolidated, supplemented with detailed inputs and analysis from MarketsandMarkets, and presented in the report.

Market Definition

Mobility as a Service (MaaS) is the integration of and access to different transport services (such as public transport, ride-sharing, car sharing, bike-sharing, scooter-sharing, taxi, car rental, and ride-hailing) in a single digital mobility offering, with active mobility and an efficient public transport system at its base. This tailor-made service suggests the most suitable solutions based on a user’s travel needs. MaaS is available anytime and offers integrated planning, booking, and payment, as well as en route information to provide easy mobility without having to own a car.

Stakeholders

  • Investment Firms
  • Mobility as a Service Solution Provider
  • Ride Sharing Service Providers
  • Public Transport Organizations
  • Regulatory Authorities

Report Objectives

  • To describe and forecast the mobility as a service market, in terms of value, based on By Service Type, By Business Model, By Solution Type, Transportation type, Vehicle Type, Application Type, Operating Systems, Propulsion Type, Payment type, Commute type.
  • To describe and forecast the mobility as a service market size, in terms of value, with respect to 4 main regions, namely, North America, Europe, Asia Pacific, and the Rest of the World (RoW)
  • To provide detailed information regarding the major factors influencing the growth of the market (drivers, restraints, opportunities, and industry-specific challenges).
  • To strategically analyze the market through Porter’s Five Forces analysis, trade analysis, trends/disruptions impacting buyers, case studies, patent analysis, supply chain analysis, market ecosystem, regulatory analysis, and technology trends.
  • To analyze the market share of leading players in the mobility as a service market and evaluate competitive leadership mapping.
  • To strategically analyze the key player strategies/right to win and company revenue analysis.
  • To analyze the opportunities in the market for stakeholders and provide details of the competitive landscape for market leaders.
  • To provide an analysis of recent developments, alliances, joint ventures, mergers & acquisitions, product launches, and other activities carried out by key industry participants in the mobility as a service market.

Additional Customization

With the given market data, MarketsandMarkets offers customizations to meet the company’s specific needs.

  • Country-wise information
  • Analysis of additional countries (up to five)
  • Company Information
  • Detailed analysis and profiling of additional market players (up to five)
Custom Market Research Services

We will customize the research for you, in case the report listed above does not meet with your exact requirements. Our custom research will comprehensively cover the business information you require to help you arrive at strategic and profitable business decisions.

Request Customization

Instant Answers with GPT - Ask Now!

Ask real questions. Get complete answers !
Report Code
AT 7286
Published ON
Aug, 2023
Choose License Type
BUY NOW
  • SHARE
X
Request Customization
Speak to Analyst
Speak to Analyst
OR FACE-TO-FACE MEETING
PERSONALIZE THIS RESEARCH
  • Triangulate with your Own Data
  • Get Data as per your Format and Definition
  • Gain a Deeper Dive on a Specific Application, Geography, Customer or Competitor
  • Any level of Personalization
REQUEST A FREE CUSTOMIZATION
LET US HELP YOU!
  • What are the Known and Unknown Adjacencies Impacting the Mobility as a Service Market
  • What will your New Revenue Sources be?
  • Who will be your Top Customer; what will make them switch?
  • Defend your Market Share or Win Competitors
  • Get a Scorecard for Target Partners
CUSTOMIZED WORKSHOP REQUEST
+1-888-600-6441
  • Call Us
  • +1-888-600-6441 (Corporate office hours)
  • +1-888-600-6441 (US/Can toll free)
  • +44-800-368-9399 (UK office hours)
CONNECT WITH US
ABOUT TRUST ONLINE
©2024 MarketsandMarkets Research Private Ltd. All rights reserved
DMCA.com Protection Status Website Feedback