Multi-Touch Marketing Attribution Software Market by Component (Solution and Services), Organization Size (SMEs and Large Enterprises), Deployment Type (Cloud and On-Premises), Vertical, and Region - Global Forecast to 2023


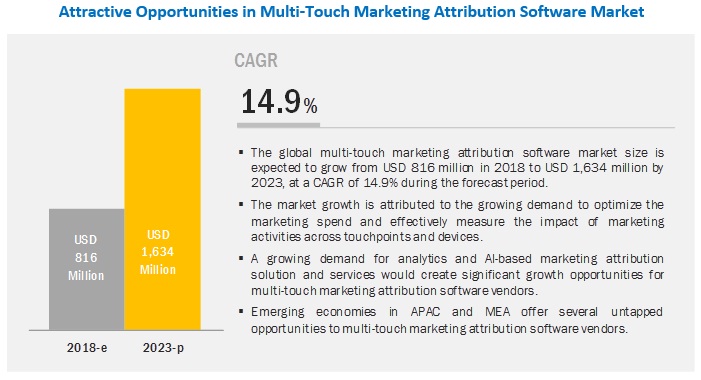
[122 Pages Report] MarketsandMarkets expects the global multi-touch marketing attribution software market size to grow from USD 816 million in 2018 to USD 1,634 million by 2023, at a Compound Annual Growth Rate (CAGR) of 14.9% during the forecast period. The major factors driving the growth of market are rising need to optimize marketing spend and growing number of marketing channels to reach end customers.
By deployment type, the on-premises segment to hold the largest market size during the forecast period
The on-premises deployment type segment refers to the installation of multi-touch marketing attribution software on the company�s server within the existing IT infrastructure. The on-premises software is usually delivered with a one-time license fee and an annual service agreement, which includes free upgrades and new functionalities after a defined time. With on-premises deployment, enterprises have complete control over the software as it is physically implemented at the premises. Companies that are risk-averse opt for the on-premises mode of deployment as it does not involve any security concerns related to storing vital assets on a third-party vendor�s infrastructure.
By organization size, the SMEs segment to grow at the fastest CAGR during the forecast period
SMEs have been mainly relying on the manual process of prospecting customers through social media, web, and other interfaces. These enterprises mostly communicate through mass mailing the content to the entire set of databases and thereafter taking subsequent follow-ups. The adoption trend of the multi-touch marketing attribution solution among SMEs is low in comparison to large enterprises. The reason for the low adoption of the multi-touch marketing attribution solution could be the lack of awareness or budgetary constraints. However, with the proliferation of social content, the attention span of viewers is dwindling at high rates. The need to have a proper implementation of multi-touch marketing attribution models becomes the need of the hour for enterprises to analyze effective marketing campaigns and optimize RoI to thrive in such competitive times.
The Telecom and IT segment to hold the largest market size during the forecast period
Enterprises in the telecommunications and IT vertical are focusing on effectively targeting new users and decreasing the attribution rate of the existing customers. They are emphasizing on implementing effective marketing campaigns to increase its subscriber base and thus are targeting users via different online channels. Following fierce competition in the market, enterprises need result-oriented marketing strategy in place for acquiring maximum users and have a competitive edge over its competitors. The increase in the number of internet and mobile devices is said to have fueled the growth of the telecom and IT vertical in the multi-touch marketing attribution software market. Multi-touch marketing attribution solutions help telcos and IT enterprises to analyze effective digital channel in order to optimize its marketing spends and improve the user experience. This vertical is at the forefront of leveraging multi-touch marketing attribution solutions due to the emerging need for effectively targeting the audience via the right communication channel. The global telco providers are embracing multi-touch marketing attribution strategies to facilitate their marketing campaigns and improve end-user experience.
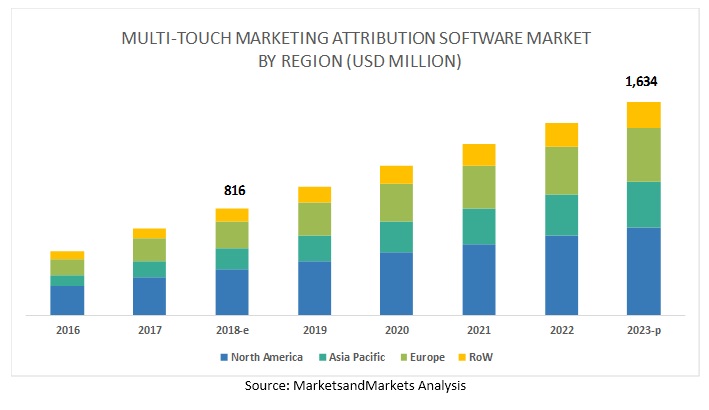
North America to account for the largest market size during the forecast period
North America is expected to hold the largest market size and dominate the global multi-touch marketing attribution software market from 2018 to 2023. The region mainly has a high concentration of large multinational companies, which largely contribute to the growth of the marketing attribution software market. APAC is expected to provide lucrative opportunities for the multi-touch marketing attribution software vendors owing to the increasing demand for the consistent data-driven marketing solutions among enterprises in the region. The increasing number of government regulations and compliances in various regions could affect the adoption of multi-touch marketing attribution software.
Key Market Players
Major vendors offering multi-touch marketing attribution solutions and services across the globe include Adobe (US), SAP (Germany), Visual IQ (US), Oracle (US), Neustar (US), LeadsRx (US), LeanData (US), Merkle (US), Roivenue (Czech Republic), C3 Metrics (US), AppsFlyer (US), Equifax (US), Windsor.ai (Switzerland), Manthan (India), and Oribi (Israel).
Adobe has established itself as a strong brand among the leading players in the multi-touch market attribution software market. The company is strengthening its product portfolio by introducing new products and updating the existing products with new capabilities. It focuses on delivering services to content creators, digital media professionals, and web application developers. The company constantly invests in R&D activities to strengthen its solutions. For instance, in 2018, the company invested 16.8% on revenue on R&D activities. It has adopted inorganic growth strategies, such as acquisitions & partnerships, to strengthen its offerings and presence in the attribution software market. For instance, in October 2018, the company acquired Marketo to offer a combination of Adobe Experience Cloud�s analytics, personalization, and content capabilities with Marketo�s lead management, account-based marketing, and revenue attribution technology to its customers.
Get online access to the report on the World's First Market Intelligence Cloud
- Easy to Download Historical Data & Forecast Numbers
- Company Analysis Dashboard for high growth potential opportunities
- Research Analyst Access for customization & queries
- Competitor Analysis with Interactive dashboard
- Latest News, Updates & Trend analysis
Request Sample Scope of the Report
Get online access to the report on the World's First Market Intelligence Cloud
- Easy to Download Historical Data & Forecast Numbers
- Company Analysis Dashboard for high growth potential opportunities
- Research Analyst Access for customization & queries
- Competitor Analysis with Interactive dashboard
- Latest News, Updates & Trend analysis

|
Report Metric |
Details |
|
Market size available for years |
2016�2023 |
|
Base year considered |
2017 |
|
Forecast period |
2018�2023 |
|
Forecast 2018-2023 CAGR |
14.9% |
|
Estimated Year Market Size |
USD 816 million in 2018 |
|
Forecast Year Market Size |
USD 1,634 million by 2023 |
|
Segments covered |
Component, Organization size, Deployment Type, Vertical, and Region |
|
Geographies covered |
North America, Europe, APAC, Latin America, and MEA |
|
Companies covered |
Adobe (US), SAP (Germany), Visual IQ (US), Oracle (US), Neustar (US), LeadsRx (US), LeanData (US), Merkle (US), Roivenue (Czech Republic), C3 Metrics (US), AppsFlyer (US), Equifax (US), Windsor.ai (Switzerland), Manthan (India), and Oribi (Israel) |
This research report categorizes the market to forecast revenues and analyze trends in each of the following submarkets:
On the basis of component, the market has been segmented as follows:
- Solution
- Services
On the basis of organization size, the multi-touch marketing attribution software market has been segmented as follows:
- SMEs
- Large Enterprises
On the basis of deployment type, the market has been segmented as follows:
- Cloud
- On-premises
On the basis of vertical, the multi-touch marketing attribution software market has been segmented as follows:
- Retail
- FMCG and Consumer Packaged Goods
- Computing Products and Consumer Electronics
- Telecom and IT
- BFSI
- Media and Entertainment
- Healthcare
- Travel and Hospitality
- Others (Education and Government)
On the basis of region, the multi-touch marketing attribution software market has been segmented as follows:
- North America
- US
- Canada
- Europe
- Germany
- UK
- France
- Rest of Europe
- APAC
- Australia and New Zealand (ANZ)
- China
- India
- Rest of APAC
- MEA
- Kingdom of Saudi Arabia (KSA)
- South Africa
- United Arab Emirates (UAE)
- Rest of MEA
- Latin America
- Brazil
- Mexico
- Rest of Latin America
Key questions addressed by the report
- What are the major challenges faced while deploying multi-touch marketing attribution solutions in different application areas?
- Where and to what extent organizations need multi-touch marketing attribution solutions?
- What are key industry trends in multi-touch marketing attribution software market?
- What is the level of preparedness of enterprises to deal with unforeseen business risks?
- What are the challenges faced by multi-touch marketing attribution solutions providers while integrating innovative technologies with a client�s existing IT infrastructure?
Frequently Asked Questions (FAQ):
What is Multi-touch Marketing Attribution?
What are the top companies providing Multi-touch Marketing Attribution solutions and services?
What is the impact of multi-touch marketing attribution over the Telecom and IT Industry?
Which deployment type holds the larger market size in the global multi-touch marketing attribution market?
To speak to our analyst for a discussion on the above findings, click Speak to Analyst
Table of Contents
1 Introduction (Page No. - 15)
1.1 Objectives of the Study
1.2 Market Definition
1.3 Market Scope
1.3.1 Market Segmentation
1.3.2 Regions Covered
1.4 Years Considered for the Study
1.5 Currency Considered
1.6 Stakeholders
2 Research Methodology (Page No. - 19)
2.1 Research Data
2.1.1 Secondary Data
2.1.2 Primary Data
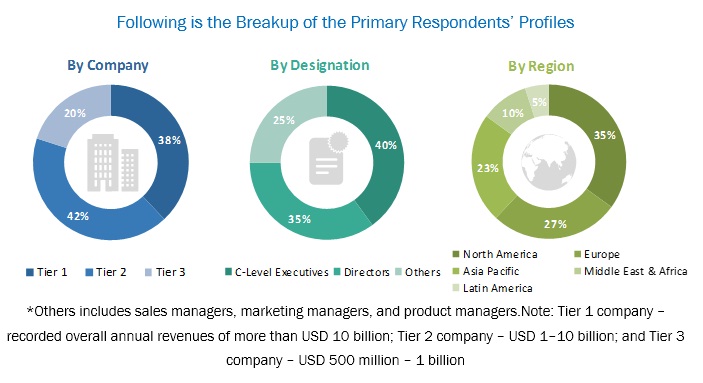
2.1.2.1 Breakup of Primary Profiles
2.1.2.2 Key Industry Insights
2.2 Market Breakup and Data Triangulation
2.3 Market Size Estimation
2.3.1 Top-Down Approach
2.3.2 Bottom-Up Approach
2.4 Market Forecast
2.5 Assumptions for the Study
2.6 Limitations of the Study
3 Executive Summary (Page No. - 26)
4 Premium Insights (Page No. - 29)
4.1 Attractive Opportunities in the Multi-Touch Marketing Attribution Software Market
4.2 Market in North America, By Vertical and Country
4.3 Market Major Countries
5 Market Overview and Industry Trends (Page No. - 32)
5.1 Introduction
5.2 Market Dynamics
5.2.1 Drivers
5.2.1.1 Growing Number of Marketing Channels to Reach End Customers
5.2.1.2 Increasing Focus of Enterprises to Optimize Marketing Spend
5.2.2 Restraints
5.2.2.1 Inconsistent Historic Data Format Makes Data Processing Laborious
5.2.2.2 Constantly Changing Regulatory Environment Across the World
5.2.3 Opportunities
5.2.3.1 Proliferation of Big Data and Analytics
5.2.3.2 Growing Demand for B2b Marketing Attribution Solutions
5.2.4 Challenges
5.2.4.1 Selection of A Relevant Multi-Touch Marketing Attribution Model and Vendor
5.3 Industry Trends
5.3.1 Use Case 1: Fospha
5.3.2 Use Case 2: Equifax
5.3.3 Use Case 3: Optimine
6 Multi-Touch Marketing Attribution Software Market, By Component (Page No. - 37)
6.1 Introduction
6.2 Solution
6.2.1 Increased Need Among Organizations to Measure Effectiveness of their ExistMulti-Touch Marketing Attribution Solution Among Enterprises
6.3 Services
6.3.1 Integration and Implementation Services
6.3.1.1 Need to Adopt Industry Ready Multi-Touch Marketing Attribution Solution for MarketinAdoption of Integration and Implementation Services
6.3.2 Advisory Services
6.3.2.1 Growing Need to Adopt the Best Multi-Touch Marketing Attribution Model to Boost the Adoption of Advisory Services Among Enterprises
6.3.3 Support and Maintenance Services
6.3.3.1 Focus on Continuous Technical Assistance and Upgrading Existing Technology With the Pace of Technological AdvancementAnd Maintenance Services
7 Multi-Touch Marketing Attribution Software Market, By Deployment Type (Page No. - 43)
7.1 Introduction
7.2 On-Premises
7.2.1 Security Concerns Among Large Enterprises to Drive the Adoption of On-Premises Multi-Touch Marketing Attribution Solutions
7.3 Cloud
7.3.1 Scalability and Cost-Effectiveness of Cloud-Based Multi-Touch Marketing Attribution Solutions to Drive their Adoption During the Forecast Period46
8 Multi-Touch Marketing Attribution Software Market, By Organization Size (Page No. - 47)
8.1 Introduction
8.2 Small and Medium-Sized Enterprises
8.2.1 Need for Cost-Effective Attribution Solutions to Gain Competitive Edge in Highly Dynamic Market to Boost the AAttribution Solution Among Smes
8.3 Large Enterprises
8.3.1 Fierce Competition Among Enterprises in the Market to Drive the Market Among Large Enterprises
9 Multi-Touch Marketing Attribution Software Market, By Vertical (Page No. - 51)
9.1 Introduction
9.2 Retail
9.2.1 Heavy Internet Penetration Across Major Economies and Customer Reliance Attribution Solution Among Enterprises in the Retail Vertical
9.3 Fast Moving Consumer Goods and Consumer Packaged Goods
9.3.1 Increasing Use of Online Channels By Consumer to Drive the Adoption of the Multi-Touch Marketing Attribution Solution Among of Fmcg and Cpg
9.4 Computing Products and Consumer Electronics
9.4.1 High Competition and Dynamic Customer Requirements During Purchase of Goods to Propel the Adoption of the Multi-Touch Enterprises
9.5 Telecom and It
9.5.1 Significant Increase in Internet Penetration, Dynamic Customer Needs, and Fierce Competition to DriveAttribution Solution AmongCompanies
9.6 Banking, Financial Services and Insurance
9.6.1 Aggressive Shift of Bfsi Enterprises Toward Digital Medium to Propel the Adoption of the Multi-Touch Marketing Attribution Solution
9.7 Media and Entertainment
9.7.1 Increased Need to Enhance Customer Experience and Measure Effectiveness of Marketing Channels Amidst HigMarketing Attribution Software Market
9.8 Healthcare
9.8.1 Need to Manage Marketing Spends and Identify Effective Digital Channels for Marketing Activities TAttribution Solution Among Enterprises
9.9 Travel and Hospitality
9.9.1 Need to Have Competitive Advantage and Effectively Carry Out Marketing Campaigns to ReMulti-Touch Marketing Attribution Software Market
9.1 Others
10 Multi-Touch Marketing Attribution Software Market, By Region (Page No. - 61)
10.1 Introduction
10.2 North America
10.2.1 United States
10.2.1.1 Increasing Digital Channel Effectiveness to Drive the Multi-Touch Marketing Attribution Software Market in the Us
10.2.2 Canada
10.2.2.1 Need for Measuring and Analyzing Marketing Performance to Increase the Adoption of the Multi-Touch MarketinOrganizations in Canada
10.3 Europe
10.3.1 United Kingdom
10.3.1.1 Growing Need to Analyze Performance Metrics of Marketing Campaigns to Drive the Adoption of the Multi-Touch Marketing Attribution Solution70
10.3.2 Germany
10.3.2.1 Increase in Need for Multi-Channel Marketing and Rise of Data Volume in the Arena of Marketing to PropMarketing Attribution Software M70
10.3.3 France
10.3.3.1 Increased Awareness Among Enterprises to Understand How Digital Channels Work Together to Drive the GroAttribution Software Market
10.3.4 Rest of Europe
10.4 Asia Pacific
10.4.1 Australia and New Zealand
10.4.1.1 Need to Effectively Analyze Complex Marketing Data to Fuel the Adoption of the Multi-Touch Marketing Attribution Solution
10.4.2 China
10.4.2.1 Demand for Consistent Data-Driven Marketing Solutions Among Clients to Drive the Multi-Touch Marketing Attribution Software Market
10.4.3 India
10.4.3.1 Increased Awareness Among Enterprises to Smoothen their Marketing Activities to Propel the Adoption of the Multi-Touch MarkSolution
10.4.4 Rest of Asia Pacific
10.5 Middle East and Africa
10.5.1 Kingdom of Saudi Arabia
10.5.1.1 Increased Need to Quantify the Relative Impact of Marketing Revenue to Propel the Multi-Touch Marketing Attribution Software Market in Ks79
10.5.2 United Arab Emirates
10.5.2.1 On-the-Go Marketing Fostered By Mobile Gadgets Across Marketing Channels to Boost the Need to AdSolution Among Enterprises in the UAE
10.5.3 South Africa
10.5.3.1 Increasing Pressure on Marketing Teams to Improve Roi on Marketing Spends to Boost The Adoption of the MulSolution in South Africa
10.5.4 Rest of Middle East and Africa
10.6 Latin America
10.6.1 Brazil
10.6.1.1 Need to Attribute Cross-Device Measurement Among Enterprises for Smart Spending and High Returns TMarketing Attribution Software Market
10.6.2 Mexico
10.6.2.1 Improving Customer Experience Throughout Buying Journey and Identifying Effective Marketing ChTouch Marketing Attribution Solution
10.6.3 Rest of Latin America
11 Competitive Landscape (Page No. - 84)
11.1 Overview
11.2 Competitive Scenario
11.2.1 Product/Service/Solution Launches and Enhancements
11.2.2 Business Expansions
11.2.3 Acquisitions
11.2.4 Partnerships, Agreement, and Collaborations
11.3 Competitive Leadership Mapping
11.3.1 Visionary Leaders
11.3.2 Dynamic Differentiators
11.3.3 Innovators
11.3.4 Emerging Companies
12 Company Profiles (Page No. - 91)
12.1 Adobe
12.1.1 Business Overview
12.1.2 Solutions Offered
12.1.3 Recent Developments
12.1.4 SWOT Analysis
12.1.5 MnM View
12.2 SAP
12.2.1 Business Overview
12.2.2 Solutions Offered
12.2.3 Recent Developments
12.2.4 SWOT Analysis
12.2.5 MnM View
12.3 Oracle
12.3.1 Business Overview
12.3.2 Products Offered
12.3.3 Recent Developments
12.3.4 SWOT Analysis
12.3.5 MnM View
12.4 Merkle
12.4.1 Business Overview
12.4.2 Solutions Offered
12.4.3 Recent Developments
12.4.4 SWOT Analysis
12.4.5 MnM View
12.5 Visual IQ
12.5.1 Business Overview
12.5.2 Solutions Offered
12.5.3 Recent Developments
12.5.4 SWOT Analysis
12.5.5 MnM View
12.6 Leandata
12.6.1 Business Overview
12.6.2 Products Offered
12.6.3 Recent Developments
12.6.4 MnM View
12.7 Neustar
12.7.1 Business Overview
12.7.2 Products Offered
12.7.3 Recent Developments
12.7.4 MnM View
12.8 Roivenue
12.8.1 Business Overview
12.8.2 Products Offered
12.9 C3 Metrics
12.9.1 Business Overview
12.9.2 Solutions Offered
12.10 Appsflyer
12.10.1 Business Overview
12.10.2 Products Offered
12.10.3 Recent Developments
12.10.4 MnM View
12.11 Leadsrx
12.12 Equifax
12.13 Windsor.Ai
12.14 Manthan
12.15 Oribi
13 Appendix (Page No. - 115)
13.1 Discussion Guide
13.2 Knowledge Store: Marketsandmarkets� Subscription Portal
13.3 Available Customizations
13.4 Related Reports
13.5 Author Details
List of Tables (61 Tables)
Table 1 United States Dollar Exchange Rate, 2015�2017
Table 2 Factor Analysis
Table 3 Multi-Touch Marketing Attribution Software Market Size, By Component, 2016�2023 (USD Million)
Table 4 Solution: Market Size, By Region, 2016�2023 (USD Million)
Table 5 Market Size, By Service, 2016�2023 (USD Million)
Table 6 Services: Market Size, By Region, 2016�2023 (USD Million)
Table 7 Integration and Implementation Services Market Size, By Region, 2016�2023 (USD Million)
Table 8 Advisory Services Market Size, By Region, 2016�2023 (USD Million)
Table 9 Support and Maintenance Services Market Size, By Region, 2016�2023 (USD Million)
Table 10 Multi-Touch Marketing Attribution Software Market Size, By Deployment Type, 2016�2023 (USD Million)
Table 11 On-Premises: Market Size, By Region, 2016�2023 (USD Million)
Table 12 Cloud: Market Size, By Region, 2016�2023 (USD Million)
Table 13 Market Size, By Organization Size, 2016�2023 (USD Million)
Table 14 Small and Medium-Sized Enterprises: Market Size, By Region, 2016�2023 (USD Million)
Table 15 Large Enterprises: Market Size, By Region, 2016�2023 (USD Million)
Table 16 Multi-Touch Marketing Attribution Software Market Size, By Vertical, 2016�2023 (USD Million)
Table 17 Retail: Market Size, By Region, 2016�2023 (USD Million)
Table 18 Fast Moving Consumer Goods and Consumer Packaged Goods: Market Size, By Region, 2016�54
Table 19 Computing Products and Consumer Electronics: Market Size, By Region, 2016�2023 (USD Million)
Table 20 Telecom and It: Market Size, By Region, 2016�2023 (USD Million)
Table 21 Banking, Financial Services, and Insurance: Market Size, By Region, 2016�2023 (USD Million)
Table 22 Media and Entertainment: Market Size, By Region, 2016�2023 (USD Million)
Table 23 Healthcare: Market Size, By Region, 2016�2023 (USD Million)
Table 24 Travel and Hospitality: Market Size, By Region, 2016�2023 (USD Million)
Table 25 Others: Market Size, By Region, 2016�2023 (USD Million)
Table 26 Multi-Touch Marketing Attribution Software Market Size, By Region, 2016�2023 (USD Million)
Table 27 North America: Market Size, By Component, 2016�2023 (USD Million)
Table 28 North America: Market Size, By Service Type, 2016�2023 (USD Million)
Table 29 North America: Market Size, By Deployment Type, 2016�2023 (USD Million)
Table 30 North America: Market Size, By Organization Size, 2016�2023 (USD Million)
Table 31 North America: Market Size, By Vertical, 2016�2023 (USD Million)
Table 32 North America: Market Size, By Country, 2016�2023 (USD Million)
Table 33 Europe: Multi-Touch Marketing Attribution Software Market Size, By Component, 2016�2023 (USD Million)
Table 34 Europe: Market Size, By Service Type, 2016�2023 (USD Million)
Table 35 Europe: Market Size, By Deployment Type, 2016�2023 (USD Million)
Table 36 Europe: Market Size, By Organization Size, 2016�2023 (USD Million)
Table 37 Europe: Market Size, By Vertical, 2016�2023 (USD Million)
Table 38 Europe: Market Size, By Country, 2016�2023 (USD Million)
Table 39 Asia Pacific: Multi-Touch Marketing Attribution Software Market Size, By Component, 2016�2023 (USD Million)
Table 40 Asia Pacific: Market Size, By Service Type, 2016�2023 (USD Million)
Table 41 Asia Pacific: Market Size, By Deployment Type, 2016�2023 (USD Million)
Table 42 Asia Pacific: Market Size, By Organization Size, 2016�2023 (USD Million)
Table 43 Asia Pacific: Market Size, By Vertical, 2016�2023 (USD Million)
Table 44 Asia Pacific: Market Size, By Country, 2016�2023 (USD Million)
Table 45 Middle East and Africa: Multi-Touch Marketing Attribution Software Market Size, By Component, 2016�2023 (USD Million)
Table 46 Middle East and Africa: Market Size, By Service Type, 2016�2023 (USD Million)
Table 47 Middle East and Africa: Market Size, By Deployment Type, 2016�2023 (USD Million)
Table 48 Middle East and Africa: Market Size, By Organization Size, 2016�2023 (USD Million)
Table 49 Middle East and Africa: Market Size, By Vertical, 2016�2023 (USD Million)
Table 50 Middle East and Africa: Market Size, By Country, 2016�2023 (USD Million)
Table 51 Latin America: Multi-Touch Marketing Attribution Software Market Size, By Component, 2016�2023 (USD Million)
Table 52 Latin America: Market Size, By Service Type, 2016�2023 (USD Million)
Table 53 Latin America: Market Size, By Deployment Type, 2016�2023 (USD Million)
Table 54 Latin America: Market Size, By Organization Size, 2016�2023 (USD Million)
Table 55 Latin America: Market Size, By Vertical, 2016�2023 (USD Million)
Table 56 Latin America: Market Size, By Country, 2016�2023 (USD Million)
Table 57 Product/Service/Solution Launches and Enhancements, 2017�2018
Table 58 Business Expansions, 2018
Table 59 Acquisitions, 2017�2018
Table 60 Partnerships, Agreement, Collaborations, 2017�2018
Table 61 Evaluation Criteria
List of Figures (28 Figures)
Figure 1 Multi-Touch Marketing Attribution Software Market: Research Design
Figure 2 Market Bottom-Up and Top-Down Approaches
Figure 3 Asia Pacific to Grow at the Highest Cagr During the Forecast Period
Figure 4 Telecom and It Vertical to Hold the Highest Market Share in 2018
Figure 5 Support and Maintenance Services Segment to Account for the Highest Market Share in 2018
Figure 6 Increasing Need to Justify Marketing Spend to Drive the Market During the Forecast Period
Figure 7 Telecom and It, and United States to Dominate the North American Multi-Touch Marketing Attribution Software Market in 2018
Figure 8 India to Grow at the Highest Cagr in the Market During the Forecast Period
Figure 9 Drivers, Restraints, Opportunities, and Challenges: Multi-Touch Marketing Attribution Software Market
Figure 10 Services Segment to Grow at A Higher Cagr During the Forecast Period
Figure 11 Cloud Segment to Grow at A Higher Cagr During the Forecast Period
Figure 12 Small and Medium-Sized Enterprises Segment to Grow at A Higher Cagr During the Forecast Period
Figure 13 Media and Entertainment Vertical to Grow at the Highest Cagr During the Forecast Period
Figure 14 North America to Hold the Highest Market Share in 2018
Figure 15 Asia Pacific to Grow at the Highest Cagr During the Forecast Period
Figure 16 North America: Market Snapshot
Figure 17 Asia Pacific: Market Snapshot
Figure 18 Key Developments in the Multi-Touch Marketing Attribution Software Market, 2016�2018
Figure 19 Market Evaluation Framework
Figure 20 Multi-Touch Marketing Attribution Software Market (Global) Competitive Leadership Mapping, 2018
Figure 21 Adobe: Company Snapshot
Figure 22 SWOT Analysis: Adobe
Figure 23 SAP: Company Snapshot
Figure 24 SWOT Analysis: SAP
Figure 25 Oracle: Company Snapshot
Figure 26 SWOT Analysis: Oracle
Figure 27 SWOT Analysis: Merkle
Figure 28 SWOT Analysis: Visual IQ
The study involved 4 major activities in estimating the current market size of multi-touch marketing attribution software market. Exhaustive secondary research was done to collect information on the market. The next step was to validate these findings, assumptions, and sizing with industry experts across the value chain using primary research. Both top-down and bottom-up approaches were employed to estimate the complete market size. Thereafter, the market breakup and data triangulation procedures were used to estimate the market size of the segments and subsegments of the multi-touch marketing attribution software market.
Secondary research
In the secondary research process, various secondary sources, such as D&B Hoovers, Bloomberg BusinessWeek, and Factiva have been referred to, for identifying and collecting information for this study. Secondary sources included annual reports, press releases and investor presentations of companies, whitepapers, certified publications and articles by recognized authors, gold standard and silver standard websites, regulatory bodies, trade directories, and databases.
Primary research
The marketing attribution software market comprises several stakeholders, such as multi-touch marketing attribution software vendors, digital marketing solution providers, managed service providers, marketing analytics vendors, advertising agencies, system integrators, consulting service providers, resellers and distributors, research organizations, government agencies, enterprise users, technology providers, venture capitalists, private equity firms, and start-up companies. The demand side of the multi-touch marketing attribution software market consists of enterprises across industry verticals: BFSI, media and entertainment, retail, FMCG and CPG, computing products and consumer electronics, healthcare, telecom and IT, and travel and hospitality. The supply side includes multi-touch marketing attribution software providers offering multi-touch marketing attribution solution and services. Various primary sources from both the supply and demand sides of the market were interviewed to obtain qualitative and quantitative information.
To know about the assumptions considered for the study, download the pdf brochure
Market size estimation
Both top-down and bottom-up approaches were used to estimate and validate the total size of the multi-touch marketing attribution software market. These methods were also used extensively to estimate the size of various subsegments in the market. The research methodology used to estimate the market size includes the following:
- The key players in the industry and markets have been identified through extensive secondary research.
- The industry�s supply chain and market size, in terms of value, have been determined through primary and secondary research processes.
- All percentage shares, splits, and breakdowns have been determined using secondary sources and verified through primary sources.
Data triangulation
After arriving at the overall market size using the market size estimation processes as explained above, the market was split into several segments and subsegments. To complete the overall market engineering process and arrive at the exact statistics of each market segment and subsegment, the data triangulation and market breakdown procedures were employed, wherever applicable. The data was triangulated by studying several factors and trends from both the demand and supply sides.
Report objectives
- To define, describe, and forecast the multi-touch marketing attribution software market by component, deployment type, organization size, vertical, and region
- To provide detailed information about major factors (drivers, restraints, opportunities, and industry-specific challenges) influencing the growth of the market
- To analyze the market with respect to individual growth trends, prospects, and contributions to the multi-market
- To forecast the market size of the 5 main regional segments, namely, North America, Europe, Asia Pacific (APAC), Middle East and Africa (MEA), and Latin America
- To analyze opportunities in the market for stakeholders by identifying high-growth segments of the multi-touch marketing attribution software market
- To profile the key players in the market and comprehensively analyze their core competencies in each microsegment
- To analyze the competitive developments, such as agreements, alliances, joint ventures, and mergers & acquisitions, in the market
Available customizations
With the given market data, MarketsandMarkets offers customizations as per the company�s specific needs. The following customization options are available for the report:
Product analysis
- Product matrix gives a detailed comparison of the product portfolio of each company
Geographic analysis
- Further breakup of the European multi-touch marketing attribution software market into countries
- Further breakup of the APAC market into countries
- Further breakup of the MEA market into countries
- Further breakup of the Latin American market into countries
Company information
- Detailed analysis and profiling of additional market players


Growth opportunities and latent adjacency in Multi-Touch Marketing Attribution Software Market