SCADA Oil & Gas Market by System Architecture (Hardware Components, Software Solutions (Cloud Based & Others), and Services), Value Stream (Upstream, Midstream, and Downstream), and by Region - Trends and Global Forecast to 2022


[169 Pages Report] The SCADA oil & gas market was valued at USD 3.27 Billion in 2016 and is projected to be worth USD 4.52 Billion by 2022, at a CAGR of 5.77%. The global market is driven by factors, such as, increased demand for remote management of oil & gas pipelines, increased thrust on process optimization through automation and digitalization, increasing penetration of cloud computing services in the SCADA system, and increase in pipeline networks.
The years considered for the study are as follows:
- Base Year: 2016
- Estimated Year: 2017
- Projected Year: 2022
- Forecast Period: 2017 to 2022
The base year considered for company profiles is 2016. Whenever information was unavailable for the base year, the prior year has been considered.
Objectives of the Study
- To define, describe, and forecast the market by architecture, stream, and region
- To provide detailed information regarding major factors influencing the growth of the market (drivers, restraints, opportunities, and industry-specific challenges)
- To strategically analyze the market for SCADA oil & gas with respect to individual growth trends, future prospects, and the contribution of each segment to the market
- To track and analyze competitive developments, such as contracts & agreements and partnerships and collaborations in the market
- To strategically profile key players and comprehensively analyze their market shares and core competencies
Research Methodology
This research study involved the use of extensive secondary sources, directories, and databases, such as, Hoover�s, Bloomberg Businessweek, Factiva, and OneSource, to identify and collect information useful for a technical, market-oriented, and commercial study of the this market. Primary sources are mainly industry experts from core and related industries, preferred suppliers, manufacturers, distributors, service providers, technology developers, standard and certification organizations of companies, and organizations related to all the segments of this industry�s value chain. The points given below explain the research methodology.
- Study of annual revenue and market developments of major players that supply SCADA for oil & gas
- Analysis of demand for SCADA oil & gas by architecture
- Assessment of future trends and growth of architecture in the market
- Assessment of the market of SCADA oil & gas with respect to the type of stream
- Study of market trends in various regions and countries by architecture of the market
- Study of contracts and developments related to the market by key players across different regions
- Finalization of overall market sizes by triangulating the supply-side data, which includes product developments, supply chain, and annual revenues of companies supplying SCADA for oil & gas across the globe
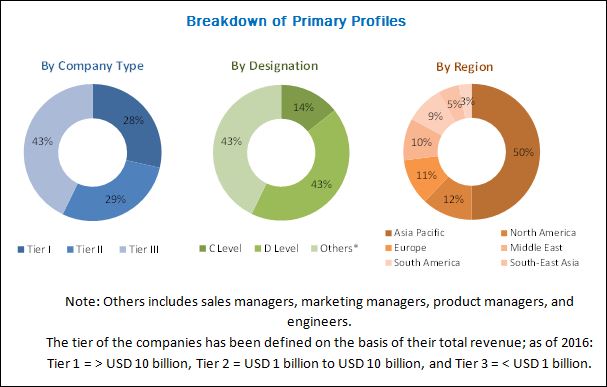
After arriving at the overall market size, the total market has been split into several segments and sub-segments. The figure given below illustrates the breakdown of primaries conducted during the research study on the basis of company type, designation, and region.
To know about the assumptions considered for the study, download the pdf brochure
The global market ecosystem comprises equipment manufacturers, such as, ABB Ltd. (Switzerland), Schneider Electric SE (France), Rockwell Automation, Inc. (US), Yokogawa Electric Corporation (Japan), General Electric Company (US), Honeywell International Inc. (US), CygNet Software, Inc. (US), Siemens AG (Germany), Quorum Business Solutions, Inc. (US), Larsen & Toubro Limited (India), ZTE Corporation (China), PSI AG (Germany), Mitsubishi Electric Corporation (Japan), Orbcomm Inc. (US), Iconics, Inc. (US), Detechtion Technologies (US), eLynx Technologies, LLC (US), Globalogix, Inc. (US), TRC Advanced Technologies Inc. (US), Inductive Automation (US), International Business Machines Corporation (US), TechnipFMC plc (UK), Emerson Electric Co. (US), Bentek Systems (Canada), and PetroCloud, LLC (US).
Target Audience:
The report�s target audience includes:
- SCADA Oil & gas manufacturers and suppliers
- Government and research organizations
- National and local government organizations
- Technology providers
- Institutional investors
- Associations
Get online access to the report on the World's First Market Intelligence Cloud
Request Sample Scope of the Report
:

- By Architecture
- Hardware
- Software
- Service
- By Stream
- Upstream
- Midstream
- Downstream
- By Region
- North America
- Europe
- Asia Pacific
- South-East Asia
- Middle East
- South America
- Africa
Available Customizations:
With the given market data, MarketsandMarkets offers customizations as per the client�s specific needs. The following customization options are available for this report:
Regional Analysis
Further breakdown of region and country-specific analysis
Further country specific breakdown of software sub segment in cloud based services and other services
Company Information
Detailed analyses and profiling of additional market players (up to five)
The SCADA oil & gas market is projected to grow at a CAGR of 5.77% from 2017 to 2022, to reach a market size of USD 4.52 Billion by 2022. Increased investments in pipeline networks, rising demand for remote management of oil & gas pipelines, and increased thrust on process optimization through automation and digitalization is expected to drive the this market during the forecast period.
The report segments market based on architecture into hardware, software, and services. The hardware segment dominated the market, by architecture, in 2016 accounting for the largest share in the total project spending. Hardware segment is followed by the software and services segments in terms of market share. Rising investments focused on automated devices in the oil & gas infrastructure is expected to drive the hardware segment.
Based on stream, the market is segmented into upstream, midstream, and downstream. Midstream is the largest segment for the market of SCADA oil & gas , by value stream. Rising investments in pipeline infrastructure from countries, such as, the US, Canada, Russia, China, and India, is expected to drive the market during the forecast period.
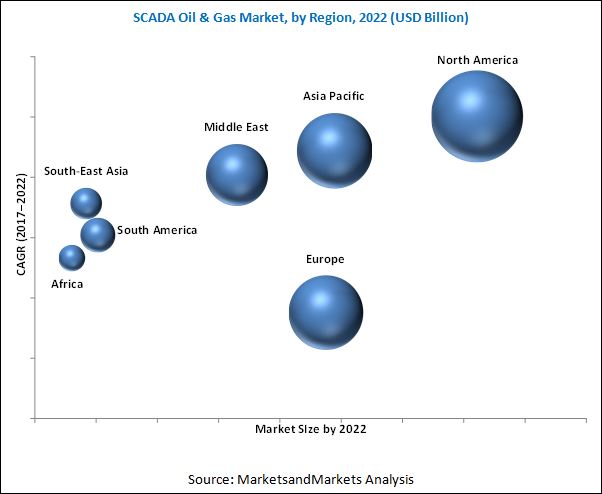
In this report, the market has been analyzed with respect to seven regions, namely, North America, Europe, Asia Pacific, South-East Asia, South America, the Middle East, and Africa. North America is expected to dominate the this market during the forecast period, due to increase in investments in the pipeline infrastructure and increased adoption of cloud services in the region. Growing investments in refineries and exploration of new oil & gas fields in the US and Canada is also expected to drive the demand for SCADA in the oil & gas industry in North America.
Declining and fluctuating oil & gas prices is expected to slow down the demand for the market during the forecast period. However, the growth in R&D in the wireless sensor network and increased use of big data analytics, offers lucrative opportunities for the market. Some of the leading players in this market includes Yokogawa Electric Corporation (Japan), General Electric Company (US), Honeywell International Inc. (US), CygNet Software, Inc. (US), Siemens AG (Germany), Schneider Electric SE (France), Rockwell Automation, Inc. (US), PSI AG (Germany), Mitsubishi Electric Corporation (Japan), Orbcomm Inc. (US), Iconics, Inc. (US), International Business Machines Corporation (US), TechnipFMC plc (UK), and Emerson Electric Co. (US). New product launches and contracts & agreements were the most commonly adopted strategies by players to ensure their dominance in the market.
To speak to our analyst for a discussion on the above findings, click Speak to Analyst
Table of Contents
1 Introduction (Page No. - 17)
1.1 Objectives of the Study
1.2 Market Definition
1.3 Market Scope
1.3.1 Markets Covered
1.3.2 Regional Scope
1.3.3 Years Considered for the Study
1.4 Currency
1.5 Limitations
1.6 Stakeholders
2 Research Methodology (Page No. - 21)
2.1 Research Data
2.1.1 Secondary Data
2.1.2 Primary Data
2.1.2.1 Key Data From Primary Sources
2.1.2.2 Key Industry Insights
2.1.2.3 Breakdown of Primary Interviews
2.2 Market Size Estimation
2.3 Market Breakdown & Data Triangulation
2.4 Research Assumptions
3 Executive Summary (Page No. - 29)
4 Market Overview (Page No. - 33)
4.1 Introduction
4.2 Market Dynamics
4.2.1 Drivers
4.2.1.1 Increasing Demand for Remote Management of Oil & Gas Pipelines
4.2.1.2 Increased Focus on Process Optimization Through Automation and Digitalization
4.2.1.3 Increased Use of Cloud Computing Services in SCADA System
4.2.1.4 Growing Pipeline Networks
4.2.1.5 Optimum and Effective Exploration of Ageing Reservoirs
4.2.2 Restraints
4.2.2.1 Impact of Declining and Fluctuating Oil & Gas Prices on Infrastructure-Related Investments
4.2.2.2 High Investments Required for Setting Up SCADA System
4.2.3 Opportunities
4.2.3.1 Increased R&D in Wireless Sensor Networks in SCADA Systems
4.2.3.2 Big Data Analytics to Widen Scope of SCADA Systems
4.2.4 Challenges
4.2.4.1 Interoperability of Multiple System Components From Different Solutions Providers
4.2.4.2 Cyber-Threats Pose Threat to Market Growth
5 Premium Insights (Page No. - 40)
5.1 Attractive Opportunities in Market, 2017�2022
5.2 Global Market, By Region, 2017-2022
5.3 North American Market, By Stream and Country, 2016
5.4 Market, By Architecture, 2017-2022
5.5 Market, By Stream, 2017 & 2022
6 Market, By Architecture (Page No. - 44)
6.1 Introduction
6.2 Hardware
6.3 Software
6.3.1 Cloud-Based Solutions
6.3.2 Other Software Solutions
6.4 Services
7 Market, By Stream (Page No. - 50)
7.1 Introduction
7.2 Upstream
7.3 Midstream
7.4 Downstream
8 Market, By Region (Page No. - 55)
8.1 Introduction
8.2 North America
8.2.1 By Architecture
8.2.1.1 By Software Solution
8.2.2 By Stream
8.2.3 By Country
8.2.3.1 Us
8.2.3.1.1 Key Ongoing Projects
8.2.3.2 Canada
8.2.3.2.1 Key Ongoing Projects
8.2.3.3 Mexico
8.2.3.3.1 Key Ongoing Projects
8.3 Europe
8.3.1 By Architecture
8.3.1.1 By Software Solution
8.3.2 By Stream
8.3.3 By Country
8.3.3.1 Russia
8.3.3.1.1 Key Ongoing Projects
8.3.3.2 Germany
8.3.3.2.1 Key Ongoing Projects
8.3.3.3 France
8.3.3.4 Uk
8.3.3.5 Norway
8.3.3.6 The Rest of Europe
8.3.3.6.1 Key Ongoing Projects
8.4 Asia Pacific
8.4.1 By Architecture
8.4.1.1 By Software Solution
8.4.2 By Stream
8.4.3 By Country
8.4.3.1 China
8.4.3.2 India
8.4.3.2.1 Key Ongoing Projects
8.4.3.3 Australia
8.4.3.3.1 Key Ongoing Projects
8.4.3.4 Japan
8.4.3.5 Rest of Asia Pacific
8.4.3.5.1 Key Ongoing Projects
8.5 South-East Asia
8.5.1 By Architecture
8.5.1.1 By Software Solution
8.5.2 By Stream
8.5.3 By Country
8.5.3.1 Indonesia
8.5.3.1.1 Key Ongoing Projects
8.5.3.2 Malaysia
8.5.3.2.1 Key Ongoing Projects
8.5.3.3 Thailand
8.5.3.3.1 Key Ongoing Projects
8.5.3.4 Vietnam
8.5.3.4.1 Key Ongoing Projects
8.6 South America
8.6.1 By Architecture
8.6.1.1 By Software Solution
8.6.2 By Stream
8.6.3 By Country
8.6.3.1 Brazil
8.6.3.1.1 Key Ongoing Projects
8.6.3.2 Argentina
8.6.3.2.1 Key Ongoing Projects
8.6.3.3 Venezuela
8.6.3.3.1 Key Ongoing Projects
8.6.3.4 Chile
8.6.3.5 Peru
8.6.3.5.1 Key Ongoing Projects
8.6.3.6 Rest of South America
8.7 Middle East
8.7.1 By Architecture
8.7.1.1 By Software Solution
8.7.2 By Stream
8.7.3 By Country
8.7.3.1 Saudi Arabia
8.7.3.2 Iran
8.7.3.3 UAE
8.7.3.4 Qatar
8.7.3.5 Key Ongoing Projects
8.7.3.6 Rest of Middle East
8.7.3.7 Key Ongoing Projects
8.8 Africa
8.8.1 By Architecture
8.8.1.1 By Software Solution
8.8.2 By Stream
8.8.3 By Country
8.8.3.1 Nigeria
8.8.3.2 Algeria
8.8.3.3 Egypt
8.8.3.4 Angola
8.8.3.5 Rest of Africa
8.8.3.6 Key Ongoing Projects
9 Competitive Landscape (Page No. - 118)
9.1 Introduction
9.2 Market Ranking Analysis
9.3 Key Players in Market
9.3.1 Key Company Focus Area
9.3.1.1 Growth Strategies in Market
9.4 Competitive Situations & Trends
10 Company Profiles (Page No. - 122)
(Overview, Strength of Product Portfolio, Business Strategy Excellence, Recent Developments, MnM View)*
10.1 ABB Ltd.
10.2 Schneider Electric Se
10.3 Rockwell Automation, Inc.
10.4 Mitsubishi Electric Corporation
10.5 Siemens AG
10.6 General Electric Company
10.7 Yokogawa Electric Corporation
10.8 PSI AG
10.9 Larsen & Toubro Limited
10.10 Emerson Electric Co.
10.11 International Business Machines Corporation (IBM)
10.12 Honeywell International Inc.
10.13 Technipfmc, PLC
*Details on Overview, Strength of Product Portfolio, Business Strategy Excellence, Recent Developments, MnM View Might Not Be Captured in Case of Unlisted Companies.
11 Appendix (Page No. - 161)
11.1 Insights of Industry Experts
11.2 Discussion Guide
11.3 Knowledge Store: Marketsandmarkets� Subscription Portal
11.4 Introducing RT: Real-Time Market Intelligence
11.5 Available Customizations
11.6 Related Reports
11.7 Author Details
List of Tables (95 Tables)
Table 1 Global Market Snapshot
Table 2 Under-Construction Gas Pipelines in India, 2017
Table 3 Global Market, By Architecture, 2015�2022 (USD Million)
Table 4 Hardware: Market, By Region, 2015�2022 (USD Million)
Table 5 Software: Market, By Region, 2015�2022 (USD Million)
Table 6 Cloud-Based Solutions: Market, By Region, 2015�2022 (USD Million)
Table 7 Other Software Solutions: Market, By Region, 2015�2022 (USD Million)
Table 8 Services: Market, By Region, 2015�2022 (USD Million)
Table 9 Global Market, By Stream, 2015�2022 (USD Million)
Table 10 Upstream: Market, By Region, 2015�2022 (USD Million)
Table 11 Midstream: Market, By Region, 2015�2022 (USD Million)
Table 12 Downstream: Market, By Region, 2015�2022 (USD Million)
Table 13 Market Size, By Region, 2015�2022 (USD Million)
Table 14 North America: Market Size, By Architecture, 2015�2022 (USD Million)
Table 15 North America: Market Size, By Software Solution, 2015�2022 (USD Million)
Table 16 North America: Market Size, By Stream, 2015�2022 (USD Million)
Table 17 North America: Market Size, By Country, 2015�2022 (USD Million)
Table 18 Ongoing Pipeline Projects in the US Oil & Gas Industry
Table 19 US: Market Size, By Architecture, 2015�2022 (USD Million)
Table 20 Ongoing Pipeline Projects in Canadian Oil & Gas Industry
Table 21 Canada: Market Size, By Architecture, 2015�2022 (USD Million)
Table 22 Ongoing Pipeline Projects in Mexican Oil & Gas Industry
Table 23 Mexico: Market Size, By Architecture, 2015�2022 (USD Million)
Table 24 Europe: Market Size, By Architecture, 2015�2022 (USD Million)
Table 25 Europe: Market Size, By Software Solution, 2015�2022 (USD Million)
Table 26 Europe: Market Size, By Stream, 2015�2022 (USD Million)
Table 27 Europe: Market Size, By Country, 2015�2022 (USD Million)
Table 28 Ongoing Pipeline Projects in Russian Oil & Gas Industry
Table 29 Russia: Market Size, By Architecture, 2015�2022 (USD Million)
Table 30 Ongoing Pipeline Projects in German Oil & Gas Industry
Table 31 Germany: Market Size, By Architecture, 2015�2022 (USD Million)
Table 32 France: Market Size, By Architecture, 2015�2022 (USD Million)
Table 33 UK: Market Size, By Architecture, 2015�2022 (USD Million)
Table 34 Norway: Market Size, By Architecture, 2015�2022 (USD Million)
Table 35 Ongoing Pipeline Projects in Rest of Europe Oil & Gas Industry
Table 36 Rest of Europe: Market Size, By Architecture, 2015�2022 (USD Million)
Table 37 Asia Pacific: Market Size, By Architecture, 2015�2022 (USD Million)
Table 38 Asia Pacific: Market Size, By Software Solution, 2015�2022 (USD Million)
Table 39 Asia Pacific: Market, By Stream, 2015�2022 (USD Million)
Table 40 Asia Pacific: Market, By Country, 2015�2022 (USD Million)
Table 41 China: Market Size, By Architecture, 2015�2022 (USD Million)
Table 42 Ongoing Pipeline Projects in Indian Oil & Gas Industry
Table 43 India: Market Size, By Architecture, 2015�2022 (USD Million)
Table 44 Ongoing Pipeline Projects in Australian Oil & Gas Industry
Table 45 Australia: Oil & Gas SCADA Market Size, By Architecture, 2015�2022 (USD Million)
Table 46 Japan: Market Size, By Architecture, 2015�2022 (USD Million)
Table 47 Ongoing Pipeline Projects in Rest of Asia Pacific Oil & Gas Industry
Table 48 Rest of Asia Pacific: Market Size, By Architecture, 2015�2022 (USD Million)
Table 49 South-East Asia: Market Size, By Architecture, 2015�2022 (USD Million)
Table 50 South-East Asia: Market Size, By Software Solution, 2015�2022 (USD Million)
Table 51 South-East Asia: Market Size, By Stream, 2015�2022 (USD Million)
Table 52 South-East Asia: Market Size, By Country, 2015�2022 (USD Million)
Table 53 Ongoing Pipeline Projects in Indonesian Oil & Gas Industry
Table 54 Indonesia: Market Size, By Architecture, 2015�2022 (USD Million)
Table 55 Ongoing Pipeline Projects in Malaysian Oil & Gas Industry
Table 56 Malaysia: Market Size, By Architecture, 2015�2022 (USD Million)
Table 57 Ongoing Pipeline Projects in Thai Oil & Gas Industry
Table 58 Thailand: Market Size, By Architecture, 2015�2022 (USD Million)
Table 59 Ongoing Pipeline Projects in Vietnamese Oil & Gas Industry
Table 60 Vietnam: Market Size, By Architecture, 2015�2022 (USD Thousand)
Table 61 South America: Market Size, By Architecture, 2015�2022 (USD Million)
Table 62 South America: Market Size, By Software Solution, 2015�2022 (USD Million)
Table 63 South America: Market Size, By Stream, 2015�2022 (USD Million)
Table 64 South America: Market, By Country, 2015�2022 (USD Million)
Table 65 Ongoing Pipeline Projects in Brazilian Oil & Gas Industry
Table 66 Brazil: Market Size, By Architecture, 2015�2022 (USD Million)
Table 67 Ongoing Pipeline Projects in Argentinean Oil & Gas Industry
Table 68 Argentina: Market Size, By Architecture, 2015�2022 (USD Million)
Table 69 Ongoing Pipeline Projects in Venezuelan Oil & Gas Industry
Table 70 Venezuela: Market Size, By Architecture, 2015�2022 (USD Million)
Table 71 Chile: Market Size, By Architecture, 2015�2022 (USD Thousand)
Table 72 Ongoing Pipeline Projects in Peruvian Oil & Gas Industry
Table 73 Peru: Market Size, By Architecture, 2015�2022 (USD Thousand)
Table 74 Rest of South America: Market Size, By Architecture, 2015�2022 (USD Thousand)
Table 75 Middle East: Market Size, By Architecture, 2015�2022 (USD Million)
Table 76 Middle East: Market Size, By Software Solution, 2015�2022 (USD Million)
Table 77 Middle East: Market Size, By Stream, 2015�2022 (USD Million)
Table 78 Middle East: Market Size, By Country, 2015�2022 (USD Million)
Table 79 Saudi Arabia: Market Size, By Architecture, 2015�2022 (USD Million)
Table 80 Iran: Market Size, By Architecture, 2015�2022 (USD Million)
Table 81 UAE: Market Size, By Architecture, 2015�2022 (USD Million)
Table 82 Ongoing Pipeline Projects in Qatar Oil & Gas Industry
Table 83 Qatar: Market Size, By Architecture, 2015�2022 (USD Million)
Table 84 Ongoing Pipeline Projects in Rest of Middle East Oil & Gas Industry
Table 85 Rest of Middle East: Market Size, By Architecture, 2015�2022 (USD Million)
Table 86 Africa: Market Size, By Architecture, 2015�2022 (USD Million)
Table 87 Africa: Market Size, By Software Solution, 2015�2022 (USD Million)
Table 88 Africa: Market Size, By Stream, 2015�2022 (USD Million)
Table 89 Africa: Market Size, By Country, 2015�2022 (USD Million)
Table 90 Nigeria: Market Size, By Architecture, 2015�2022 (USD Million)
Table 91 Algeria: Market Size, By Architecture, 2015�2022 (USD Million)
Table 92 Egypt: Market Size, By Architecture, 2015�2022 (USD Million)
Table 93 Angola: Market Size, By Architecture, 2015�2022 (USD Thousand)
Table 94 Ongoing Pipeline Projects in Rest of Africa Oil & Gas Industry
Table 95 Rest of Africa: Market Size, By Architecture, 2015�2022 (USD Thousand)
List of Figures (45 Figures)
Figure 1 Global Market: Market Segmentation
Figure 2 Global Market: Research Design
Figure 3 Breakdown of Primary Interviews: By Company Type, Designation, & Region
Figure 4 Market Size Estimation Methodology: Bottom-Up Approach
Figure 5 Market Size Estimation Methodology: Top-Down Approach
Figure 6 Data Triangulation Methodology
Figure 7 North America Leads Global Market in 2016
Figure 8 Hardware Segment to Dominate Market, By Architecture, During Forecast Period (USD Billion)
Figure 9 Midstream Segment to Dominate Market During Forecast Period (USD Billion)
Figure 10 Market Dynamics: Market
Figure 11 Declining Oil Prices Impact Infrastructural Investments, 2014�2017
Figure 12 Sources of Malicious Code in SCADA Systems
Figure 13 Growing Pipeline Networks & Increased Focus on Process Optimization Through Automation & Digitalization to Drive Market Growth
Figure 14 North America to Record Highest Growth During Forecast Period
Figure 15 Midstream Segment and US Market Dominate North American Market in 2016
Figure 16 Hardware Segment to Hold Largest Share During Forecast Period (USD Billion)
Figure 17 Midstream Segment to Dominate Market During Forecast Period (USD Billion)
Figure 18 Hardware Segment to Dominate Market, By Architecture, During Forecast Period (USD Million)
Figure 19 Midstream Segment Dominates Market in 2016
Figure 20 Global Market Snapshot: North America to Record Highest Growth During Forecast Period
Figure 21 North America Dominates Global Market in 2016
Figure 22 North America: Market Snapshot
Figure 23 Software Segment to Record Highest Growth in US Market, By Architecture, During Forecast Period (USD Million)
Figure 24 Russia Holds Largest Share in European Market in 2016
Figure 25 Europe: Market Snapshot
Figure 26 Software Segment to Record Highest Growth in Russian Market, By Architecture, During Forecast Period (USD Million)
Figure 27 Software Segment to Record Highest Growth in German Market, By Architecture, During Forecast Period (USD Million)
Figure 28 Software Segment to Record Highest Growth in Australian Market, By Architecture, During Forecast Period (USD Million)
Figure 29 Japanese Crude Oil Imports, By Source, 2015
Figure 30 Software Segment to Record Highest Growth in Indonesian Market, By Architecture, During Forecast Period (USD Million)
Figure 31 Key Players Ranking in Market, By Revenue, 2016
Figure 32 New Product Launches A Key Strategy Among Players to Capture Market Share, 2013�2017
Figure 33 Market Evaluation Framework: New Product Launches, Contracts & Agreements, and Mergers & Acquisitions Drive Growth of Market Players During 2015�2017
Figure 34 ABB Ltd.: Company Snapshot
Figure 35 Schneider Electric: Company Snapshot
Figure 36 Rockwell Automation, Inc.: Company Snapshot
Figure 37 Mitsubishi Electric: Company Snapshot
Figure 38 Siemens AG: Company Snapshot
Figure 39 GE Electric Company: Company Snapshot
Figure 40 Yokogawa Electric Corporation: Company Snapshot
Figure 41 PSI AG: Company Snapshot
Figure 42 Larsen & Toubro Limited: Company Snapshot
Figure 43 Emerson Electric Co.: Company Snapshot
Figure 44 IBM: Company Snapshot
Figure 45 Honeywell International Inc.: Company Snapshot


Growth opportunities and latent adjacency in SCADA Oil & Gas Market