Passenger Security Market by Security Solution (Baggage Inspection Systems, Explosive Trace Detector, Hand Held Scanner, Full Body Scanner, Access Control), End User (Airport, Seaport, Railway), Investment Type, and Region - Global Forecast to 2024


The passenger security market is estimated to be USD 4.8 billion in 2019 and is projected to reach USD 6.8 billion by 2024, at a CAGR of 7.2% from 2019 to 2024. Increasing demand for cybersecurity solutions, upgraded technology, and an increase in passenger traffic is expected to drive the market.
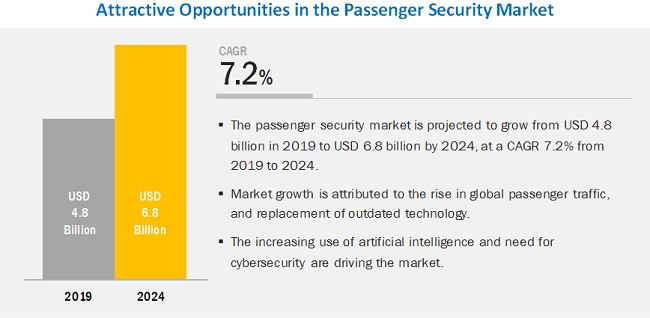
New demand segment projected to grow at the highest CAGR during the forecast period
The new demand segment is expected to grow at the highest CAGR during the forecast period. Growth of this segment is attributed to improvements in the technology for scanning passengers & baggage, expansion of existing airports, and seaports, and development of new airports, seaports and railway stations.
For instance, in 2018, around 50 airports in the US collectively spent an estimated USD 70 billion for the expansion of existing airports and construction and development of new airports. According to the Economic Times, India is expected to add 100 airports in the next 15 years to cope with the rise in air passenger movement. Abu Dhabi is currently constructing a mega midfield terminal at the cost of USD 2.7 billion to handle up to 84 million passengers per year.
Commercial airport segment projected to have the largest share in the passenger security market during the forecast period
Passenger security can be implemented on various platforms, including commercial airports. The commercial airport segment is projected to lead the passenger security market during the forecast period. The rise in global air passenger traffic is driving the growth of the aviation industry, which is leading to the expansion of existing airports and construction of new airports. The security systems required for these airports are driving the market.
For instance, according to an article published by CAPA in February 2019, global investments in airports in 2018 were USD 81.9 billion, of which, USD 23.1 billion were for the construction of new airports, and USD 58.9 billion were for the development of existing airports. An expenditure of USD 137.3 billion is estimated in 2019, of which, USD 62.4 billion is estimated for the construction of new airports and USD 74.9 billion for the development of existing airports.
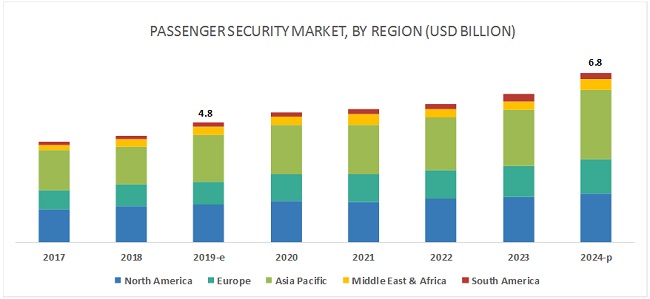
Asia Pacific expected to lead the passenger security market from 2019 to 2024
The increasing number of passengers majorly drives market growth in the Asia Pacific region. Changing demographics and increase in disposable income in the region is driving the demand for air travel, which has led to the increase in new airport developments and expansion of existing airports, resulting in the need for new passenger security systems in the region.
For instance, according to an article published by the International Air Transport Association (IATA) in October 2018, China is expected to add 1 billion new passengers to reach a total of 1.6 billion passengers from 2017 to 2037. India is expected to add 414 million new passengers to reach a total of 572 million passengers from 2017 to 2037, Indonesia is expected to add 282 million new passengers for a total of 411 million passengers from 2017 to 2037.
Key Market Players
Key players in the passenger security market include Smiths Detection Group Ltd. (UK), SITA (Belgium), Siemens (Germany), Honeywell International Inc. (US), Rapiscan Systems (US), Axis Communications AB (Sweden), Bosch Sicherheitssysteme GmbH (Germany), Autoclear, LLC. (US), L3 Security & Detection Systems (US), and FLIR Systems, Inc. (US), among others.
Axis Communications AB (Sweden) is a key supplier of network video solutions which are implemented with video analytics. The company offers open access control solutions which integrate with a wide variety of other systems. The company caters to multiple industries such as transportation, critical infrastructure, law enforcement, prisons and correctional facilities, and government facilities, among others.
Bosch Sicherheitssysteme GmbH (Germany) provides end-to-end cybersecurity solutions for video security cameras connected to the internet. The company is offering this service in partnership with Genetec Inc. (Canada).
Honeywell International Inc. (US) offers a suite of solutions which are tailormade for its clients. It offers biometric security, access control systems, and video analytics based identification of threats, among others. The company provides end-to-end solutions for airport security as well as airport operations management.
Get online access to the report on the World's First Market Intelligence Cloud
- Easy to Download Historical Data & Forecast Numbers
- Company Analysis Dashboard for high growth potential opportunities
- Research Analyst Access for customization & queries
- Competitor Analysis with Interactive dashboard
- Latest News, Updates & Trend analysis
Request Sample Scope of the Report
Get online access to the report on the World's First Market Intelligence Cloud
- Easy to Download Historical Data & Forecast Numbers
- Company Analysis Dashboard for high growth potential opportunities
- Research Analyst Access for customization & queries
- Competitor Analysis with Interactive dashboard
- Latest News, Updates & Trend analysis

|
Report Metric |
Details |
|
Market Size Available for Years |
2017�2024 |
|
Base Year Considered |
2018 |
|
Forecast Period |
2019�2024 |
|
Forecast Units |
Value (USD) |
|
Segments Covered |
End User, Security Solution, Investment Type, and Region |
|
Geographies Covered |
North America, Asia Pacific, Europe, Middle East & Africa, and South America |
|
Companies Covered |
Smiths Detection Group Ltd. (UK), SITA (Belgium), Siemens (Germany), Honeywell International Inc. (US), Rapiscan Systems (US), Axis Communications AB (Sweden), Bosch Sicherheitssysteme GmbH (Germany), Autoclear, LLC. (US), L3 Security & Detection Systems (US), and FLIR Systems, Inc. (US) |
This research report categorizes the passenger security market based on security solution, end user, investment type, and region.
Based on security solution, the passenger security market has been segmented as follows:
- Baggage Inspection Systems
- Explosives Trace Detectors
- Hand-held Scanners
- Walk-through Metal Detectors
- Full-body Scanners
- Perimeter Intrusion Detection Systems
- Video Management Systems
- Access Control/Biometric Systems
- Bar-coded Boarding Systems
- Cybersecurity Solutions
Based on end-user, the passenger security market has been segmented as follows:
- Commercial Airports
- Seaports
- Railway Stations
Based on the investment type, the passenger security market has been segmented as follows:
- New Demand
- Replacement Demand
On the basis of region, the passenger security market has been segmented as follows:
- North America
- Europe
- Asia Pacific
- Middle East & Africa
- South America
Recent Developments
- In April 2019, Axis Communications launched a new multidirectional, four-channel camera with Quad HD resolution per channel capable of recording at 30 frames per second. The camera is useful for perimeter security.
- In April 2019, Rapiscan Systems launched its new product, the MP100 Portable Radiation Detection System, which is a lightweight, high-performance system used to detect the presence of radiological and nuclear materials.
- In April 2019, Sensurity Ltd. partnered with Genetic Security Management Platform to integrate their systems.
Key Questions Addressed by the Report
- What is the growth perspective of the passenger security market, and what are the key dynamics and trends governing the market, such as drivers and opportunities?
- What are the key sustainability strategies adopted by the leading players in the passenger security market?
- What are the new and emerging technologies and use cases disrupting the passenger security industry?
- Which key applications play significant roles in passenger security?
- What are the key trends and opportunities in the passenger security market across different regions and their respective countries?
- Who are the key players and innovators in the partnership ecosystem?
- How will changes in the competitive landscape of the client ecosystem impact clients� revenue?
To speak to our analyst for a discussion on the above findings, click Speak to Analyst
Table of Contents
1 Introduction
1.1 Objectives of the Study
1.2 Market Definition
1.2.1 Regional Scope
1.2.2 Years Considered for the Study
1.3 Currency & Pricing
1.4 Market Stakeholders
2 Research Methodology
2.1 Research Data
2.2 Secondary Data
2.3 Market Definition & Scope
2.4 Market Segmentation
2.5 Exclusions & Limitation
2.5.1 Exclusion
2.5.2 Limitation
2.5.3 Primary Data
2.6 Breakdown of Primaries
2.7 Research Approach & Methodology
2.8 Market Breakdown & Data Triangulation
2.9 Market Sizing & Forecasting
3 Executive Summary
4 Premium Insights
4.1 Attractive Growth Opportunities in Passenger Security Market
4.2 Passenger Security Market for Baggage Inspection Systems, By Type
4.3 Airport Passenger Security Market, By Hub
4.4 Passenger Security Market, By Region
5 Market Overview
5.1 Respondent Profiling
5.2 Respondent Profiling � Demand Side
5.3 Market Overview: Snapshot
6 Industry Trends
6.1 Introduction
6.2 Technology Trends
6.3 Innovations & Patent Registrations
7 By Security Solution
7.1 Baggage Inspection Systems
7.1.1 Computed Tomography
7.1.2 X-Ray Scanners
7.2 Explosive Trace Detectors
7.3 Hand-Held Scanners
7.4 Walk-Through Metal Detectors
7.5 Full-Body Scanners
7.6 Perimeter Intrusion Detection Systems
7.7 Video Management Systems
7.8 Access Control/Biometric Systems
7.9 Bar-Coded Boarding Systems
7.10 Cybersecurity Solutions
8 By End User
8.1 Commercial Airports
8.1.1 Large Hub (Above 9.5 Million)
8.1.2 Medium Hub (2.5-9.5 Million)
8.1.3 Small Hub (Less Than 2.5 Million))
8.2 Seaport
8.3 Railway Stations
9 By Investment Type
9.1 Introduction
9.2 New Demand
9.3 Replacement
10 Regional Analysis
10.1 Introduction
10.2 North America
10.2.1 US
10.2.1 Canada
10.3 Europe
10.3.1 Russia
10.3.2 Germany
10.3 Europe
10.3.1 Russia
10.3.2 Germany
10.3.3 UK
10.3.4 Italy
10.3.5 France
10.3.6 Spain
10.4 Asia Pacific
10.4.1 China
10.4.2 Japan
10.4.3 India
10.4.4 South Korea
10.4.5 Philippines
10.4.6 Australia
10.5 Middle East & Africa
10.5.1 UAE
10.5.2 Saudi Arabia
10.5.3 Turkey
10.5.4 South Africa
10.6 South America
10.6.5 Brazil
10.6.6 Mexico
11 Competitive Landscape
11.1 Introduction
11.2 Major Players, 2018
11.3 Competitive Scenario
11.4 Competitive Leadership Mapping
11.5 Competitive Scenario
12 Company Profiles
12.1 Adani Systems Inc.
12.2 Advanced Perimeter Systems Ltd.
12.3 Autoclear, LLC.
12.4 Axis Communications AB.
12.5 Bosch Sicherheitssysteme GmbH
12.6 C.E.I.A. SPA
12.7 Flir Systems, Inc.
12.8 Honeywell International Inc.
12.9 L3 Security & Detection Systems
12.10 Navtech Radar
12.11 Rapiscan Systems
12.12 Sensurity Ltd.
12.13 Siemens
12.14 SITA
12.15 Smiths Detection Group Ltd.
13 Appendix
List of Tables (136 Tables)
Table 1 Baggage Inspection Systems Market Size, By Region, 2017�2024 (USD Million)
Table 2 Explosives Trace Detectors Market Size, By Region, 2017�2024 (USD Million)
Table 3 Hand-Held Scanners Market Size, By Region, 2017�2024 (USD Million)
Table 4 Walk-Through Metal Detectors Market Size, By Region, 2017�2024 (USD Million)
Table 5 Full-Body Scanners Market Size, By Region, 2017�2024 (USD Million)
Table 6 Perimeter Intrusion Detection Systems Market Size, By Region, 2017�2024 (USD Million)
Table 7 Video Management Systems Market Size, By Region, 2017�2024 (USD Million)
Table 8 Access Control/Biometric Systems Market Size, By Region, 2017�2024 (USD Million)
Table 9 Bar-Coded Boarding Systems Market Size, By Region, 2017�2024 (USD Million)
Table 10 Cybersecurity Solutions Market Size, By Region, 2017�2024 (USD Million)
Table 11 Baggage Inspection Systems Market Size, By Type, 2017�2024 (USD Million)
Table 12 Passenger Security Size, By End User 2017�2024 (USD Million)
Table 13 Commercial Airports Market Size, By Airport Hub 2017�2024 (USD Million)
Table 14 Commercial Airports Market Size, By Region 2017�2024 (USD Million)
Table 15 Seaport Market Size, By Region 2017�2024 (USD Million)
Table 16 Railway Stations Market Size, By Region 2017�2024 (USD Million)
Table 17 Passenger Security Size, By Investment Type, 2017�2024 (USD Million))
Table 18 Replacement Market Size, By Region, 2017�2024 (USD Million)
Table 19 New Demand Market Size, By Region, 2017�2024 (USD Million)
Table 20 Passenger Security Size, By Region, 2017�2024 (USD Million)
Table 21 North America Passenger Security Size, By Country, 2017�2024 (USD Million)
Table 22 North America Passenger Security Size, By End User, 2017�2024 (USD Million)
Table 23 North America Passenger Security Size, By Investment Type, 2017�2024 (USD Million)
Table 24 North America: Commercial Airport Passenger Security Size, By Airport Hub, 2017�2024 (USD Million)
Table 25 North America Passenger Security Size, By Security Solution, 2017�2024 (USD Million)
Table 26 US Passenger Security Size, By Investment Type, 2017�2024 (USD Million)
Table 27 US Passenger Security Size, By End User,2017�2024 (USD Million)
Table 28 US Commercial Airport Passenger Security Size, By Airport Hub, 2017�2024 (USD Million)
Table 29 Canada Passenger Security Size, By Investment Type, 2017�2024 (USD Million)
Table 30 Canada Passenger Security Size, End User, 2017�2024 (USD Million)
Table 31 Canada Commercial Airport Passenger Security Size, By Airport Hub, 2017�2024 (USD Million)
Table 32 Europe Passenger Security Size, By Country, 2017�2024 (USD Million)
Table 33 Europe Passenger Security Size, By End User, 2017�2024 (USD Million)
Table 34 Europe Commercial Airport Passenger Security Size, By, Airport Hub2017�2024 (USD Million)
Table 35 Europe Passenger Security Size, By Investment Type, 2017�2024 (USD Million)
Table 36 Europe Passenger Security Size, By Security Solution, 2017�2024 (USD Million)
Table 37 Russia Passenger Security Size, By Investment Type, 2017�2024 (USD Million)
Table 38 Russia Passenger Security Size, By End User, 2017�2024 (USD Million)
Table 39 Russia Commercial Airport Passenger Security Size, By, Airport Hub 2017�2024 (USD Million)
Table 40 Germany Passenger Security Market Size, By Investment Type, 2017�2024 (USD Million)
Table 41 Germany Passenger Security Size, By End User, 2017�2024 (USD Million)
Table 42 Germany Commercial Airport Passenger Security Size, By, Airport Hub 2017�2024 (USD Million)
Table 43 UK Passenger Security Size, By Investment Type, 2017�2024 (USD Million)
Table 44 UK Passenger Security Size, By End User, 2017�2024 (USD Million)
Table 45 UK Commercial Airport Passenger Security Size, By, Airport Hub 2017�2024 (USD Million)
Table 46 Italy Passenger Security Size, By Investment Type, 2017�2024 (USD Million)
Table 47 Italy Passenger Security Size, By End User, 2017�2024 (USD Million)
Table 48 Italy Commercial Airport Passenger Security Size, By, Airport Hub 2017�2024 (USD Million)
Table 49 France Passenger Security Size, By Investment Type, 2017�2024 (USD Million)
Table 50 France Passenger Security Size, By End User, 2017�2024 (USD Million)
Table 51 France Commercial Airport Passenger Security Size, By, Airport Hub 2017�2024 (USD Million)
Table 52 Spain Passenger Security Size, By Investment Type, 2017�2024 (USD Million)
Table 53 Spain Passenger Security Size, By End User, 2017�2024 (USD Million)
Table 54 Spain Commercial Airport Passenger Security Size, By, Airport Hub 2017�2024 (USD Million)
Table 55 Asia Pacific Passenger Security Size, By Country, 2017�2024 (USD Million)
Table 56 Asia Pacific Passenger Security Size, By End User, 2017�2024 (USD Million)
Table 57 Asia Pacific Commercial Airport Passenger Security Size, By, Airport Hub2017�2024 (USD Million)
Table 58 Asia Pacific Passenger Security Size, By Investment Type, 2017�2024 (USD Million)
Table 59 Asia Pacific Passenger Security Size, By Security Solution, 2017�2024 (USD Million)
Table 60 China Passenger Security Size, By Investment Type, 2017�2024 (USD Million)
Table 61 China Passenger Security Size, By End User, 2017�2024 (USD Million)
Table 62 China Commercial Airport Passenger Security Market Size, By, Airport Hub 2017�2024 (USD Million)
Table 63 Japan Passenger Security Size, By Investment Type, 2017�2024 (USD Million)
Table 64 Japan Passenger Security Size, By End User, 2017�2024 (USD Million)
Table 65 Japan Commercial Airport Passenger Security Size, By, Airport Hub 2017�2024 (USD Million)
Table 66 India Passenger Security Size, By Investment Type, 2017�2024 (USD Million)
Table 67 India Passenger Security Size, By End User, 2017�2024 (USD Million)
Table 68 India Commercial Airport Passenger Security Market Size, By, Airport Hub 2017�2024 (USD Million)
Table 69 South Korea Passenger Security Size, By Investment Type, 2017�2024 (USD Million)
Table 70 South Korea Passenger Security Size, By End User, 2017�2024 (USD Million)
Table 71 South Korea Commercial Airport Passenger Security Size, By, Airport Hub 2017�2024 (USD Million)
Table 72 South Korea Commercial Airport Passenger Security Size, By, Airport Hub 2017�2024 (USD Million)
Table 73 Philippines Passenger Security Size, By End User, 2017�2024 (USD Million)
Table 74 Philippines Commercial Airport Passenger Security Size, By, Airport Hub 2017�2024 (USD Million)
Table 75 Australia Passenger Security Size, By Investment Type, 2017�2024 (USD Million)
Table 76 Australia Passenger Security Size, By End User, 2017�2024 (USD Million)
Table 77 Australia Commercial Airport Passenger Security Size, By, Airport Hub 2017�2024 (USD Million)
Table 78 Middle East & Africa Passenger Security Size, By Country, 2017�2024 (USD Million)
Table 79 Middle East & Africa Passenger Security Size, By End User, 2017�2024 (USD Million)
Table 80 Middle East & Africa Commercial Airport Passenger Security Size, By, Airport Hub2017�2024 (USD Million)
Table 81 Middle East & Africa Passenger Security Size, By Investment Type, 2017�2024 (USD Million)
Table 82 Middle East & Africa Passenger Security Size, By Security Solution, 2017�2024 (USD Million)
Table 83 UAE Passenger Security Size, By Investment Type, 2017�2024 (USD Million)
Table 84 UAE Passenger Security Size, By End User, 2017�2024 (USD Million)
Table 85 UAE Commercial Airport Passenger Security Size, By, Airport Hub 2017�2024 (USD Million)
Table 86 Saudi Arabiapassenger Security Size, By Investment Type, 2017�2024 (USD Million)
Table 87 Saudi Arabia Passenger Security Size, By End User, 2017�2024 (USD Million)
Table 88 Saudi Arabia Commercial Airport Passenger Security Size, By, Airport Hub 2017�2024 (USD Million)
Table 89 Turkey Passenger Security Size, By Investment Type, 2017�2024 (USD Million)
Table 90 Turkey Passenger Security Size, By End User, 2017�2024 (USD Million)
Table 91 Turkey Commercial Airport Passenger Security Size, By, Airport Hub 2017�2024 (USD Million)
Table 92 South Africa Passenger Security Size, By Investment Type, 2017�2024 (USD Million)
Table 93 South Africa Passenger Security Size, By End User, 2017�2024 (USD Million)
Table 94 South Africa Commercial Airport Passenger Security Market Size, By, Airport Hub 2017�2024 (USD Million)
Table 95 South America Passenger Security Size, By Country, 2017�2024 (USD Million)
Table 96 South America Passenger Security Size, By End User, 2017�2024 (USD Million)
Table 97 South America Commercial Airport Passenger Security Size, By, Airport Hub2017�2024 (USD Million)
Table 98 South America Passenger Security Size, By Investment Type, 2017�2024 (USD Million)
Table 99 South America Passenger Security Size, By Security Solution, 2017�2024 (USD Million)
Table 100 Brazil Passenger Security Market Size, By Investment Type, 2017�2024 (USD Million)
Table 101 Brazil Passenger Security Size, By End User, 2017�2024 (USD Million)
Table 102 Brazil Commercial Airport Passenger Security Market Size, By, Airport Hub 2017�2024 (USD Million)
Table 103 Mexico Passenger Security Size, By Investment Type, 2017�2024 (USD Million)
Table 104 Mexico Passenger Security Size, By End User, 2017�2024 (USD Million)
Table 105 Mexico Commercial Airport Passenger Security Market Size, By, Airport Hub 2017�2024 (USD Million)
Table 106 Contracts, April 2013�February 2019
Table 107 New Product Launches, April 2013�February 2019
Table 108 Partnerships, Mergers, and Acquisitions, April 2013�February 2019
Table 109 Products/Services/Solutions Offered
Table 110 Recent Developments
Table 111 Products/Services/Solutions Offered
Table 112 Products/Services/Solutions Offered
Table 113 Recent Developments
Table 114 Products/Services/Solutions Offered
Table 115 Products/Services/Solutions Offered
Table 116 Recent Developments
Table 117 Products/Services/Solutions Offered
Table 118 Products/Services/Solutions Offered
Table 119 Recent Developments
Table 120 Products/Services/Solutions Offered
Table 121 Products/Services/Solutions Offered
Table 122 Products/Services/Solutions Offered
Table 123 Recent Developments
Table 124 Products/Services/Solutions Offered
Table 125 Recent Developments
Table 126 Products/Services/Solutions Offered
Table 127 Recent Developments
Table 128 Products/Services/Solutions Offered
Table 129 Recent Developments
Table 130 Products/Services/Solutions Offered
Table 131 Recent Developments
Table 132 Products/Services/Solutions Offered
Table 133 Products/Services/Solutions Offered
Table 134 Recent Developments
Table 135 Products/Services/Solutions Offered
Table 136 Recent Developments
List of Figures (44 Figures)
Figure 1 Markets Covered
Figure 2 Limitations
Figure 3 The Following Figure Depicts the Research Methodology Applied in Developing This Report on the Passenger Security Market
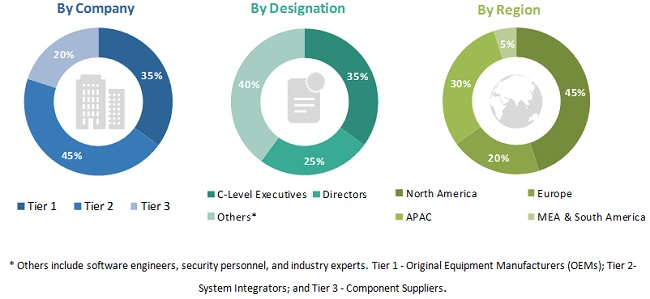
Figure 4 Breakdown of Primary Interviews: By Company Type, Designation, & Region
Figure 5 Market Size Estimation Methodology: Top-Down Approach
Figure 6 Market Size Estimation Methodology: Bottom-Up Approach
Figure 7 Assumptions of the Research Study
Figure 8 Cybersecurity Solutions Segment Projected to Lead the Passenger Security From 2019 to 2024
Figure 9 Commercial Airports Segment Projected to Lead the Passenger Security From 2019 to 2024
Figure 10 The New Demand Segment Projected to Lead the Passenger Security From 2019 to 2024
Figure 11 Asia Pacific Segment Projected to Lead the Passenger Security From 2019 to 2024
Figure 12 Increase in Passenger Traffic and Development of Airport, Seaport, and Railway Infrastructures are Major Factors Driving the Passenger Security Market
Figure 13 Computed Tomography Scanners Expected Segment to Lead the Airport Passenger Security From 2019 to 2024
Figure 14 Large Hub Segment Expected to Lead the Airport Passenger Security From 2019 to 2024
Figure 15 Asia Pacific Expected to Lead the Passenger Security From 2019 to 2024
Figure 16 Respondent Profiling, By Type
Figure 17 Respondent Profiling, By Country
Figure 18 Supply Side Respondents, By Designation
Figure 19 Respondent Profiling, By Type of Designation
Figure 20 Respondent Profiling, By Type of Ownership
Figure 21 Respondent Profiling, By Type of Organization
Figure 22 Respondent Profiling, By Country
Figure 23 Percentage of It Budget Spent on Cybersecurity, 2017 vs 2018
Figure 24 Passenger Security, By Security Solution, 2017�2024 (USD Million)
Figure 25 Passenger Security, By End User, 2019 & 2024 (USD Million)
Figure 26 Passenger Security, By End User, 2019 & 2024 (USD Million)
Figure 27 New Demand Segment Projected to Lead the Passenger Security Market From 2019 to 2024
Figure 28 Passenger Security Market Snapshot
Figure 29 North America Passenger Security Market Snapshot
Figure 30 Europe Passenger Security Market Snapshot
Figure 31 Asia Pacific Passenger Security Market Snapshot
Figure 32 Middle East & Africa Passenger Security Market Snapshot
Figure 33 South America Passenger Security Market Snapshot
Figure 34 Major Players in the Market, 2018
Figure 35 Companies Adopted New Product Launches as the Key Growth Strategy From April 2013 to February 2019
Figure 36 Axis Communications: Company Snapshot
Figure 37 SWOT Analysis: Axis Communications AB
Figure 38 SWOT Analysis: Bosch Sicherheitssysteme GmbH
Figure 39 Flir Systems Inc.: Company Snapshot
Figure 40 Honeywell International Inc.: Company Snapshot
Figure 41 SWOT Analysis: Honeywell International Inc.
Figure 42 Siemens: Company Snapshot
Figure 43 SWOT Analysis: SITA
Figure 44 SWOT Analysis: Smiths Detection Systems Ltd.
The study involved four major activities to estimate the current size of the passenger security market. Exhaustive secondary research was undertaken to collect information on the market, the peer markets, and the parent market. The next step was to validate these findings, assumptions, and sizing with industry experts across the value chain through primary research. Both, top-down and bottom-up approaches were employed to estimate the complete market size. Thereafter, market breakdown and data triangulation procedures were used to estimate the market size of segments and subsegments.
Secondary Research
In the secondary research process, various secondary sources, such as D&B Hoovers, Bloomberg, BusinessWeek, and various periodicals were referred to identify and collect information for this study. Secondary sources also included annual reports, press releases & investor presentations of companies, certified publications, articles by recognized authors, and passenger security databases.
Primary Research
The passenger security market comprises several stakeholders, such as raw material suppliers, processors, end-product manufacturers, and regulatory organizations in the supply chain. The demand-side of this market is characterized by various end users, such as component manufacturers as well as facility providers and OEMs. The supply-side is characterized by technology advancements in security solutions and the development of Cybersecurity solutions. Various primary sources from both the supply and demand sides of the market were interviewed to obtain qualitative and quantitative information. Following is the breakdown of primary respondents:
To know about the assumptions considered for the study, download the pdf brochure
Market Size Estimation
Both top-down and bottom-up approaches were used to estimate and validate the total size of the passenger security market. These methods were also used extensively to estimate the size of various subsegments of the market. The research methodology used to estimate the market size includes the following:
- Key players in the industry and markets were identified through extensive secondary research.
- The industry�s supply chain and market size, in terms of value, were determined through primary and secondary research processes.
- All percentage shares, splits, and breakdowns were determined using secondary sources and verified through primary sources.
Data Triangulation
After arriving at the overall market size�using the market size estimation process explained above�the market was split into several segments and subsegments. To complete the overall market engineering process and arrive at the exact statistics of each market segment and subsegment, data triangulation, and market breakdown procedures were employed, wherever applicable. The data was triangulated by studying various factors and trends from both the demand and supply sides of the passenger security industry.
Report Objectives
- To identify and analyze key drivers, restraints, opportunities, and challenges influencing the growth of the passenger security market
- To analyze the impact of macro and micro indicators on the market
- To forecast the market size of segments for five regions, namely, North America, Europe, Asia Pacific, Middle East & Africa, and South America, along with major countries in each of these regions
- To strategically analyze micromarkets with respect to individual technological trends, prospects, and their contribution to the overall market
- To strategically profile key market players and comprehensively analyze their market ranking and core competencies
- To provide a detailed competitive landscape of the market, along with an analysis of business and corporate strategies, such as contracts, agreements, partnerships, acquisitions, and new product developments
- To identify detailed financial positions, key products, unique selling points, and key developments of leading companies in the market
Available Customizations
Along with the market data, MarketsandMarkets offers customizations according to a company�s specific needs
Product Analysis
- Product matrix, which gives a detailed comparison of the product portfolio of each company
Company Information
- Detailed analysis and profiles of additional market players (up to 5)


Growth opportunities and latent adjacency in Passenger Security Market
Hello, I'm thinking of buying this report. But before buying, I have some questions. 1. Is this market size the world market size? 2. I want to know about executive summary(p3) and railway station. Can I buy only the pages which are related to railway station? 3. How can I buy this report?