Passive Fire Protection Coatings Market by Type (Intumescent, Cementitious), Technology (Water-Based, Solvent-Based), End-Use Industry (Building & Construction, Oil & Gas, Transportation), and Region - Global Forecast to 2022


[148 Pages Report] Passive Fire Protection Coatings Market size is projected to reach from an estimated USD 2.74 Billion in 2016 to USD 4.02 Billion by 2022, at a CAGR of 6.6% from 2017 to 2022. In this study, 2016 has been considered the base year, and 2017�2022 the forecast period to estimate the market size of passive fire protection coatings.
Objectives of the study:
- To analyze and forecast the passive fire protection coatings market, in terms of both, volume and value
- To define, describe, and segment the passive fire protection coatings market by type, technology, and end-use industry
- To forecast the size of each market segment for various regions, such as Asia-Pacific, North America, Europe, Middle East & Africa, and South America
- To provide detailed information regarding the key factors, such as drivers, restraints, opportunities, and industry-specific challenges influencing the growth of the market
- To strategically analyze the segmented markets with respect to individual growth trends, prospects, and contribution to the overall market
- To identify and analyze opportunities for stakeholders in the passive fire protection coatings market
- To analyze competitive developments, such as expansions, mergers & acquisitions, contracts, agreements, and new product developments in the passive fire protection coatings market
- To strategically profile key players and comprehensively analyze their core competencies
Research Methodology:
This study aims to estimate the market size for passive fire protection coatings in 2017 and provide market forecast till 2022. It offers a detailed qualitative and quantitative analysis of the market. Various secondary sources, including the Paints & Coatings Industry (PCI), National Fire Protection Association (NFPA), International Association of Oil & Gas Producers (IOGP), American Coatings Association (ACA), and United States Environmental Protection Agency (EPA) have been used to identify and collect information useful for an extensive and commercial study of the passive fire protection coatings market. Primary sources, such as experts from related industries and suppliers have been interviewed to obtain and verify critical information, as well as to assess growth prospects of the passive fire protection coatings market.
To know about the assumptions considered for the study, download the pdf brochure
Market Ecosystem
Key manufacturers of passive fire protection coatings are Akzo Nobel (The Netherlands), PPG Industries (US), The Sherwin-Williams Company (US), Promat International (Belgium), Carboline (US), Hempel A/S (Denmark), KANSAI PAINT (Japan), Nullifire (UK), Jotun (Norway), and Teknos Group (Finland). These manufacturers focus on improving their product portfolios and increasing their regional presence by adopting strategies such as new product developments, mergers & acquisitions, expansions, and partnerships.
Key Target Audience
- Manufacturers of Passive Fire Protection Coatings
- Traders, Distributors, and Suppliers of Passive Fire Protection Coatings
- Regional Manufacturers' Associations for Passive Fire Protection Coatings
- Government and Regional Agencies and Research Organizations
Get online access to the report on the World's First Market Intelligence Cloud
Request Sample Scope of the Report
:

The passive fire protection coatings market has been classified into the following segments:
Based on Type:
- Intumescent
- Cementitious
Based on Technology:
- Water-based
- Solvent-based
Based on End-use Industry:
- Building & Construction
- Oil & Gas
- Transportation
- Others
Based on Region:
- Asia-Pacific
- North America
- Europe
- Middle East & Africa
- South America
Available Customizations:
With the given market data, MarketsandMarkets offers customizations according to the company�s specific needs. The following customization options are available for the report:
- Product Analysis
Product matrix that offers a detailed comparison of the product portfolio of each company
- Regional Analysis
Further breakdown of a region with respect to a particular country
- Company Information
Detailed analysis and profiles of additional market players (up to five)
The passive fire protection coatings market is projected to reach USD 4.02 Billion by 2022, at a CAGR of 6.6% between 2017 and 2022. The growth of the passive fire protection coatings market is primarily driven by the increasing demand from end-use industries such as building & construction, oil & gas, and transportation. The building & construction industry is one of the major consumers of passive fire protection coatings. Such coatings are added so that the steel structure in a building withstands fire and prevents it from reaching the critical temperature at which the structure may collapse. These are used in high rise buildings, sports stadium, and other applications. The growing use of passive fire protection coatings in equipment protection and various offshore and onshore applications in the oil & gas industry is driving demand.
The passive fire protection coatings market is segmented on the basis of end-use industry, such as building & construction, oil & gas, transportation and others (marine and tunneling). The building & construction segment is expected to be the largest and is also projected to be the fastest-growing segment during the forecast period. The market for passive fire protection coatings in the building & construction industry is growing rapidly due to the implementation of stringent regulations and increasing awareness regarding safety and security of people and assets. Also, demand for new transport and utility infrastructure, institutions, healthcare facilities and expansion of businesses and manufacturing facilities are the key growth factors in the demand for passive fire protection coatings in the building & construction segment.
The passive fire protection coatings market is segmented on the basis of type into intumescent and cementitious coatings. Intumescent coatings is the largest type segment of the passive fire protection coatings market, in terms of value. Intumescent coatings require lower maintenance, improve durability, provide longer shelf-life, and also help the corrosion protection of steel structures in buildings. Hence, these properties of intumescent coatings are expected to foster the growth of these type of coatings in the passive fire protection coatings market.
The passive fire protection coatings market is segmented on the basis of technology into solvent-based and water-based coatings. The water-based technology is the largest technology segment of the passive fire protection coatings market, in terms of both, value and volume. Demand for water-based passive fire protection coatings has increased mainly due to their eco-friendly nature. These are solvent-free, VOC-free coatings that are widely used and are seen as potential replacement for coatings with VOC content. These are broadly used in infrastructure & construction, oil & gas, and marine applications.
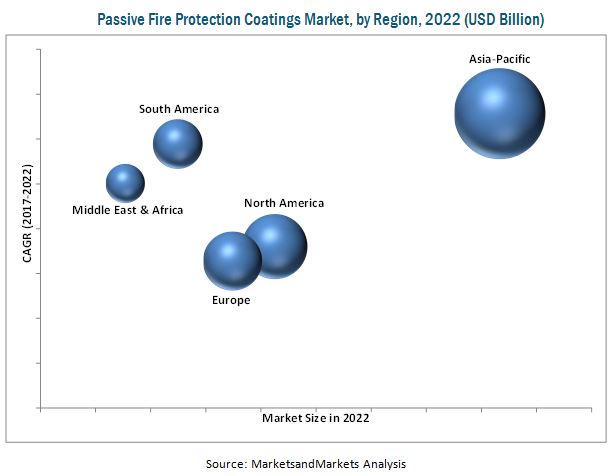
Asia-Pacific, Europe, and North America are the key passive fire protection coatings markets. The market in the Asia-Pacific region is projected to grow at the highest CAGR between 2017 and 2022, in terms of both, value and volume. The growing middle-class population and the rising standards of living are expected to lead to an increase in the demand for fire protection coatings due to the rise in the use of passive fire protection coatings in various industries, such as building & construction and transportation. Market participants are considering shifting their production bases from North America and Europe to sites in the Asia-Pacific as there are less stringent norms and standards for safety and environmental compliance in China. Moreover, there is easy availability of cheap labor. In the Asia-Pacific, India is expected to be one of the high growing passive fire protection coatings markets during the forecast period. The growth is attributed to the growing construction sector and urbanization. Initiatives, such as Make in India, introduced by the Indian government are driving the growth of the construction and infrastructure sectors of the country.
Stringent regulations and norms are driving the market for passive fire protection coatings as newly constructed buildings need to meet the required safety and fire resistance standards. However, lack of awareness amongst potential end users is posing a challenge to the passive fire protection coatings market players. Akzo Nobel (The Netherlands), PPG Industries (US), The Sherwin-Williams Company (US), Promat International (Belgium), Carboline (US), Hempel A/S (Denmark), KANSAI PAINT (Japan), Nullifire (UK), Jotun (Norway), and Teknos Group (Finland) are the leading companies in the passive fire protection coatings market.
To speak to our analyst for a discussion on the above findings, click Speak to Analyst
Table of Contents
1 Introduction (Page No. - 16)
1.1 Objectives of the Study
1.2 Market Definition
1.3 Market Scope
1.3.1 Years Considered for the Study
1.4 Currency
1.5 Package Size
1.6 Limitations
1.7 Stakeholders
2 Research Methodology (Page No. - 20)
2.1 Research Data
2.1.1 Secondary Data
2.1.1.1 Key Data From Secondary Sources
2.1.2 Primary Data
2.1.2.1 Key Data From Primary Sources
2.1.2.2 Key Industry Insights
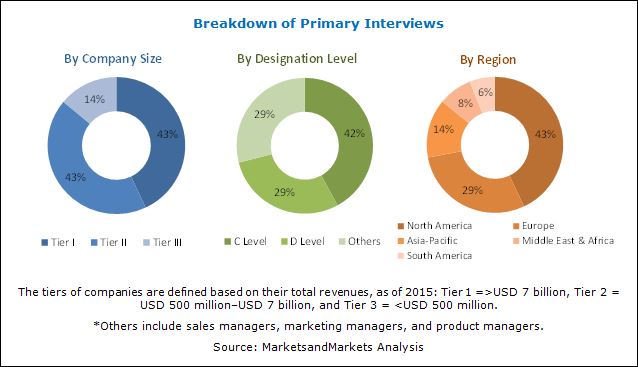
2.1.2.3 Breakdown of Primary Interviews
2.2 Market Size Estimation
2.2.1 Bottom-Up Approach
2.2.2 Top-Down Approach
2.3 Data Triangulation
2.4 Research Assumptions
3 Executive Summary (Page No. - 28)
4 Premium Insights (Page No. - 31)
4.1 Attractive Opportunities in the Passive Fire Protection Coatings Market
4.2 Passive Fire Protection Coatings Market Growth, By Region
4.3 Passive Fire Protection Coatings Market, By Asia-Pacific Region and By End-Use Industry
4.4 Passive Fire Protection Coatings Market, By End-Use Industry
4.5 Passive Fire Protection Coatings Market Growth, By Country
5 Market Overview (Page No. - 36)
5.1 Introduction
5.2 Market Dynamics
5.2.1 Drivers
5.2.1.1 Increase in the Use of Steel in Building and Construction Projects
5.2.1.2 Rising Demand in Asia-Pacific Region
5.2.1.3 Stringent Government Regulations and Fire Safety Standards
5.2.1.4 Rising Number of Fire Accidents
5.2.2 Restraints
5.2.2.1 Use of Cheaper Alternatives
5.2.3 Opportunities
5.2.3.1 Growing Demand for Fire Protection Coatings in Renovation Projects
5.2.3.2 Rising Demand for Water-Based Fire Protection Coatings
5.2.4 Challenges
5.2.4.1 Lack of Awareness in Emerging Markets
5.3 Porter�s Five Forces Analysis
5.3.1 Threat of New Entrants
5.3.2 Threat of Substitutes
5.3.3 Bargaining Power of Suppliers
5.3.4 Bargaining Power of Buyers
5.3.5 Intensity of Competitive Rivalry
5.4 Macroeconomic Indicators
5.4.1 Introduction
5.4.2 Trends and Forecast of GDP
5.4.3 Global Construction Industry and Economic Outlook
6 Passive Fire Protection Coatings Market, By Type (Page No. - 45)
6.1 Introduction
6.2 Intumescent Coatings
6.3 Cementitious Coatings
7 Passive Fire Protection Coatings Market, By Technology (Page No. - 50)
7.1 Introduction
7.2 Water-Based
7.3 Solvent-Based
8 Passive Fire Protection Coatings Market, By End-Use Industry (Page No. - 56)
8.1 Introduction
8.2 Building & Construction
8.3 Oil & Gas
8.4 Transportation
8.5 Others
9 Passive Fire Protection Coatings Market, By Region (Page No. - 64)
9.1 Introduction
9.2 North America
9.2.1 U.S.
9.2.2 Canada
9.2.3 Mexico
9.3 Europe
9.3.1 U.K.
9.3.2 France
9.3.3 Germany
9.3.4 Italy
9.3.5 Russia
9.3.6 Rest of Europe
9.4 Asia-Pacific
9.4.1 China
9.4.2 Japan
9.4.3 India
9.4.4 Malaysia
9.4.5 Thailand
9.4.6 Singapore
9.4.7 Rest of Asia-Pacific
9.5 South America
9.5.1 Brazil
9.5.2 Argentina
9.5.3 Rest of South America
9.6 Middle East & Africa
9.6.1 Saudi Arabia
9.6.2 UAE
9.6.3 South Africa
9.6.4 Rest of the Middle East & Africa
10 Competitive Landscape (Page No. - 109)
10.1 Market Ranking Analysis
10.1.1 Market Ranking of Key Players, 2016
11 Company Profiles (Page No. - 111)
(Business Overview, Products Offered, Scorecard of Product Offering, Scorecard of Business Strategy, and New Product Launch)
11.1 Akzo Nobel N.V.
11.2 PPG Industries, Inc.
11.3 The Sherwin-Williams Company
11.4 Jotun
11.5 Hempel A/S
11.6 Promat International
11.7 Kansai Paint Co., Ltd
11.8 Teknos Group
11.9 Carboline
11.10 Nullifire
11.11 Other Companies
11.11.1 Sika AG
11.11.2 BASF SE
11.11.3 3M
11.11.4 Contego International Inc.
11.11.5 Isolatek International
11.11.6 GCP Applied Technologies Inc.
11.11.7 Intumescent Systems Ltd. (Envirograf)
11.11.8 Albi Manufacturing
11.11.9 Arabian Vermiculite Industries.
11.11.10 Bollom Fire Protection
11.11.11 No-Burn, Inc.
11.11.12 SKK Pte. Ltd.
11.11.13 Demilec Usa, Inc.
11.11.14 Monarch Industrial Products (I) Pvt. Ltd.
11.11.15 Gangotri Hi-Tech Coatings
*Details Might Not Be Captured in Case of Unlisted Companies
12 Appendix (Page No. - 140)
12.1 Insights From Industry Experts
12.2 Discussion Guide
12.3 Knowledge Store: Marketsandmarkets Subscription Portal
12.4 Introducing RT: Real-Time Market Intelligence
12.5 Available Customizations
12.6 Related Reports
12.7 Author Details
List of Tables (115 Tables)
Table 1 Trends and Forecast of GDP, 2016�2022 (USD Billion)
Table 2 Passive Fire Protection Coatings Market Size, By Type, 2015�2022 (Kiloton)
Table 3 Passive Fire Protection Coatings Market Size, By Type, 2015�2022 (USD Million)
Table 4 Intumescent Passive Fire Protection Coatings Market Size, By Region, 2015�2022 (Kiloton)
Table 5 Intumescent Passive Fire Protection Coatings Market Size, By Region, 2015�2022 (USD Million)
Table 6 Cementitious Passive Fire Protection Coatings Market Size, By Region, 2015�2022 (Kiloton)
Table 7 Cementitious Passive Fire Protection Coatings Market Size, By Region, 2015�2022 (USD Million)
Table 8 Passive Fire Protection Coatings Market Size, By Technology, 2015�2022 (Kiloton)
Table 9 By Market Size, By Technology, 2015�2022 (USD Million)
Table 10 Water-Based Passive Fire Protection Coatings Market Size, By End-Use Industry, 2015�2022 (Kiloton)
Table 11 Water-Based Passive Fire Protection Coatings Market Size, By End-Use Industry, 2015�2022 (USD Million)
Table 12 Water-Based Passive Fire Protection Coatings Market Size, By Region, 2015�2022 (Kiloton)
Table 13 Water-Based Passive Fire Protection Coatings Market Size, By Region, 2015�2022 (USD Million)
Table 14 Solvent-Based Passive Fire Protection Coatings Market Size, By End-Use Industry, 2015�2022 (Kiloton)
Table 15 Solvent-Based Passive Fire Protection Coatings Market Size, By End-Use Industry, 2015�2022 (USD Million)
Table 16 Solvent-Based Passive Fire Protection Coatings Market Size, By Region, 2015�2022 (Kiloton)
Table 17 Solvent-Based Passive Fire Protection Coatings Market Size, By Region, 2015�2022 (USD Million)
Table 18 By Market Size, By End-Use Industry, 2015�2022 (Kiloton)
Table 19 By Market Size, By End-Use Industry, 2015�2022 (USD Million)
Table 20 By Market Size in Building & Construction, By Region, 2015�2022 (Kiloton)
Table 21 By Market Size in Building & Construction, By Region, 2015�2022 (USD Million)
Table 22 By Market Size in Oil & Gas, By Region, 2015�2022 (Kiloton)
Table 23 By Market Size in Oil & Gas, By Region, 2015�2022 (USD Million)
Table 24 By Market Size in Transportation, By Region, 2015�2022 (Kiloton)
Table 25 By Market Size in Transportation, By Region, 2015�2022 (USD Million)
Table 26 By Market Size in Other End-Use Industries, By Region, 2015�2022 (Kiloton)
Table 27 By Market Size in Other End-Use Industries, By Region, 2015�2022 (USD Million)
Table 28 By Market Size, By Region, 2015�2022 (Kiloton)
Table 29 By Market Size, By Region, 2015�2022 (USD Million)
Table 30 North America: By Market Size, By Country, 2015�2022 (Kiloton)
Table 31 North America: By Market Size, By Country, 2015�2022 (USD Million)
Table 32 North America: By Market Size, By Type, 2015�2022 (Kiloton)
Table 33 North America: By Market Size , By Type, 2015�2022 (USD Million)
Table 34 North America: By Market Size, By End-Use Industry, 2015�2022 (Kiloton)
Table 35 North America: By Market Size, By End-Use Industry, 2015�2022 (USD Million)
Table 36 North America: By Market Size, By Technology, 2015�2022 (Kiloton)
Table 37 North America: By Market Size , By Technology, 2015�2022 (USD Million)
Table 38 U.S.: By Market Size, By End-Use Industry, 2015�2022 (Kiloton)
Table 39 U.S.: By Market Size, By End-Use Industry, 2015�2022 (USD Million)
Table 40 Canada: By Market Size, By End-Use Industry, 2015�2022 (Kiloton)
Table 41 Canada: By Market Size, By End-Use Industry, 2015�2022 (USD Million)
Table 42 Mexico: By Market Size, By End-Use Industry, 2015�2022 (Kiloton)
Table 43 Mexico: By Market Size, By End-Use Industry, 2015�2022 (USD Million)
Table 44 Europe: By Market Size, By Country, 2015�2022 (Kiloton)
Table 45 Europe: By Market Size, By Country, 2015�2022 (USD Million)
Table 46 Europe: By Market Size, By Type, 2015�2022 (Kiloton)
Table 47 Europe: By Market Size, By Type, 2015�2022 (USD Million)
Table 48 Europe: By Market Size, By End-Use Industry, 2015�2022 (Kiloton)
Table 49 Europe: By Market Size, By End-Use Industry, 2015�2022 (USD Million)
Table 50 Europe: By Market Size, By Technology, 2015�2022 (Kiloton)
Table 51 Europe: By Market Size, By Technology, 2015�2022 (USD Million)
Table 52 U.K.: By Market Size, By End-Use Industry, 2015�2022 (Kiloton)
Table 53 U.K.: By Market Size, By End-Use Industry, 2015�2022 (USD Million)
Table 54 France: By Market Size, By End-Use Industry, 2015�2022 (Kiloton)
Table 55 France: By Market Size, By End-Use Industry, 2015�2022 (USD Million)
Table 56 Germany: By Market Size, By End-Use Industry, 2015�2022 (Kiloton)
Table 57 Germany: By Market Size, By End-Use Industry, 2015�2022 (USD Million)
Table 58 Italy: By Market Size, By End-Use Industry, 2015�2022 (Kiloton)
Table 59 Italy: By Market Size, By End-Use Industry, 2015�2022 (USD Million)
Table 60 Russia: By Market Size, By End-Use Industry, 2015�2022 (Kiloton)
Table 61 Russia: By Market Size, By End-Use Industry, 2015�2022 (USD Million)
Table 62 Rest of Europe: By Market Size, By End-Use Industry, 2015�2022 (Kiloton)
Table 63 Rest of Europe: By Market Size, By End-Use Industry, 2015�2022 (USD Million)
Table 64 Asia-Pacific: By Market Size, By Country, 2015�2022 (Kiloton)
Table 65 Asia-Pacific: By Market Size, By Country, 2015�2022 (USD Million)
Table 66 Asia-Pacific: By Market Size, By Type, 2015�2022 (Kiloton)
Table 67 Asia-Pacific: By Market Size, By Type, 2015�2022 (USD Million)
Table 68 Asia-Pacific: By Market Size, By End-Use Industry, 2015�2022 (Kiloton)
Table 69 Asia-Pacific: By Market Size, By End-Use Industry, 2015�2022 (USD Million)
Table 70 Asia-Pacific: By Market Size, By Technology, 2015�2022 (Kiloton)
Table 71 Asia-Pacific: By Market Size, By Technology, 2015�2022 (USD Million)
Table 72 China: By Market Size, By End-Use Industry, 2015�2022 (Kiloton)
Table 73 China: By Market Size, By End-Use Industry, 2015�2022 (USD Million)
Table 74 Japan: By Market Size, By End-Use Industry, 2015�2022 (Kiloton)
Table 75 Japan: By Market Size, By End-Use Industry, 2015�2022 (USD Million)
Table 76 India: By Market Size, By End-Use Industry, 2015�2022 (Kiloton)
Table 77 India: By Market Size, By End-Use Industry, 2015�2022 (USD Million)
Table 78 Malaysia: By Market Size, By End-Use Industry, 2015�2022 (Kiloton)
Table 79 Malaysia: By Market Size, By End-Use Industry, 2015�2022 (USD Million)
Table 80 Thailand: By Market Size, By End-Use Industry, 2015�2022 (Kiloton)
Table 81 Thailand: By Market Size, By End-Use Industry, 2015�2022 (USD Million)
Table 82 Singapore: By Market Size, By End-Use Industry, 2015�2022 (Kiloton)
Table 83 Singapore: By Market Size, By End-Use Industry, 2015�2022 (USD Million)
Table 84 Rest of Asia-Pacific: By Market Size, By End-Use Industry, 2015�2022 (Kiloton)
Table 85 Rest of Asia-Pacific: By Market Size, By End-Use Industry, 2015�2022 (USD Million)
Table 86 South America: By Market Size, By Country, 2015�2022 (Kiloton)
Table 87 South America: By Market Size, By Country, 2015�2022 (USD Million)
Table 88 South America: By Market Size, By Type, 2015�2022 (Kiloton)
Table 89 South America: By Market Size, By Type, 2015�2022 (USD Million)
Table 90 South America: By Market Size, By End-Use Industry, 2015�2022 (Kiloton)
Table 91 South America: By Market Size, By End-Use Industry, 2015�2022 (USD Million)
Table 92 South America: By Market Size, By Technology, 2015�2022 (Kiloton)
Table 93 South America: By Market Size, By Technology, 2015�2022 (USD Million)
Table 94 Brazil: By Market Size,By End-Use Industry, 2015�2022 (Kiloton)
Table 95 Brazil: By Market Size,By End-Use Industry, 2015�2022 (USD Million)
Table 96 Argentina: By Market Size,By End-Use Industry, 2015�2022 (Kiloton)
Table 97 Argentina: By Market Size,By End-Use Industry, 2015�2022 (USD Million)
Table 98 Rest of South America: By Market Size, By End-Use Industry, 2015�2022 (Kiloton)
Table 99 Rest of South America: By Market Size, By End-Use Industry, 2015�2022 (USD Million)
Table 100 Middle East & Africa: By Market Size, By Country, 2015�2022 (Kiloton)
Table 101 Middle East & Africa: By Market Size, By Country, 2015�2022 (USD Million)
Table 102 Middle East & Africa: By Market Size, By Type, 2015�2022 (Kiloton)
Table 103 Middle East & Africa: By Market Size, By Type, 2015�2022 (USD Million)
Table 104 Middle East & Africa: By Market Size, By End-Use Industry, 2015�2022 (Kiloton)
Table 105 Middle East & Africa: By Market Size, By End-Use Industry, 2015�2022 (USD Million)
Table 106 Middle East & Africa: By Market Size, By Technology, 2015�2022 (Kiloton)
Table 107 Middle East & Africa: By Market Size, By Technology, 2015�2022 (USD Million)
Table 108 Saudi Arabia: By Market Size, By End-Use Industry, 2015�2022 (Kiloton)
Table 109 Saudi Arabia: By Market Size, By End-Use Industry, 2015�2022 (USD Million)
Table 110 UAE: By Market Size, By End-Use Industry, 2015�2022 (Kiloton)
Table 111 UAE: By Market Size, By End-Use Industry, 2015�2022 (USD Million)
Table 112 South Africa: By Market Size, By End-Use Industry, 2015�2022 (Kiloton)
Table 113 South Africa: By Market Size, By End-Use Industry, 2015�2022 (USD Million)
Table 114 Rest of Middle East & Africa: By Market Size, By End-Use Industry, 2015�2022 (Kiloton)
Table 115 Rest of Middle East & Africa: By Market Size, By End-Use Industry, 2015�2022 (USD Million)
List of Figures (26 Figures)
Figure 1 Passive Fire Protection Coatings Market: Research Design
Figure 2 Market Size Estimation: Bottom-Up Approach
Figure 3 Market Size Estimation: Top-Down Approach
Figure 4 By Market: Data Triangulation
Figure 5 Building & Construction to Be Fastest-Growing End-Use Industry of Passive Fire Protection Coatings Market During Forecast Period
Figure 6 Water-Based Technology to Dominate Passive Fire Protection Coatings Market During Forecast Period
Figure 7 Asia-Pacific Dominated Passive Fire Protection Coatings Market in 2016
Figure 8 Passive Fire Protection Coatings Market to Witness Rapid Growth Between 2017 and 2022
Figure 9 Asia-Pacific to Lead Passive Fire Protection Coatings Market, 2017�2022
Figure 10 Asia-Pacific Accounted for Largest Share of Passive Fire Protection Coatings Market, 2016
Figure 11 Building & Construction to Account for Largest Share of Overall Passive Fire Protection Coatings Market, 2017�2022
Figure 12 Asia-Pacific to Be Fastest-Growing Passive Fire Protection Coatings Market Between 2017 and 2022
Figure 13 Drivers, Restraints, Opportunities, and Challenges in the Passive Fire Protection Coatings Market
Figure 14 Share of Steel Demand, By Region (2017)
Figure 15 Cementitious Coatings to Lead Passive Fire Protection Coatings Market During Forecast Period
Figure 16 Water-Based Technology to Lead Passive Fire Protection Coatings Market During Forecast Period
Figure 17 Building & Construction End-Use Industry to Lead Passive Fire Protection Coatings Market During Forecast Period
Figure 18 Regional Snapshot (2017�2022): Rapid Growth Markets are Emerging as New Hotspots
Figure 19 U.S. Dominates the North America Passive Fire Protection Coatings Market
Figure 20 China Dominates the Asia-Pacific Passive Fire Protection Coatings Market
Figure 21 Akzo Nobel N.V.: Company Snapshot
Figure 22 PPG Industries, Inc.: Company Snapshot
Figure 23 The Sherwin-Williams Company: Company Snapshot
Figure 24 Jotun: Company Snapshot
Figure 25 Hempel A/S: Company Snapshot
Figure 26 Kansai Paint Co., Ltd.: Company Snapshot


Growth opportunities and latent adjacency in Passive Fire Protection Coatings Market