Payment as a Service Market by Component (Platform and Services), Service (Professional (Integration & Deployment and Support & Maintenance) and Managed Services), Vertical (Retail and Hospitality), and Region - Global Forecast to 2024


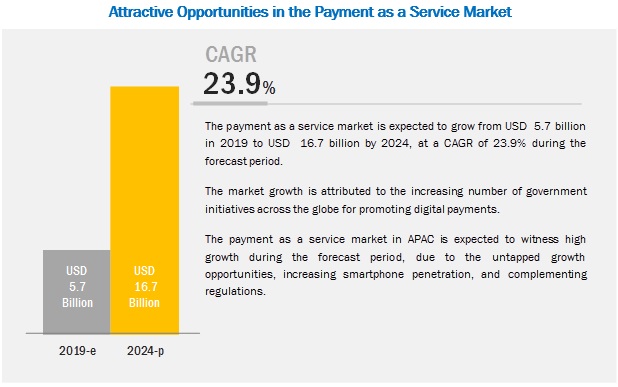
[119 Pages Report] The payment as a service market size is expected to grow from USD 5.7 billion in 2019 to USD 16.7 billion by 2024, at a Compound Annual Growth Rate (CAGR) of 23.9% during the forecast period. Regulatory initiatives to promote payment solutions thriving on secure and real-time transactions; and optimized customer/merchant experience with quick and secure payment methods are the major factors driving the growth of the market.
By vertical, the retail vertical to be the significant contributor in the payment as a service market during the forecast period
Due to the evolving customer-centric model, retailers are modernizing their brick-and-mortar stores to provide improved services to their customers and establishing online stores to increase revenue. According to Mobile Payments Conference, in 2017, 1.5 billion people worldwide preferred online shopping. By 2019, the number will grow to 2 billion digital buyers. The growing marketplace of online shopping is paving the way for enterprise merchants, as these shoppers need an easy and safe way to pay for their purchases. Moreover, the retailers are also adopting innovative technologies, such as cloud computing, big data analytics, digital stores, and social networks, to increase their visibility and presence in the market. They are realizing the benefits of contactless payments, which include reduced transaction time, increased revenue, improved operational efficiency, and minimized operating costs.
Managed services segment to grow at the highest CAGR during the forecast period
Managed services are crucial, as they are directly related to enhancing customer experience; hence, companies cannot afford to compromise on these services, as they help them sustain their position in the market. It has become challenging for companies to focus on their core business processes and simultaneously support various other functions, which, in turn, increases the significance of managed services. These services offer the technical skills required to maintain and update API-based payment platforms. All pre- and post-deployment queries as well as customer demands are addressed with the help of managed services. Companies mainly outsource managed services to focus on their core business. The emergence of hosted payment solutions is expected to increase the demand for managed services in the payment as a service market. Managed services help merchants reduce infrastructure complexity and operational cost, and simultaneously provide a secure and global infrastructure.
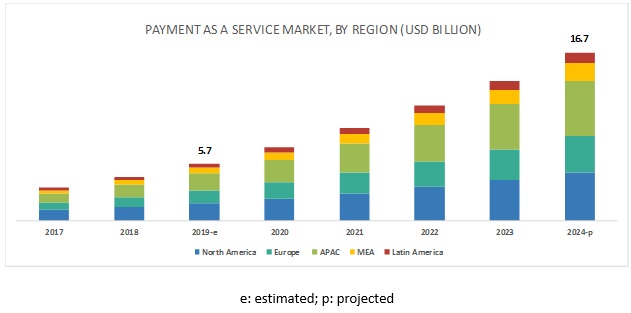
Asia Pacific to grow at the highest CAGR during the forecast period
APAC is expected to witness strong growth owing to the increased demand for integrated payment solutions and advancements in payment technologies, benefitting all stakeholders present in the payment ecosystem in the APAC region. The region includes major economies, such as China, Japan, South Korea, Australia, and New Zealand, which are making consistent improvements in their payment industry. The countries in the region have undertaken major initiatives to improve the payment industry. For instance, the Asian Payments Network (APN) is a group of 11 Asian countries that include China, Singapore, Malaysia, Thailand, Vietnam, Indonesia, Philippines, South Korea, Japan, New Zealand, and Australia to promote cross-border banking transactions in the region. Moreover, the rapid growth of the payment as a service market in the region can be attributed to the active online engagement of consumers in the emerging countries of the region.
Key Market Players
The major vendors in the payment as a service market are First Data (US), TSYS (US), Paysafe (UK), Verifone (US), Ingenico (France), Aurus (US), Agilysys (US), Pineapple Payments (US), Alpha Fintech (Ireland), First American Payment Systems (US), FIS (US), allpago (Germany), Helcim (Canada), Valitor (Iceland), Intelligent Payments (Gibraltar), PayStand (US) and PPRO (UK).
Get online access to the report on the World's First Market Intelligence Cloud
- Easy to Download Historical Data & Forecast Numbers
- Company Analysis Dashboard for high growth potential opportunities
- Research Analyst Access for customization & queries
- Competitor Analysis with Interactive dashboard
- Latest News, Updates & Trend analysis
Request Sample Scope of the Report
:
Get online access to the report on the World's First Market Intelligence Cloud
- Easy to Download Historical Data & Forecast Numbers
- Company Analysis Dashboard for high growth potential opportunities
- Research Analyst Access for customization & queries
- Competitor Analysis with Interactive dashboard
- Latest News, Updates & Trend analysis

|
Report Metrics |
Details |
|
Market size available for years |
2017�2024 |
|
Base year considered |
2018 |
|
Forecast period |
2019�2024 |
|
Forecast units |
Value (USD) |
|
Segments covered |
Components (platform and services), services (professional [integration and deployment, consulting, and support and maintenance] and managed services), verticals, and regions |
|
Geographies covered |
North America, APAC, Europe, MEA, and Latin America |
|
Companies covered |
First Data (US), TSYS (US), Paysafe (UK), Verifone (US), Ingenico (France), Aurus (US), Agilysys (US). A total of 17 players were covered. |
This research report categorizes the payment as service market based on components (platform and services), services (professional [integration and deployment, consulting, and support and maintenance] and managed services), verticals, and regions
By Component:
- Platform
- Services
By Service
- Professional services
- Managed services
By Vertical:
- Retail
- Hospitality
- Media and entertainment
- Healthcare
- Banking, Financial Services, and Insurance (BFSI)
- Others (sports and leisure, NGO, government, energy and utilities, and education)
By Region:
- North America
- Europe
- APAC
- MEA
- Latin America
Recent Developments:
- In March 2019, First Data has enhanced its payment services by acquiring ayCash, a company that provides digital merchant services in Germany.
- In April 2019, Paysafe and PaySimply have partnered to enable online tax payment in Canada by integrating with Paysafe�s online cash solution, Paysafecash.
Key questions addressed by the report:
- Where would all these developments take the industry in the mid to long term?
- What are the upcoming industry solutions for the payment as a service market?
- Which are the major factors expected to drive the market?
- Which region would offer high growth for vendors in the market?
- Which solution would gain the largest market share in the market?
To speak to our analyst for a discussion on the above findings, click Speak to Analyst
Table of Contents
1 Introduction (Page No. - 14)
1.1 Objectives of the Study
1.2 Market Definition
1.3 Market Scope
1.3.1 Market Segmentation
1.3.2 Regions Covered
1.4 Years Considered for the Study
1.5 Currency Considered
1.6 Stakeholders
2 Research Methodology (Page No. - 18)
2.1 Research Data
2.1.1 Secondary Data
2.1.2 Primary Data
2.1.2.1 Breakup of Primary Profiles
2.1.2.2 Key Industry Insights
2.2 Market Breakup and Data Triangulation
2.3 Market Size Estimation
2.3.1 Top-Down Approach
2.3.2 Bottom-Up Approach
2.4 Market Forecast
2.5 Competitive Leadership Methodology
2.6 Assumptions for the Study
2.7 Limitations of the Study
3 Executive Summary (Page No. - 26)
4 Premium Insights (Page No. - 29)
4.1 Attractive Opportunities in the Market
4.2 Global Market, By Service and Region
4.3 Payment as a Service Market, By Region
4.4Market: Global Revenue Share
5 Market Overview (Page No. - 32)
5.1 Introduction
5.2 Market Dynamics
5.2.1 Drivers
5.2.1.1 Regulatory Initiatives to Promote Payment Solutions Thriving on Secure and Real-Time Transactions
5.2.1.2 Optimized Customer/Merchant Experience With Quick and Secure Payment Methods
5.2.2 Restraints
5.2.2.1 Lack of Unification of Global Standards for Cross Border Payments
5.2.3 Opportunities
5.2.3.1 Government Initiatives Change the Favoring Adoption of Payment as a Service By Merchants
5.2.3.2 Rising Demand for Integrated Payment Procedures and Adoption of Alternative Payment Methods
5.2.4 Challenges
5.2.4.1 Lack of Awareness About Applications of Payment as a Service Solutions
5.3 Use Cases
5.3.1 First Data
5.3.2 Valitor
5.3.3 Agilysys
5.3.4 Ingenico
5.3.5 Verifone
5.4 Payment Services Evolution Models
5.4.1 Enterprise License Model
5.4.2 Managed Service
5.4.3 Service Bureau Model
5.4.4 Payment as a Service
6 Payment as a Service Market, By Component (Page No. - 37)
6.1 Introduction
6.2 Platform
6.2.1 Need for Increasing Customer Satisfaction and Decreasing Infrastructure Costs to Drive the Platforms Market
6.3 Services
6.3.1 Increase in the Number of Digital Transactions in Emerging Economies to Drive the Services Segment
7 Payment as a Service Market, By Service (Page No. - 41)
7.1 Introduction
7.2 Professional Services
7.2.1 Integration and Deployment
7.2.1.1 Growing Demand for Api-Based Integration Services to Fuel the Growth of Integration and Deployment Services
7.2.2 Consulting
7.2.2.1 Technology Shift From Traditional to Digital Payments to Improve Customer Experience to Drive the Consulting Services Market
7.2.3 Support and Maintenance
7.2.3.1 Increased Demand for Regular System Check-Ups, Backup Support, and Hardware and Software Maintenance to Set the Growth of Support and Maintenance Services
7.3 Managed Services
7.3.1 Vendors Providing Managed Services Offer A Complete Suite to Enhance the Customer Experience Management
8 Payment as a Service Market, By Vertical (Page No. - 49)
8.1 Introduction
8.2 Retail
8.2.1 Growing Marketplace for Online Retail Shopping to Drive the Demand for Payment as a Service in the Retail Vertical
8.3 Hospitality
8.3.1 Growing Demand for Enhanced Customer Experience to Fuel the Demand for Payment as a Service in the Hospitality Vertical
8.4 Media and Entertainment
8.4.1 Expansion of Smartphones Market and Availability of High Speed and Affordable Data Services to Set the Demand for Payment as a Service in Media and Entertainment Vertical
8.5 Healthcare
8.5.1 Increase in Healthcare Spending and Rapid Deployment of New Technologies to Fuel the Demand for Payment as a Service in the Healthcare Vertical
8.6 Banking, Financial Services, and Insurance
8.6.1 Increasing Focus on Real-Time Payments to Drive the Demand for Payment as a Service in the BFSI Vertical
8.7 Others
9 Payment as a Service Market, By Region (Page No. - 57)
9.1 Introduction
9.2 North America
9.2.1 United States
9.2.1.1 Business Expansion Strategies Adopted By Major Payment as a Service Providers Contributing Toward the Growth
of Market in the US
9.2.2 Canada
9.2.2.1 Adoption of Payment as a Service Solutions By Country�s Enterprises Enhanced the Growth of Market in Canada
9.3 Europe
9.3.1 United Kingdom
9.3.1.1 Government Regulations Working as a Catalyst for the Growth of Payment as a Service Market in the UK
9.3.2 Germany
9.3.2.1 Changing Market Dynamics in Germany Due to Business Expansion Strategies By Large Enterprises Fueling the Growth of Market
9.3.3 France
9.3.3.1 Transformation From Traditional Payment Methods to Electronic Payment Methods to Drive the Growth of Market in France
9.3.4 Rest of Europe
9.4 Asia Pacific
9.4.1 China
9.4.1.1 Changing Paradigm of Payment Industry in China to Drive the Growth of Payment as a Service Technology
9.4.2 Japan
9.4.2.1 Payment as a Service Market Being Driven By the Adoption of New Frameworks for Third-Party Providers in Japan
9.4.3 South Korea
9.4.3.1 Government Initiatives Triggering the Growth of Market in the Country
9.4.4 Australia and New Zealand
9.4.4.1 Adoption of Payment Regulations to Drive the Growth of Market in Anz
9.4.5 Rest of Asia Pacific
9.5 Middle East and Africa
9.5.1 Kingdom of Saudi Arabia
9.5.1.1 Enterprises in the Ksa to Adopt Payment as a Service Solution for Improving Their Payment Processes
9.5.2 United Arab Emirates
9.5.2.1 Changing Paradigm of the Payment Industry in the UAE to Drive the Growth of Payment as a Service Technology
9.5.3 Rest of Middle East and Africa
9.6 Latin America
9.6.1 Brazil
9.6.1.1 Growing Adoption of Payment as a Service Solution By Enterprises in Brazil to Improve Business Transactions
9.6.2 Mexico
9.6.2.1 Recent Government Initiatives to Drive the Growth of Payment as a Service Market in the Country
9.6.3 Rest of Latin America
10 Competitive Landscape (Page No. - 80)
10.1 Overview
10.2 Competitive Leadership Mapping
10.2.1 Visionary Leaders
10.2.2 Innovators
10.2.3 Dynamic Differentiators
10.2.4 Emerging Companies
10.3 Ranking of Key Players
10.4 Competitive Scenario
10.4.1 New Product/Service Launches and Product Enhancements
10.4.2 Partnerships, Collaborations, and Agreements
10.4.3 Mergers and Acquisitions
11 Company Profiles (Page No. - 87)
11.1 Introduction
(Business Overview, Platforms/Products/Services/Solutions Offered, Recent Developments, SWOT Analysis, and MnM View)*
11.2 First Data
11.3 TSYS
11.4 Paysafe
11.5 Verifone
11.6 Ingenico
11.7 Aurus
11.8 Agilysys
11.9 Pineapple Payments
11.10 Alpha Fintech
11.11 First American Payment Systems
* Business Overview, Platforms/Products/Services/Solutions Offered, Recent Developments, SWOT Analysis, and MnM View Might Not Be
Captured in Case of Unlisted Companies.
11.12 FIS
11.13 Allpago
11.14 Helcim
11.15 Valitor
11.16 Intelligent Payments
11.17 PPRO
11.18 PayStand
12 Appendix (Page No. - 113)
12.1 Discussion Guide
12.2 Knowledge Store: Marketsandmarkets� Subscription Portal
12.3 Available Customizations
12.4 Related Reports
12.5 Author Details
List of Tables (47 Tables)
Table 1 United States Dollar Exchange Rate, 2016�2018
Table 2 Factor Analysis
Table 3 Payment as a Service Market Size and Growth Rate, 2019�2024 (USD Million, Y-O-Y%)
Table 4 Market Size, By Component, 2017�2024 (USD Million)
Table 5 Market Size, By Service, 2017�2024 (USD Million)
Table 6 Professional Services: Market Size, By Type, 2017�2024 (USD Million)
Table 7 Integration and Deployment Market Size, By Region, 2017�2024 (USD Million)
Table 8 Consulting Market Size, By Region, 2017�2024 (USD Million)
Table 9 Support and Maintenance Segment Market Size, By Region, 2017�2024 (USD Million)
Table 10 Managed Services: Market Size, By Region, 2017�2024 (USD Million)
Table 11 Payment as a Service Market Size, By Vertical, 2017�2024 (USD Million)
Table 12 Retail: Market Size, By Region, 2017�2024 (USD Million)
Table 13 Hospitality: Market Size, By Region, 2017�2024 (USD Million)
Table 14 Media and Entertainment: Market Size, By Region, 2017�2024 (USD Million)
Table 15 Healthcare: Market Size, By Region, 2017�2024 (USD Million)
Table 16 Banking, Financial Services, and Insurance: Market Size, By Region, 2017�2024 (USD Million)
Table 17 Others: Market Size, By Region, 2017�2024 (USD Million)
Table 18 Payment as a Service Market Size, By Region, 2017�2024 (USD Million)
Table 19 North America: Market Size, By Component, 2017�2024 (USD Million)
Table 20 North America: Market Size, By Service, 2017�2024 (USD Million)
Table 21 North America: Professional Service Market Size, By Type, 2017�2024 (USD Million)
Table 22 North America: Market Size, By Vertical, 2017�2024 (USD Million)
Table 23 North America: Market Size, By Country, 2017�2024 (USD Million)
Table 24 Europe: Market Size, By Component, 2017�2024 (USD Million)
Table 25 Europe: Market Size, By Service, 2017�2024 (USD Million)
Table 26 Europe: Professional Service Market Size, By Type, 2017�2024 (USD Million)
Table 27 Europe: Market Size, By Vertical, 2017�2024 (USD Million)
Table 28 Europe: Market Size, By Country, 2017�2024 (USD Million)
Table 29 Asia Pacific: Payment as a Service Market Size, By Component, 2017�2024 (USD Million)
Table 30 Asia Pacific: Market Size, By Service, 2017�2024 (USD Million)
Table 31 Asia Pacific: Professional Service Market Size, By Type, 2017�2024 (USD Million)
Table 32 Asia Pacific: Market Size, By Vertical, 2017�2024 (USD Million)
Table 33 Asia Pacific: Market Size, By Country, 2017�2024 (USD Million)
Table 34 Middle East and Africa: Market Size, By Component, 2017�2024 (USD Million)
Table 35 Middle East and Africa: Market Size, By Service, 2017�2024 (USD Million)
Table 36 Middle East and Africa: Professional Service Market Size, By Type, 2017�2024 (USD Million)
Table 37 Middle East and Africa: Market Size, By Vertical, 2017�2024 (USD Million)
Table 38 Middle East and Africa: Market Size, By Country, 2017�2024 (USD Million)
Table 39 Latin America: Payment as a Service Market Size, By Component, 2017�2024 (USD Million)
Table 40 Latin America: Market Size, By Service, 2017�2024 (USD Million)
Table 41 Latin America: Professional Service Market Size, By Type, 2017�2024 (USD Million)
Table 42 Latin America: Market Size, By Vertical, 2017�2024 (USD Million)
Table 43 Latin America: Market Size, By Country, 2017�2024 (USD Million)
Table 44 Evaluation Criteria
Table 45 New Product/Service Launches and Product Enhancements, 2018�2019
Table 46 Partnerships, Collaborations, and Agreements, 2018�2019
Table 47 Mergers and Acquisitions, 2017�2019
List of Figures (43 Figures)
Figure 1 Payment as a Service Market: Research Design
Figure 2 Market Estimation and Forecast Methodology
Figure 3 Competitive Leadership Mapping Matrix: Criteria Weightage
Figure 4 Market Top 3 Segments, 2019
Figure 5 Platform Segment to Account for A Higher Market Share in 2019
Figure 6 Rising Demand for Integrated Payment Procedures and Adoption of Alternative Payment Methods to Provide an Opportunity in the Market
Figure 7 Professional Services Segment and North America Region to Hold the Highest Market Shares in 2019
Figure 8 Asia Pacific to Grow at the Highest CAGR During the Forecast Period
Figure 9 Asia Pacific to Emerge as the Best Market for Investment Over the Next 5 Years
Figure 10 Drivers, Restraints, Opportunities, and Challenges: Payment as a Service Market
Figure 11 Platform Segment to Dominate the Market By Component During the Forecast Period
Figure 12 Asia Pacific to Dominate the Platform Segment During the Forecast Period
Figure 13 North America to Have the Largest Market Size in the Services Segment of the Market During the Forecast Period
Figure 14 Managed Services Segment to Hold A Significant Market Size During the Forecast Period
Figure 15 Support and Maintenance Segment to Grow at the Highest CAGR During the Forecast Period
Figure 16 North America to Dominate the Integration and Deployment Segment During the Forecast Period
Figure 17 Support and Maintenance Segment in North America to Grow at A Significant Pace During the Forecast Period
Figure 18 Asia Pacific to Grow at the Highest CAGR in the Managed Services Segment During the Forecast Period
Figure 19 Retail Vertical to Hold the Largest Market Size During the Forecast Period
Figure 20 Asia Pacific to Dominate the Retail Vertical During the Forecast Period
Figure 21 Asia Pacific to Grow at the Highest CAGR in the Hospitality Vertical During the Forecast Period
Figure 22 Asia Pacific to Exhibit the Highest CAGR in the Payment as a Service Market During the Forecast Period
Figure 23 Asia Pacific to Grow at the Highest CAGR During the Forecast Period
Figure 24 North America: Market Snapshot
Figure 25 Services Segment to Grow at A Higher CAGR in North America During the Forecast Period
Figure 26 Platform Segment to Have A Larger Market Size in Europe During the Forecast Period
Figure 27 Asia Pacific: Market Snapshot
Figure 28 Services Segment to Grow at A Higher CAGR in Asia Pacific During the Forecast Period
Figure 29 Platform Segment to Have A Larger Market Share in Middle East and Africa During the Forecast Period
Figure 30 Services Segment to Grow at A Higher CAGR in Latin America During the Forecast Period
Figure 31 Payment as a Service Market (Global) Competitive Leadership Mapping, 2019
Figure 32 Ranking of Key Players in the Market (Overall Market)
Figure 33 Key Developments By the Leading Players in the Market During 2017�2019
Figure 34 First Data: Company Snapshot
Figure 35 First Data: SWOT Analysis
Figure 36 TSYS: Company Snapshot
Figure 37 TSYS: SWOT Analysis
Figure 38 Paysafe: SWOT Analysis
Figure 39 Verifone: Company Snapshot
Figure 40 Verifone: SWOT Analysis
Figure 41 Ingenico: Company Snapshot
Figure 42 Ingenico: SWOT Analysis
Figure 43 Agilysys: Company Snapshot
The study involved 4 major steps to estimate the current market size for the payment as a service market. The exhaustive secondary research was done to collect information on the market, the peer market, and the parent market. The next step was to validate these findings, assumptions, and sizing with industry experts across value chain through primary research. Both top-down and bottom-up approaches were employed to estimate the complete market size. Thereafter, market breakup and data triangulation were used to estimate the market size of the segments and subsegments.
Secondary Research
In the secondary research process, various secondary sources, such as Hoovers, Bloomberg BusinessWeek, and Dun & Bradstreet, have been referred for, to identify and collect information for this study. These secondary sources included annual reports, press releases, and investor presentations of companies; white papers, technology journals, and certified publications; and articles from recognized authors, directories, and databases.
Primary Research
The payment as a service market comprises several stakeholders, such as payment as a service providers, payment solution and service providers, Point of Sale (POS) services, market operators (smart card vendors), financial institutions, merchant acquirers, mobile network operators, credit/debit card providers, cloud payment solution providers, payment security service providers, system integrators, and technology consultants. The extensive primary research was conducted to gather information and verify and validate the critical numbers arrived at. Primary research was also conducted to identify the segmentation types; industry trends; key players; the competitive landscape of different market players; and key market dynamics, such as drivers, restraints, opportunities, challenges, industry trends, and key strategies. Following is the breakup of primary respondents:
To know about the assumptions considered for the study, download the pdf brochure
Market Size Estimation
Both top-down and bottom-up approaches were used to estimate and validate the overall size of the payment as a service market. These methods were also used extensively to estimate the size of various subsegments in the market. The research methodology used to estimate the market size includes the following:
- The key players in the industry and the market have been identified through extensive secondary research.
- The payment as a service market expenditures across regions, along with the geographic split in various segments, have been considered to arrive at the overall market size.
- All percentage shares, splits, and breakups have been determined using secondary sources and verified through primary sources.
Data Triangulation
After arriving at the overall market size � using the market size estimation processes as explained above � the market was split into several segments and subsegments. To complete the overall market engineering process and arrive at the exact statistics of each market segment and subsegment, data triangulation and market breakup procedures were employed, wherever applicable. The data was triangulated by studying various factors and trends from both the demand and supply sides in the payment as a service industry.
Report Objectives:
- To define, describe, and forecast the payment as a service market by component, service, vertical, and region
- To provide detailed information about the major factors (drivers, restraints, opportunities, and industry-specific challenges) influencing the market growth
- To analyze the opportunities in the market and provide details of the competitive landscape for stakeholders and market leaders
- To forecast the market size of the segments with respect to 5 main regions, namely, North America, Europe, Asia Pacific (APAC), Middle East and Africa (MEA), and Latin America
- To profile the key players and comprehensively analyze their market rankings and core competencies2
- To analyze competitive developments, such as new partnerships, new contracts, and new product developments, in the payment as a service market
2Core competencies of the companies have been captured in terms of their key developments and key strategies adopted by them to sustain their positions in the market.
Available Customizations
With the given market data, MarketsandMarkets offers customizations as per the company�s specific needs. The following customization options are available for the report:
Geographic Analysis
- Further breakup of the North American market into the US and Canada
- Further breakup of the European market into the UK, France, and Rest of Europe
- Further breakup of the APAC market into China, Japan, and Rest of APAC
- Further breakup of the MEA market into Africa and the Middle East
- Further breakup of the Latin American market into Brazil, Mexico, and Rest of Latin America
Company Information
- Detailed analysis and profiling of additional market players


Growth opportunities and latent adjacency in Payment as a Service Market