TABLE OF CONTENTS
1 INTRODUCTION (Page No. - 36)
1.1 STUDY OBJECTIVES
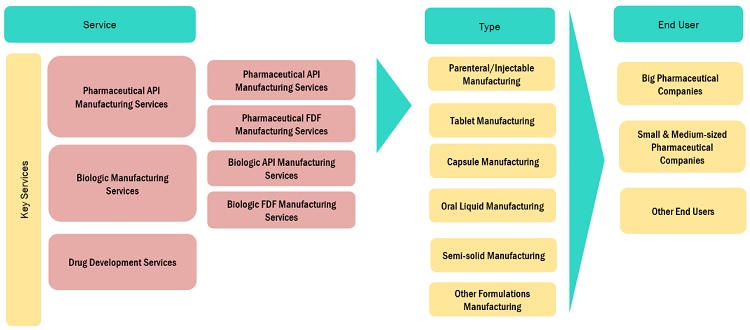
1.2 MARKET DEFINITION
1.2.1 INCLUSIONS AND EXCLUSIONS
1.3 MARKET SCOPE
1.4 YEARS CONSIDERED
1.5 CURRENCY CONSIDERED
1.6 STAKEHOLDERS
1.7 LIMITATIONS
1.8 SUMMARY OF CHANGES
1.9 RECESSION IMPACT
2 RESEARCH METHODOLOGY (Page No. - 40)
2.1 RESEARCH DATA
FIGURE 1 RESEARCH DESIGN
2.1.1 SECONDARY DATA
2.1.2 PRIMARY DATA
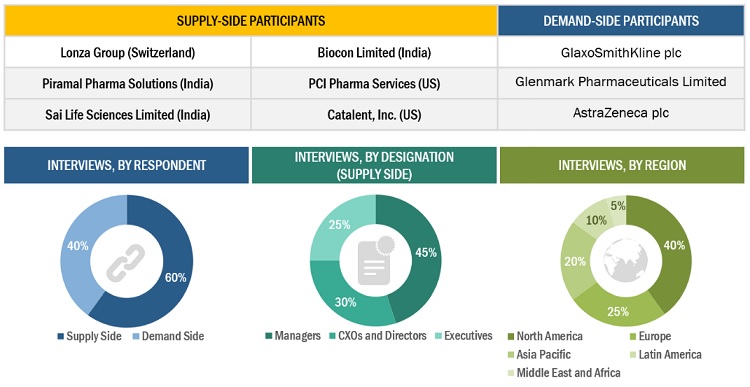
FIGURE 2 PHARMACEUTICAL CONTRACT MANUFACTURING MARKET: BREAKDOWN OF PRIMARIES
2.2 MARKET SIZE ESTIMATION
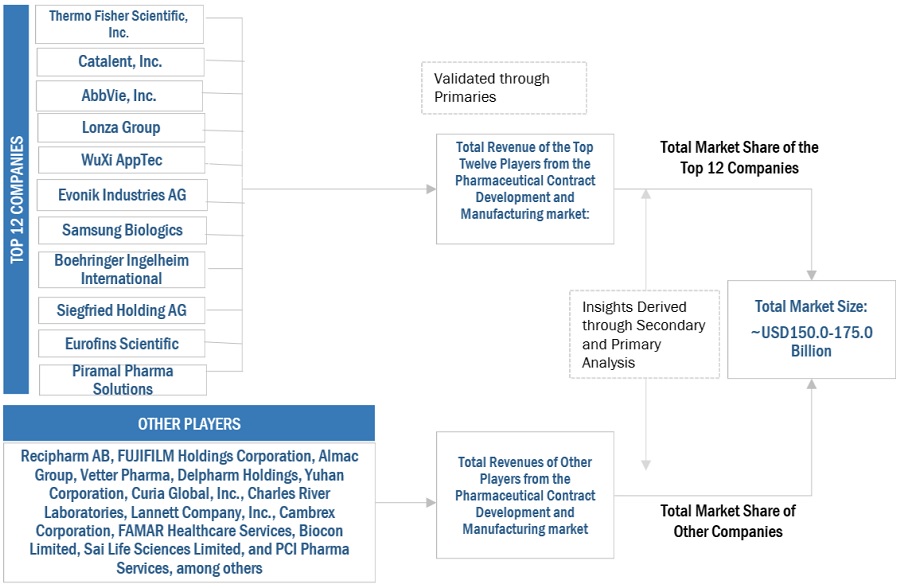
FIGURE 3 PHARMACEUTICAL CONTRACT MANUFACTURING INDUSTRY SIZE ESTIMATION (SUPPLY-SIDE ANALYSIS), 2022
FIGURE 4 MARKET SIZE ESTIMATION: APPROACH 1 (REVENUE SHARE ANALYSIS), 2022
FIGURE 5 ILLUSTRATIVE EXAMPLE OF THERMO FISHER SCIENTIFIC, INC.: REVENUE SHARE ANALYSIS, 2022
2.2.1 INSIGHTS FROM PRIMARIES
FIGURE 6 MARKET VALIDATION FROM PRIMARY EXPERTS
2.2.2 SEGMENT ASSESSMENT (BY SERVICE AND END USER)
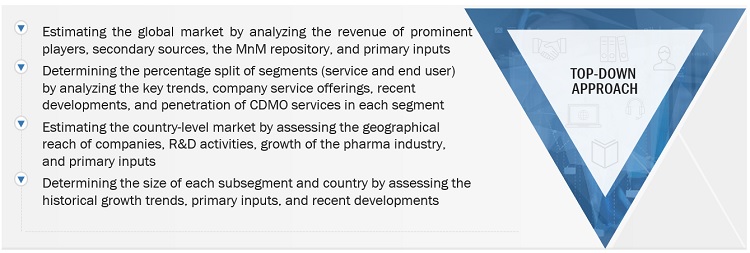
FIGURE 7 MARKET SIZE ESTIMATION METHODOLOGY: TOP-DOWN APPROACH
2.3 GROWTH RATE ASSUMPTIONS/GROWTH FORECAST
FIGURE 8 PHARMACEUTICAL CONTRACT MANUFACTURING INDUSTRY: CAGR PROJECTIONS, 2023–2028
FIGURE 9 PHARMACEUTICAL CONTRACT MANUFACTURING INDUSTRY: GROWTH ANALYSIS OF DRIVERS, RESTRAINTS, CHALLENGES, AND OPPORTUNITIES
2.4 MARKET BREAKDOWN AND DATA TRIANGULATION
FIGURE 10 DATA TRIANGULATION METHODOLOGY
2.5 RESEARCH ASSUMPTIONS
2.6 RISK ANALYSIS
2.7 IMPACT ANALYSIS OF RECESSION ON MARKET
TABLE 1 GLOBAL INFLATION RATE PROJECTIONS, 2024–2027 (% GROWTH)
TABLE 2 US HEALTH EXPENDITURE, 2019–2027 (USD MILLION)
TABLE 3 US HEALTH EXPENDITURE, 2023–2027 (USD MILLION)
3 EXECUTIVE SUMMARY (Page No. - 52)
FIGURE 11 PHARMACEUTICAL CONTRACT MANUFACTURING MARKET, BY SERVICE, 2023 VS. 2028 (USD BILLION)
FIGURE 12 BIOLOGIC MANUFACTURING SERVICES MARKET, BY TYPE, 2023 VS. 2028 (USD BILLION)
FIGURE 13 PHARMACEUTICAL CONTRACT MANUFACTURING INDUSTRY, BY END USER, 2023 VS. 2028 (USD BILLION)
FIGURE 14 GEOGRAPHICAL SNAPSHOT: PHARMACEUTICAL CONTRACT MAMARKET
4 PREMIUM INSIGHTS (Page No. - 56)
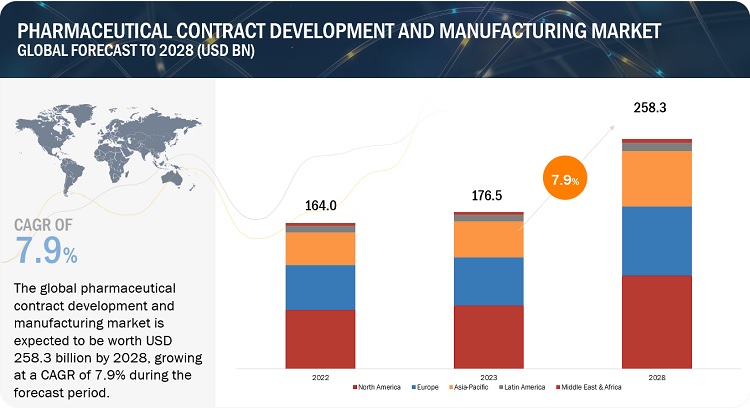
4.1 PHARMACEUTICAL CONTRACT MANUFACTURING MARKET OVERVIEW
FIGURE 15 RISING INVESTMENTS IN PHARMACEUTICAL R&D TO DRIVE MARKET GROWTH
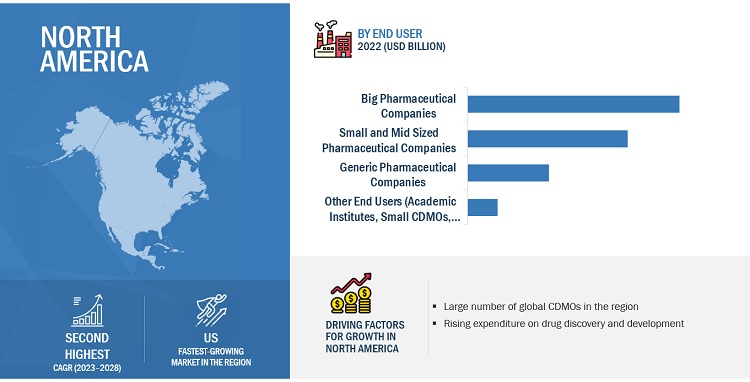
4.2 NORTH AMERICA: MARKET, BY SERVICE & COUNTRY (2022)
FIGURE 16 PHARMACEUTICAL MANUFACTURING SERVICES ACCOUNTED FOR LARGEST SHARE OF NORTH AMERICAN MARKET IN 2022
4.3 PHARMACEUTICAL CONTRACT MANUFACTURING INDUSTRY, BY SERVICE, 2023 VS. 2028 (USD BILLION)
FIGURE 17 PHARMACEUTICAL MANUFACTURING SERVICES SEGMENT TO DOMINATE MARKET TILL 2028
4.4 MARKET SHARE, BY END USER, 2022
FIGURE 18 BIG PHARMACEUTICAL COMPANIES SEGMENT ACCOUNTED FOR LARGEST MARKET SHARE IN 2022
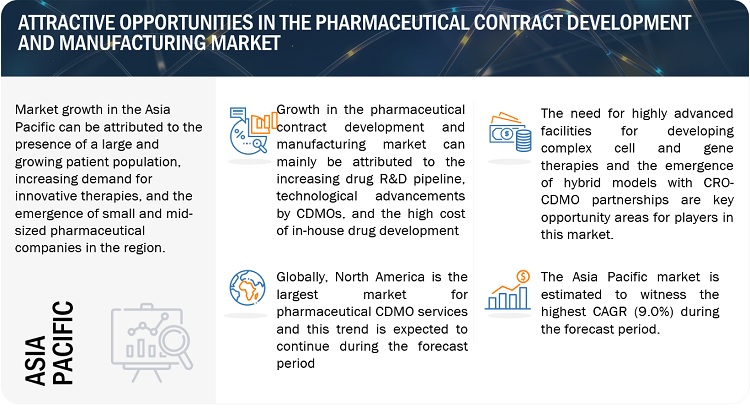
4.5 MARKET: GEOGRAPHIC GROWTH OPPORTUNITIES
FIGURE 19 ASIA PACIFIC TO REGISTER HIGHEST GROWTH FROM 2023 TO 2028
5 MARKET OVERVIEW (Page No. - 60)
5.1 INTRODUCTION
5.2 MARKET DYNAMICS
FIGURE 20 PHARMACEUTICAL CONTRACT MANUFACTURING MARKET: DRIVERS, RESTRAINTS, OPPORTUNITIES, AND CHALLENGES
TABLE 4 PHARMACEUTICAL CONTRACT MANUFACTURING AND DEVELOPMENT MARKET: IMPACT ANALYSIS
5.2.1 DRIVERS
5.2.1.1 Increased investment in precision medicines
5.2.1.2 Patent expiry & increasing demand for generic drugs
TABLE 5 IMPENDING PATENT EXPIRY OF BLOCKBUSTER DRUGS, BY YEAR
5.2.1.3 High cost of in-house drug development
FIGURE 21 AVERAGE COST OF DEVELOPING PHARMACEUTICAL COMPOUNDS FROM DISCOVERY TO LAUNCH, 2010–2020 (USD BILLION)
5.2.1.4 Investments in advanced manufacturing technologies by CDMOs
5.2.2 RESTRAINTS
5.2.2.1 Varying regulatory requirements across regions
5.2.3 OPPORTUNITIES
5.2.3.1 Rising demand for cell & gene therapy
TABLE 6 EXPANSIONS BY TOP COMPANIES IN 2022
5.2.3.2 Growing inclination toward one-stop-shop model
5.2.3.3 Market expansion in emerging countries
5.2.3.4 Growth of nuclear medicine
5.2.4 CHALLENGES
5.2.4.1 Introduction of serialization
5.2.4.2 Intellectual property risk
5.3 VALUE CHAIN ANALYSIS
FIGURE 22 VALUE CHAIN ANALYSIS: API PRODUCTION AND FORMULATION ADD MAXIMUM VALUE
5.4 ECOSYSTEM ANALYSIS
FIGURE 23 ECOSYSTEM ANALYSIS: MARKET
TABLE 7 MARKET: ROLE IN ECOSYSTEM
5.5 TECHNOLOGY ANALYSIS
5.6 PORTER’S FIVE FORCES ANALYSIS
TABLE 8 MARKET: PORTER’S FIVE FORCES ANALYSIS
5.6.1 THREAT OF NEW ENTRANTS
5.6.2 THREAT OF SUBSTITUTES
5.6.3 BARGAINING POWER OF SUPPLIERS
5.6.4 BARGAINING POWER OF BUYERS
5.6.5 INTENSITY OF COMPETITIVE RIVALRY
5.7 REGULATORY ANALYSIS
TABLE 9 NORTH AMERICA: REGULATORY BODIES, GOVERNMENT AGENCIES, AND OTHER ORGANIZATIONS
TABLE 10 EUROPE: REGULATORY BODIES, GOVERNMENT AGENCIES, AND OTHER ORGANIZATIONS
TABLE 11 ASIA PACIFIC: REGULATORY BODIES, GOVERNMENT AGENCIES, AND OTHER ORGANIZATIONS
TABLE 12 ROW: REGULATORY BODIES, GOVERNMENT AGENCIES, AND OTHER ORGANIZATIONS
TABLE 13 REGULATORY SCENARIO IN DIFFERENT COUNTRIES
5.8 KEY CONFERENCES & EVENTS, 2022–2023
TABLE 14 MARKET: DETAILED LIST OF CONFERENCES & EVENTS, 2022–2023
5.9 KEY STAKEHOLDERS AND BUYING CRITERIA
5.9.1 KEY STAKEHOLDERS IN BUYING PROCESS
FIGURE 24 INFLUENCE OF STAKEHOLDERS ON BUYING PROCESS OF CDMO SERVICES
5.9.2 BUYING CRITERIA
FIGURE 25 KEY BUYING CRITERIA FOR END USERS
5.1 TRENDS/DISRUPTIONS IMPACTING CUSTOMERS’ BUSINESS
FIGURE 26 REVENUE SHIFT & NEW POCKETS FOR MARKET
5.11 ANDA APPROVALS
FIGURE 27 ANDA APPROVALS, 2018–2022
FIGURE 28 REGIONAL BREAKDOWN OF ANDA APPROVALS IN 2022
FIGURE 29 ANDA APPROVALS IN 2022, BY DOSAGE FORM
6 PHARMACEUTICAL CONTRACT MANUFACTURING MARKET, BY SERVICE (Page No. - 81)
6.1 INTRODUCTION
TABLE 15 PHARMACEUTICAL CONTRACT MANUFACTURING INDUSTRY, BY SERVICE, 2021–2028 (USD BILLION)
6.2 PHARMACEUTICAL MANUFACTURING SERVICES
TABLE 16 PHARMACEUTICAL MANUFACTURING SERVICES MARKET, BY TYPE, 2021–2028 (USD BILLION)
TABLE 17 PHARMACEUTICAL MANUFACTURING SERVICES MARKET, BY REGION, 2021–2028 (USD BILLION)
TABLE 18 NORTH AMERICA: PHARMACEUTICAL MANUFACTURING SERVICES MARKET, BY COUNTRY, 2021–2028 (USD BILLION)
TABLE 19 EUROPE: PHARMACEUTICAL MANUFACTURING SERVICES MARKET, BY COUNTRY, 2021–2028 (USD BILLION)
TABLE 20 ASIA PACIFIC: PHARMACEUTICAL MANUFACTURING SERVICES MARKET, BY COUNTRY, 2021–2028 (USD BILLION)
TABLE 21 LATIN AMERICA: PHARMACEUTICAL MANUFACTURING SERVICES MARKET, BY COUNTRY, 2021–2028 (USD BILLION)
6.2.1 PHARMACEUTICAL API MANUFACTURING SERVICES
6.2.1.1 Need to focus on core areas to drive pharma companies to outsource API manufacturing
TABLE 22 PHARMACEUTICAL API MANUFACTURING SERVICES MARKET, BY REGION, 2021–2028 (USD BILLION)
TABLE 23 NORTH AMERICA: PHARMACEUTICAL API MANUFACTURING SERVICES MARKET, BY COUNTRY, 2021–2028 (USD BILLION)
TABLE 24 EUROPE: PHARMACEUTICAL API MANUFACTURING SERVICES MARKET, BY COUNTRY, 2021–2028 (USD BILLION)
TABLE 25 ASIA PACIFIC: PHARMACEUTICAL API MANUFACTURING SERVICES MARKET, BY COUNTRY, 2021–2028 (USD BILLION)
TABLE 26 LATIN AMERICA: PHARMACEUTICAL API MANUFACTURING SERVICES MARKET, BY COUNTRY, 2021–2028 (USD BILLION)
6.2.2 PHARMACEUTICAL FDF MANUFACTURING SERVICES
TABLE 27 PHARMACEUTICAL FDF MANUFACTURING SERVICES MARKET, BY TYPE, 2021–2028 (USD BILLION)
TABLE 28 PHARMACEUTICAL FDF MANUFACTURING SERVICES MARKET, BY REGION, 2021–2028 (USD BILLION)
TABLE 29 NORTH AMERICA: PHARMACEUTICAL FDF MANUFACTURING SERVICES MARKET, BY COUNTRY, 2021–2028 (USD BILLION)
TABLE 30 EUROPE: PHARMACEUTICAL FDF MANUFACTURING SERVICES MARKET, BY COUNTRY, 2021–2028 (USD BILLION)
TABLE 31 ASIA PACIFIC: PHARMACEUTICAL FDF MANUFACTURING SERVICES MARKET, BY COUNTRY, 2021–2028 (USD BILLION)
TABLE 32 LATIN AMERICA: PHARMACEUTICAL FDF MANUFACTURING SERVICES MARKET, BY COUNTRY, 2021–2028 (USD BILLION)
6.2.2.1 Parenteral/Injectable manufacturing services
6.2.2.1.1 Increasing investments in drug development to support market growth
TABLE 33 PARENTERAL/INJECTABLE MANUFACTURING SERVICES MARKET, BY REGION, 2021–2028 (USD BILLION)
TABLE 34 NORTH AMERICA: PARENTERAL/INJECTABLE MANUFACTURING SERVICES MARKET, BY COUNTRY, 2021–2028 (USD BILLION)
TABLE 35 EUROPE: PARENTERAL/INJECTABLE MANUFACTURING SERVICES MARKET, BY COUNTRY, 2021–2028 (USD BILLION)
TABLE 36 ASIA PACIFIC: PARENTERAL/INJECTABLE MANUFACTURING SERVICES MARKET, BY COUNTRY, 2021–2028 (USD BILLION)
TABLE 37 LATIN AMERICA: PARENTERAL/INJECTABLE MANUFACTURING SERVICES MARKET, BY COUNTRY, 2021–2028 (USD BILLION)
6.2.2.2 Tablet manufacturing services
6.2.2.2.1 Growing production capacity for tablet manufacturing in emerging markets to support growth
TABLE 38 TABLET MANUFACTURING SERVICES MARKET, BY REGION, 2021–2028 (USD BILLION)
TABLE 39 NORTH AMERICA: TABLET MANUFACTURING SERVICES MARKET, BY COUNTRY, 2021–2028 (USD BILLION)
TABLE 40 EUROPE: TABLET MANUFACTURING SERVICES MARKET, BY COUNTRY, 2021–2028 (USD BILLION)
TABLE 41 ASIA PACIFIC: TABLET MANUFACTURING SERVICES MARKET, BY COUNTRY, 2021–2028 (USD BILLION)
TABLE 42 LATIN AMERICA: TABLET MANUFACTURING SERVICES MARKET, BY COUNTRY, 2021–2028 (USD BILLION)
6.2.2.3 Capsule manufacturing services
6.2.2.3.1 Popularity of capsules to ensure demand for contract manufacturing
TABLE 43 CAPSULE MANUFACTURING SERVICES MARKET, BY REGION, 2021–2028 (USD BILLION)
TABLE 44 NORTH AMERICA: CAPSULE MANUFACTURING SERVICES MARKET, BY COUNTRY, 2021–2028 (USD BILLION)
TABLE 45 EUROPE: CAPSULE MANUFACTURING SERVICES MARKET, BY COUNTRY, 2021–2028 (USD BILLION)
TABLE 46 ASIA PACIFIC: CAPSULE MANUFACTURING SERVICES MARKET, BY COUNTRY, 2021–2028 (USD BILLION)
TABLE 47 LATIN AMERICA: CAPSULE MANUFACTURING SERVICES MARKET, BY COUNTRY, 2021–2028 (USD BILLION)
6.2.2.4 Oral liquid manufacturing services
6.2.2.4.1 Complexities in handling liquids to promote outsourcing
TABLE 48 ORAL LIQUID MANUFACTURING SERVICES MARKET, BY REGION, 2021–2028 (USD BILLION)
TABLE 49 NORTH AMERICA: ORAL LIQUID MANUFACTURING SERVICES MARKET, BY COUNTRY, 2021–2028 (USD BILLION)
TABLE 50 EUROPE: ORAL LIQUID MANUFACTURING SERVICES MARKET, BY COUNTRY, 2021–2028 (USD BILLION)
TABLE 51 ASIA PACIFIC: ORAL LIQUID MANUFACTURING SERVICES MARKET, BY COUNTRY, 2021–2028 (USD BILLION)
TABLE 52 LATIN AMERICA: ORAL LIQUID MANUFACTURING SERVICES MARKET, BY COUNTRY, 2021–2028 (USD BILLION)
6.2.2.5 Semi-solid manufacturing services
6.2.2.5.1 Need for specialized facilities to boost outsourcing of semi-solid manufacturing
TABLE 53 SEMI-SOLID MANUFACTURING SERVICES MARKET, BY REGION, 2021–2028 (USD BILLION)
TABLE 54 NORTH AMERICA: SEMI-SOLID MANUFACTURING SERVICES MARKET, BY COUNTRY, 2021–2028 (USD BILLION)
TABLE 55 EUROPE: SEMI-SOLID MANUFACTURING SERVICES MARKET, BY COUNTRY, 2021–2028 (USD BILLION)
TABLE 56 ASIA PACIFIC: SEMI-SOLID MANUFACTURING SERVICES MARKET, BY COUNTRY, 2021–2028 (USD BILLION)
TABLE 57 LATIN AMERICA: SEMI-SOLID MANUFACTURING SERVICES MARKET, BY COUNTRY, 2021–2028 (USD BILLION)
6.2.2.6 Other FDF manufacturing services
TABLE 58 OTHER FDF MANUFACTURING SERVICES MARKET, BY REGION, 2021–2028 (USD BILLION)
TABLE 59 NORTH AMERICA: OTHER FDF MANUFACTURING SERVICES MARKET, BY COUNTRY, 2021–2028 (USD BILLION)
TABLE 60 EUROPE: OTHER FDF MANUFACTURING SERVICES MARKET, BY COUNTRY, 2021–2028 (USD BILLION)
TABLE 61 ASIA PACIFIC: OTHER FDF MANUFACTURING SERVICES MARKET, BY COUNTRY, 2021–2028 (USD BILLION)
TABLE 62 LATIN AMERICA: OTHER FDF MANUFACTURING SERVICES MARKET, BY COUNTRY, 2021–2028 (USD BILLION)
6.3 DRUG DEVELOPMENT SERVICES
6.3.1 HIGH COST OF DEVELOPMENT TO BOOST OUTSOURCING
TABLE 63 DRUG DEVELOPMENT SERVICES MARKET, BY REGION, 2021–2028 (USD BILLION)
TABLE 64 NORTH AMERICA: DRUG DEVELOPMENT SERVICES MARKET, BY COUNTRY, 2021–2028 (USD BILLION)
TABLE 65 EUROPE: DRUG DEVELOPMENT SERVICES MARKET, BY COUNTRY, 2021–2028 (USD BILLION)
TABLE 66 ASIA PACIFIC: DRUG DEVELOPMENT SERVICES MARKET, BY COUNTRY, 2021–2028 (USD BILLION)
TABLE 67 LATIN AMERICA: DRUG DEVELOPMENT SERVICES MARKET, BY COUNTRY, 2021–2028 (USD BILLION)
6.4 BIOLOGIC MANUFACTURING SERVICES
TABLE 68 BIOLOGIC MANUFACTURING SERVICES MARKET, BY TYPE, 2021–2028 (USD BILLION)
TABLE 69 BIOLOGIC MANUFACTURING SERVICES MARKET, BY REGION, 2021–2028 (USD BILLION)
TABLE 70 NORTH AMERICA: BIOLOGIC MANUFACTURING SERVICES MARKET, BY COUNTRY, 2021–2028 (USD BILLION)
TABLE 71 EUROPE: BIOLOGIC MANUFACTURING SERVICES MARKET, BY COUNTRY, 2021–2028 (USD BILLION)
TABLE 72 ASIA PACIFIC: BIOLOGIC MANUFACTURING SERVICES MARKET, BY COUNTRY, 2021–2028 (USD BILLION)
TABLE 73 LATIN AMERICA: BIOLOGIC MANUFACTURING SERVICES MARKET, BY COUNTRY, 2021–2028 (USD BILLION)
6.4.1 BIOLOGIC API MANUFACTURING SERVICES
6.4.1.1 Rising interest in biologics to ensure growth of nascent contract manufacturing sector
TABLE 74 BIOLOGIC API MANUFACTURING SERVICES MARKET, BY REGION, 2021–2028 (USD BILLION)
TABLE 75 NORTH AMERICA: BIOLOGIC API MANUFACTURING SERVICES MARKET, BY COUNTRY, 2021–2028 (USD BILLION)
TABLE 76 EUROPE: BIOLOGIC API MANUFACTURING SERVICES MARKET, BY COUNTRY, 2021–2028 (USD BILLION)
TABLE 77 ASIA PACIFIC: BIOLOGIC API MANUFACTURING SERVICES MARKET, BY COUNTRY, 2021–2028 (USD BILLION)
TABLE 78 LATIN AMERICA: BIOLOGIC API MANUFACTURING SERVICES MARKET, BY COUNTRY, 2021–2028 (USD BILLION)
6.4.2 BIOLOGIC FDF MANUFACTURING SERVICES
6.4.2.1 Growing R&D costs and process complexity to favor contract manufacturing
TABLE 79 BIOLOGIC FDF MANUFACTURING SERVICES MARKET, BY REGION, 2021–2028 (USD BILLION)
TABLE 80 NORTH AMERICA: BIOLOGIC FDF MANUFACTURING SERVICES MARKET, BY COUNTRY, 2021–2028 (USD BILLION)
TABLE 81 EUROPE: BIOLOGIC FDF MANUFACTURING SERVICES MARKET, BY COUNTRY, 2021–2028 (USD BILLION)
TABLE 82 ASIA PACIFIC: BIOLOGIC FDF MANUFACTURING SERVICES MARKET, BY COUNTRY, 2021–2028 (USD BILLION)
TABLE 83 LATIN AMERICA: BIOLOGIC FDF MANUFACTURING SERVICES MARKET, BY COUNTRY, 2021–2028 (USD BILLION)
7 PHARMACEUTICAL CONTRACT MANUFACTURING MARKET, BY END USER (Page No. - )
7.1 INTRODUCTION
TABLE 84 PHARMACEUTICAL CONTRACT MANUFACTURING INDUSTRY, BY END USER, 2021–2028 (USD BILLION)
7.2 BIG PHARMACEUTICAL COMPANIES
7.2.1 EMERGENCE OF NEW MEDICINES AND THERAPIES TO CONTRIBUTE TO MARKET GROWTH
TABLE 85 MARKET FOR BIG PHARMACEUTICAL COMPANIES, BY COUNTRY, 2021–2028 (USD BILLION)
TABLE 86 NORTH AMERICA: MARKET FOR BIG PHARMACEUTICAL COMPANIES, BY COUNTRY, 2021–2028 (USD BILLION)
TABLE 87 EUROPE: MARKET FOR BIG PHARMACEUTICAL COMPANIES, BY COUNTRY, 2021–2028 (USD BILLION)
TABLE 88 ASIA PACIFIC: MARKET FOR BIG PHARMACEUTICAL COMPANIES, BY COUNTRY, 2021–2028 (USD BILLION)
TABLE 89 LATIN AMERICA: MARKET FOR BIG PHARMACEUTICAL COMPANIES, BY COUNTRY, 2021–2028 (USD BILLION)
7.3 SMALL & MEDIUM-SIZED PHARMACEUTICAL COMPANIES
7.3.1 GROWING DEVELOPMENT OF BIOLOGICS AND HIGH PRICING PRESSURE TO BOOST MARKET
TABLE 90 MARKET FOR SMALL & MEDIUM-SIZED PHARMACEUTICAL COMPANIES, BY REGION, 2021–2028 (USD BILLION)
TABLE 91 NORTH AMERICA: MARKET FOR SMALL & MEDIUM-SIZED PHARMACEUTICAL COMPANIES, BY COUNTRY, 2021–2028 (USD BILLION)
TABLE 92 EUROPE: MARKET FOR SMALL & MEDIUM-SIZED PHARMACEUTICAL COMPANIES, BY COUNTRY, 2021–2028 (USD BILLION)
TABLE 93 ASIA PACIFIC: MARKET FOR SMALL & MEDIUM-SIZED PHARMACEUTICAL COMPANIES, BY COUNTRY, 2021–2028 (USD BILLION)
TABLE 94 LATIN AMERICA: MARKET FOR SMALL & MEDIUM-SIZED PHARMACEUTICAL COMPANIES, BY COUNTRY, 2021–2028 (USD BILLION)
7.4 GENERIC PHARMACEUTICAL COMPANIES
7.4.1 RISING DEMAND FOR GENERICS TO PROPEL MARKET
TABLE 95 MARKET FOR GENERIC PHARMACEUTICAL COMPANIES, BY REGION, 2021–2028 (USD BILLION)
TABLE 96 NORTH AMERICA: MARKET FOR GENERIC PHARMACEUTICAL COMPANIES, BY COUNTRY, 2021–2028 (USD BILLION)
TABLE 97 EUROPE: MARKET FOR GENERIC PHARMACEUTICAL COMPANIES, BY COUNTRY, 2021–2028 (USD BILLION)
TABLE 98 ASIA PACIFIC: MARKET FOR GENERIC PHARMACEUTICAL COMPANIES, BY COUNTRY, 2021–2028 (USD BILLION)
TABLE 99 LATIN AMERICA: MARKET FOR GENERIC PHARMACEUTICAL COMPANIES, BY COUNTRY, 2021–2028 (USD BILLION)
7.5 OTHER END USERS
TABLE 100 MARKET FOR OTHER END USERS, BY REGION, 2021–2028 (USD BILLION)
TABLE 101 NORTH AMERICA: MARKET FOR OTHER END USERS, BY COUNTRY, 2021–2028 (USD BILLION)
TABLE 102 EUROPE: MARKET FOR OTHER END USERS, BY COUNTRY, 2021–2028 (USD BILLION)
TABLE 103 ASIA PACIFIC: MARKET FOR OTHER END USERS, BY COUNTRY, 2021–2028 (USD BILLION)
TABLE 104 LATIN AMERICA: MARKET FOR OTHER END USERS, BY COUNTRY, 2021–2028 (USD BILLION)
8 PHARMACEUTICAL CONTRACT MANUFACTURING MARKET, BY REGION (Page No. - 133)
8.1 INTRODUCTION
TABLE 105 PHARMACEUTICAL CONTRACT MANUFACTURING INDUSTRY, BY REGION, 2021–2028 (USD BILLION)
8.2 NORTH AMERICA
FIGURE 30 NORTH AMERICA: PHARMACEUTICAL CONTRACT MANUFACTURING MARKET SNAPSHOT
TABLE 106 NORTH AMERICA: MARKET, BY COUNTRY, 2021–2028 (USD BILLION)
TABLE 107 NORTH AMERICA: MARKET, BY SERVICE, 2021–2028 (USD BILLION)
TABLE 108 NORTH AMERICA: PHARMACEUTICAL MANUFACTURING SERVICES MARKET, BY TYPE, 2021–2028 (USD BILLION)
TABLE 109 NORTH AMERICA: PHARMACEUTICAL FDF MANUFACTURING SERVICES MARKET, BY TYPE, 2021–2028 (USD BILLION)
TABLE 110 NORTH AMERICA: BIOLOGIC MANUFACTURING SERVICES MARKET, BY TYPE, 2021–2028 (USD BILLION)
TABLE 111 NORTH AMERICA: PHARMACEUTICAL CONTRACT MANUFACTURING INDUSTRY, BY END USER, 2021–2028 (USD BILLION)
8.2.1 US
8.2.1.1 US to dominate North American market
TABLE 112 US: MARKET, BY SERVICE, 2021–2028 (USD BILLION)
TABLE 113 US: PHARMACEUTICAL MANUFACTURING SERVICES MARKET, BY TYPE, 2021–2028 (USD BILLION)
TABLE 114 US: PHARMACEUTICAL FDF MANUFACTURING SERVICES MARKET, BY TYPE, 2021–2028 (USD BILLION)
TABLE 115 US: BIOLOGIC MANUFACTURING SERVICES MARKET, BY TYPE, 2021–2028 (USD BILLION)
TABLE 116 US: MARKET, BY END USER, 2021–2028 (USD BILLION)
8.2.2 CANADA
8.2.2.1 Rising government funding and support to propel market
TABLE 117 CANADA: PHARMACEUTICAL CONTRACT MANUFACTURING MARKET, BY SERVICE, 2021–2028 (USD BILLION)
TABLE 118 CANADA: PHARMACEUTICAL MANUFACTURING SERVICES MARKET, BY TYPE, 2021–2028 (USD BILLION)
TABLE 119 CANADA: PHARMACEUTICAL FDF MANUFACTURING SERVICES MARKET, BY TYPE, 2021–2028 (USD BILLION)
TABLE 120 CANADA: BIOLOGIC MANUFACTURING SERVICES MARKET, BY TYPE, 2021–2028 (USD BILLION)
TABLE 121 CANADA: PHARMACEUTICAL CONTRACT MANUFACTURING INDUSTRY, BY END USER, 2021–2028 (USD BILLION)
8.2.3 NORTH AMERICA: RECESSION IMPACT
8.3 EUROPE
TABLE 122 EUROPE: MARKET, BY COUNTRY, 2021–2028 (USD BILLION)
TABLE 123 EUROPE: MARKET, BY SERVICE, 2021–2028 (USD BILLION)
TABLE 124 EUROPE: PHARMACEUTICAL MANUFACTURING SERVICES MARKET, BY TYPE, 2021–2028 (USD BILLION)
TABLE 125 EUROPE: PHARMACEUTICAL FDF MANUFACTURING SERVICES MARKET, BY TYPE, 2021–2028 (USD BILLION)
TABLE 126 EUROPE: BIOLOGIC MANUFACTURING SERVICES MARKET, BY TYPE, 2021–2028 (USD BILLION)
TABLE 127 EUROPE: MARKET, BY END USER, 2021–2028 (USD BILLION)
8.3.1 GERMANY
8.3.1.1 Germany to hold largest share throughout forecast period
TABLE 128 GERMANY: PHARMACEUTICAL CONTRACT MANUFACTURING MARKET, BY SERVICE, 2021–2028 (USD BILLION)
TABLE 129 GERMANY: PHARMACEUTICAL MANUFACTURING SERVICES MARKET, BY TYPE, 2021–2028 (USD BILLION)
TABLE 130 GERMANY: PHARMACEUTICAL FDF MANUFACTURING SERVICES MARKET, BY TYPE, 2021–2028 (USD BILLION)
TABLE 131 GERMANY: BIOLOGIC MANUFACTURING SERVICES MARKET, BY TYPE, 2021–2028 (USD BILLION)
TABLE 132 GERMANY: PHARMACEUTICAL CONTRACT MANUFACTURING INDUSTRY, BY END USER, 2021–2028 (USD BILLION)
8.3.2 UK
8.3.2.1 Rising investments in drug development to favor market growth
TABLE 133 UK: PHARMACEUTICAL CONTRACT MANUFACTURING MARKET, BY SERVICE, 2021–2028 (USD BILLION)
TABLE 134 UK: PHARMACEUTICAL MANUFACTURING SERVICES MARKET, BY TYPE, 2021–2028 (USD BILLION)
TABLE 135 UK: PHARMACEUTICAL FDF MANUFACTURING SERVICES MARKET, BY TYPE, 2021–2028 (USD BILLION)
TABLE 136 UK: BIOLOGIC MANUFACTURING SERVICES MARKET, BY TYPE, 2021–2028 (USD BILLION)
TABLE 137 UK: MARKET, BY END USER, 2021–2028 (USD BILLION)
8.3.3 FRANCE
8.3.3.1 Growing generics segment, favorable government policies, and growing clinical trials to drive market
TABLE 138 FRANCE: MARKET, BY SERVICE, 2021–2028 (USD BILLION)
TABLE 139 FRANCE: PHARMACEUTICAL MANUFACTURING SERVICES MARKET, BY TYPE, 2021–2028 (USD BILLION)
TABLE 140 FRANCE: PHARMACEUTICAL FDF MANUFACTURING SERVICES MARKET, BY TYPE, 2021–2028 (USD BILLION)
TABLE 141 FRANCE: BIOLOGIC MANUFACTURING SERVICES MARKET, BY TYPE, 2021–2028 (USD BILLION)
TABLE 142 FRANCE: PHARMACEUTICAL CONTRACT MANUFACTURING INDUSTRY, BY END USER, 2021–2028 (USD BILLION)
8.3.4 ITALY
8.3.4.1 Rising commercial drug development pipeline in Europe to favor market growth
TABLE 143 ITALY: PHARMACEUTICAL CONTRACT MANUFACTURING MARKET, BY SERVICE, 2021–2028 (USD BILLION)
TABLE 144 ITALY: PHARMACEUTICAL MANUFACTURING SERVICES MARKET, BY TYPE, 2021–2028 (USD BILLION)
TABLE 145 ITALY: PHARMACEUTICAL FDF MANUFACTURING SERVICES MARKET, BY TYPE, 2021–2028 (USD BILLION)
TABLE 146 ITALY: BIOLOGIC MANUFACTURING SERVICES MARKET, BY TYPE, 2021–2028 (USD BILLION)
TABLE 147 ITALY: MARKET, BY END USER, 2021–2028 (USD BILLION)
8.3.5 SWITZERLAND
8.3.5.1 Growing pharmaceutical industry to support growth
TABLE 148 SWITZERLAND: PHARMACEUTICAL CONTRACT MANUFACTURING MARKET, BY SERVICE, 2021–2028 (USD BILLION)
TABLE 149 SWITZERLAND: PHARMACEUTICAL MANUFACTURING SERVICES MARKET, BY TYPE, 2021–2028 (USD BILLION)
TABLE 150 SWITZERLAND: PHARMACEUTICAL FDF MANUFACTURING SERVICES MARKET, BY TYPE, 2021–2028 (USD BILLION)
TABLE 151 SWITZERLAND: BIOLOGIC MANUFACTURING SERVICES MARKET, BY TYPE, 2021–2028 (USD BILLION)
TABLE 152 SWITZERLAND: PHARMACEUTICAL CONTRACT MANUFACTURING INDUSTRY, BY END USER, 2021–2028 (USD BILLION)
8.3.6 POLAND
8.3.6.1 Increasing support for life science R&D to propel market
TABLE 153 POLAND: MARKET, BY SERVICE, 2021–2028 (USD BILLION)
TABLE 154 POLAND: PHARMACEUTICAL MANUFACTURING SERVICES MARKET, BY TYPE, 2021–2028 (USD BILLION)
TABLE 155 POLAND: PHARMACEUTICAL FDF MANUFACTURING SERVICES MARKET, BY TYPE, 2021–2028 (USD BILLION)
TABLE 156 POLAND: BIOLOGIC MANUFACTURING SERVICES MARKET, BY TYPE, 2021–2028 (USD BILLION)
TABLE 157 POLAND: MARKET, BY END USER, 2021–2028 (USD BILLION)
8.3.7 SPAIN
8.3.7.1 Rising R&D expenditure to boost market
TABLE 158 SPAIN: PHARMACEUTICAL CONTRACT MANUFACTURING MARKET, BY SERVICE, 2021–2028 (USD BILLION)
TABLE 159 SPAIN: PHARMACEUTICAL MANUFACTURING SERVICES MARKET, BY TYPE, 2021–2028 (USD BILLION)
TABLE 160 SPAIN: PHARMACEUTICAL FDF MANUFACTURING SERVICES MARKET, BY TYPE, 2021–2028 (USD BILLION)
TABLE 161 SPAIN: BIOLOGIC MANUFACTURING SERVICES MARKET, BY TYPE, 2021–2028 (USD BILLION)
TABLE 162 SPAIN: PHARMACEUTICAL CONTRACT MANUFACTURING INDUSTRY, BY END USER, 2021–2028 (USD BILLION)
8.3.8 REST OF EUROPE
TABLE 163 REST OF EUROPE: PHARMACEUTICAL CONTRACT MANUFACTURING MARKET, BY SERVICE, 2021–2028 (USD BILLION)
TABLE 164 REST OF EUROPE: PHARMACEUTICAL MANUFACTURING SERVICES MARKET, BY TYPE, 2021–2028 (USD BILLION)
TABLE 165 REST OF EUROPE: PHARMACEUTICAL FDF MANUFACTURING SERVICES MARKET, BY TYPE, 2021–2028 (USD BILLION)
TABLE 166 REST OF EUROPE: BIOLOGIC MANUFACTURING SERVICES MARKET, BY TYPE, 2021–2028 (USD BILLION)
TABLE 167 REST OF EUROPE: MARKET, BY END USER, 2021–2028 (USD BILLION)
8.3.9 EUROPE: RECESSION IMPACT
8.4 ASIA PACIFIC
FIGURE 31 ASIA PACIFIC: MARKET SNAPSHOT
TABLE 168 ASIA PACIFIC: MARKET, BY COUNTRY, 2021–2028 (USD BILLION)
TABLE 169 ASIA PACIFIC: MARKET, BY SERVICE, 2021–2028 (USD BILLION)
TABLE 170 ASIA PACIFIC: PHARMACEUTICAL MANUFACTURING SERVICES MARKET, BY TYPE, 2021–2028 (USD BILLION)
TABLE 171 ASIA PACIFIC: PHARMACEUTICAL FDF MANUFACTURING SERVICES MARKET, BY TYPE, 2021–2028 (USD BILLION)
TABLE 172 ASIA PACIFIC: BIOLOGIC MANUFACTURING SERVICES MARKET, BY TYPE, 2021–2028 (USD BILLION)
TABLE 173 ASIA PACIFIC: PHARMACEUTICAL CONTRACT MANUFACTURING INDUSTRY, BY END USER, 2021–2028 (USD BILLION)
8.4.1 CHINA
8.4.1.1 China to hold largest share of Asia Pacific market
TABLE 174 CHINA: PHARMACEUTICAL CONTRACT MANUFACTURING MARKET, BY SERVICE, 2021–2028 (USD BILLION)
TABLE 175 CHINA: PHARMACEUTICAL MANUFACTURING SERVICES MARKET, BY TYPE, 2021–2028 (USD BILLION)
TABLE 176 CHINA: PHARMACEUTICAL FDF MANUFACTURING SERVICES MARKET, BY TYPE, 2021–2028 (USD BILLION)
TABLE 177 CHINA: BIOLOGIC MANUFACTURING SERVICES MARKET, BY TYPE, 2021–2028 (USD BILLION)
TABLE 178 CHINA: MARKET, BY END USER, 2021–2028 (USD BILLION)
8.4.2 INDIA
8.4.2.1 Increasing pharma R&D activities and government funding for biotechnology to support market growth
TABLE 179 INDIA: PHARMACEUTICAL CONTRACT MANUFACTURING MARKET, BY SERVICE, 2021–2028 (USD BILLION)
TABLE 180 INDIA: PHARMACEUTICAL MANUFACTURING SERVICES MARKET, BY TYPE, 2021–2028 (USD BILLION)
TABLE 181 INDIA: PHARMACEUTICAL FDF MANUFACTURING SERVICES MARKET, BY TYPE, 2021–2028 (USD BILLION)
TABLE 182 INDIA: BIOLOGIC MANUFACTURING SERVICES MARKET, BY TYPE, 2021–2028 (USD BILLION)
TABLE 183 INDIA: PHARMACEUTICAL CONTRACT MANUFACTURING INDUSTRY, BY END USER, 2021–2028 (USD BILLION)
8.4.3 JAPAN
8.4.3.1 Growing generics demand and government initiatives to drive demand for contract manufacturing
TABLE 184 JAPAN: MARKET, BY SERVICE, 2021–2028 (USD BILLION)
TABLE 185 JAPAN: PHARMACEUTICAL MANUFACTURING SERVICES MARKET, BY TYPE, 2021–2028 (USD BILLION)
TABLE 186 JAPAN: PHARMACEUTICAL FDF MANUFACTURING SERVICES MARKET, BY TYPE, 2021–2028 (USD BILLION)
TABLE 187 JAPAN: BIOLOGIC MANUFACTURING SERVICES MARKET, BY TYPE, 2021–2028 (USD BILLION)
TABLE 188 JAPAN: MARKET, BY END USER, 2021–2028 (USD BILLION)
8.4.4 SOUTH KOREA
8.4.4.1 Government initiatives and growing R&D activities for drug development to drive market growth
TABLE 189 SOUTH KOREA: PHARMACEUTICAL CONTRACT MANUFACTURING MARKET, BY SERVICE, 2021–2028 (USD BILLION)
TABLE 190 SOUTH KOREA: PHARMACEUTICAL MANUFACTURING SERVICES MARKET, BY TYPE, 2021–2028 (USD BILLION)
TABLE 191 SOUTH KOREA: PHARMACEUTICAL FDF MANUFACTURING SERVICES MARKET, BY TYPE, 2021–2028 (USD BILLION)
TABLE 192 SOUTH KOREA: BIOLOGIC MANUFACTURING SERVICES MARKET, BY TYPE, 2021–2028 (USD BILLION)
TABLE 193 SOUTH KOREA: PHARMACEUTICAL CONTRACT MANUFACTURING INDUSTRY, BY END USER, 2021–2028 (USD BILLION)
8.4.5 REST OF ASIA PACIFIC
TABLE 194 REST OF ASIA PACIFIC: PHARMACEUTICAL CONTRACT MANUFACTURING MARKET, BY SERVICE, 2021–2028 (USD BILLION)
TABLE 195 REST OF ASIA PACIFIC: PHARMACEUTICAL MANUFACTURING SERVICES MARKET, BY TYPE, 2021–2028 (USD BILLION)
TABLE 196 REST OF ASIA PACIFIC: PHARMACEUTICAL FDF MANUFACTURING SERVICES MARKET, BY TYPE, 2021–2028 (USD BILLION)
TABLE 197 REST OF ASIA PACIFIC: BIOLOGIC MANUFACTURING SERVICES MARKET, BY TYPE, 2021–2028 (USD BILLION)
TABLE 198 REST OF ASIA PACIFIC: MARKET, BY END USER, 2021–2028 (USD BILLION)
8.4.6 ASIA PACIFIC: RECESSION IMPACT
8.5 LATIN AMERICA
TABLE 199 LATIN AMERICA: MARKET, BY COUNTRY, 2021–2028 (USD BILLION)
TABLE 200 LATIN AMERICA: MARKET, BY SERVICE, 2021–2028 (USD BILLION)
TABLE 201 LATIN AMERICA: PHARMACEUTICAL MANUFACTURING SERVICES MARKET, BY TYPE, 2021–2028 (USD BILLION)
TABLE 202 LATIN AMERICA: PHARMACEUTICAL FDF MANUFACTURING SERVICES MARKET, BY TYPE, 2021–2028 (USD BILLION)
TABLE 203 LATIN AMERICA: BIOLOGIC MANUFACTURING SERVICES MARKET, BY TYPE, 2021–2028 (USD BILLION)
TABLE 204 LATIN AMERICA: PHARMACEUTICAL CONTRACT MANUFACTURING INDUSTRY, BY END USER, 2021–2028 (USD BILLION)
8.5.1 BRAZIL
8.5.1.1 Growing pharmaceutical industry to drive market
TABLE 205 BRAZIL: PHARMACEUTICAL CONTRACT MANUFACTURING MARKET, BY SERVICE, 2021–2028 (USD BILLION)
TABLE 206 BRAZIL: PHARMACEUTICAL MANUFACTURING SERVICES MARKET, BY TYPE, 2021–2028 (USD BILLION)
TABLE 207 BRAZIL: PHARMACEUTICAL FDF MANUFACTURING SERVICES MARKET, BY TYPE, 2021–2028 (USD BILLION)
TABLE 208 BRAZIL: BIOLOGIC MANUFACTURING SERVICES MARKET, BY TYPE, 2021–2028 (USD BILLION)
TABLE 209 BRAZIL: MARKET, BY END USER, 2021–2028 (USD BILLION)
8.5.2 REST OF LATIN AMERICA
TABLE 210 REST OF LATIN AMERICA: PHARMACEUTICAL CONTRACT MANUFACTURING MARKET, BY SERVICE, 2021–2028 (USD BILLION)
TABLE 211 REST OF LATIN AMERICA: PHARMACEUTICAL MANUFACTURING SERVICES MARKET, BY TYPE, 2021–2028 (USD BILLION)
TABLE 212 REST OF LATIN AMERICA: PHARMACEUTICAL FDF MANUFACTURING SERVICES MARKET, BY TYPE, 2021–2028 (USD BILLION)
TABLE 213 REST OF LATIN AMERICA: BIOLOGIC MANUFACTURING SERVICES MARKET, BY TYPE, 2021–2028 (USD BILLION)
TABLE 214 REST OF LATIN AMERICA: PHARMACEUTICAL CONTRACT MANUFACTURING INDUSTRY, BY END USER, 2021–2028 (USD BILLION)
8.5.3 LATIN AMERICA: RECESSION IMPACT
8.6 MIDDLE EAST & AFRICA
8.6.1 UAE AND SAUDI ARABIA TO SHOW SIGNIFICANT GROWTH
TABLE 215 MIDDLE EAST & AFRICA: MARKET, BY SERVICE, 2021–2028 (USD BILLION)
TABLE 216 MIDDLE EAST & AFRICA: PHARMACEUTICAL MANUFACTURING SERVICES MARKET, BY TYPE, 2021–2028 (USD BILLION)
TABLE 217 MIDDLE EAST & AFRICA: PHARMACEUTICAL FDF MANUFACTURING SERVICES MARKET, BY TYPE, 2021–2028 (USD BILLION)
TABLE 218 MIDDLE EAST & AFRICA: BIOLOGIC MANUFACTURING SERVICES MARKET, BY TYPE, 2021–2028 (USD BILLION)
TABLE 219 MIDDLE EAST & AFRICA: MARKET, BY END USER, 2021–2028 (USD BILLION)
8.6.2 MIDDLE EAST & AFRICA: RECESSION IMPACT
9 COMPETITIVE LANDSCAPE (Page No. - 204)
9.1 OVERVIEW
9.2 KEY PLAYER STRATEGIES
TABLE 220 KEY STRATEGIES ADOPTED BY PLAYERS IN PHARMACEUTICAL CONTRACT MANUFACTURING MARKET, 2020–2023
9.3 REVENUE SHARE ANALYSIS
FIGURE 32 REVENUE SHARE ANALYSIS OF KEY PLAYERS, 2020–2022
9.4 MARKET SHARE ANALYSIS
FIGURE 33 PHARMACEUTICAL CONTRACT MANUFACTURING INDUSTRY SHARE ANALYSIS, BY KEY PLAYER, 2022
TABLE 221 PHARMACEUTICAL CONTRACT MANUFACTURING INDUSTRY: DEGREE OF COMPETITION
9.5 COMPANY EVALUATION QUADRANT FOR KEY PLAYERS, 2022
9.5.1 STARS
9.5.2 EMERGING LEADERS
9.5.3 PERVASIVE PLAYERS
9.5.4 PARTICIPANTS
FIGURE 34 PHARMACEUTICAL CONTRACT MANUFACTURING INDUSTRY: COMPANY EVALUATION QUADRANT, 2022
9.6 COMPETITIVE BENCHMARKING OF TOP 25 PLAYERS
9.6.1 SERVICE FOOTPRINT OF COMPANIES (25 COMPANIES)
TABLE 222 SERVICE FOOTPRINT ANALYSIS OF KEY PLAYERS IN MARKET
9.6.2 END-USER FOOTPRINT OF COMPANIES (25 COMPANIES)
TABLE 223 END-USER FOOTPRINT ANALYSIS OF KEY PLAYERS IN MARKET
9.6.3 REGIONAL FOOTPRINT OF COMPANIES (25 COMPANIES)
TABLE 224 REGIONAL FOOTPRINT ANALYSIS OF KEY PLAYERS IN MARKET
9.7 COMPANY EVALUATION QUADRANT FOR START-UPS/SMES (2022)
9.7.1 PROGRESSIVE COMPANIES
9.7.2 STARTING BLOCKS
9.7.3 RESPONSIVE COMPANIES
9.7.4 DYNAMIC COMPANIES
FIGURE 35 PHARMACEUTICAL CONTRACT MANUFACTURING INDUSTRY: COMPANY EVALUATION QUADRANT FOR STARTUPS/SMES, 2022
9.8 COMPETITIVE BENCHMARKING OF START-UPS/SMES
TABLE 225 PHARMACEUTICAL CONTRACT MANUFACTURING INDUSTRY: DETAILED LIST OF KEY START-UP/SME PLAYERS
TABLE 226 PHARMACEUTICAL CONTRACT MANUFACTURING INDUSTRY: COMPETITIVE BENCHMARKING OF START-UP/SME PLAYERS
9.9 COMPETITIVE SCENARIO AND TRENDS
9.9.1 SERVICE LAUNCHES
TABLE 227 PHARMACEUTICAL CONTRACT MANUFACTURING INDUSTRY: SERVICE LAUNCHES, JANUARY 2020–MARCH 2023
9.9.2 DEALS
TABLE 228 PHARMACEUTICAL CONTRACT MANUFACTURING INDUSTRY: DEALS, JANUARY 2020–MARCH 2023
9.9.3 OTHER DEVELOPMENTS
TABLE 229 PHARMACEUTICAL CONTRACT MANUFACTURING INDUSTRY: OTHER DEVELOPMENTS, JANUARY 2020–MARCH 2023
10 COMPANY PROFILES (Page No. - 219)
10.1 KEY MARKET PLAYERS
(Business Overview, Services Offered, Recent Developments, and MnM View)*
10.1.1 THERMO FISHER SCIENTIFIC, INC.
TABLE 230 THERMO FISHER SCIENTIFIC, INC.: BUSINESS OVERVIEW
FIGURE 36 THERMO FISHER SCIENTIFIC, INC.: COMPANY SNAPSHOT (2022)
10.1.2 CATALENT, INC.
TABLE 231 CATALENT, INC.: BUSINESS OVERVIEW
FIGURE 37 CATALENT, INC.: COMPANY SNAPSHOT (2022)
10.1.3 LONZA GROUP
TABLE 232 LONZA GROUP: BUSINESS OVERVIEW
FIGURE 38 LONZA GROUP: COMPANY SNAPSHOT (2022)
10.1.4 ABBVIE, INC.
TABLE 233 ABBVIE, INC.: BUSINESS OVERVIEW
FIGURE 39 ABBVIE, INC.: COMPANY SNAPSHOT (2022)
10.1.5 WUXI APPTEC
TABLE 234 WUXI APPTEC: BUSINESS OVERVIEW
FIGURE 40 WUXI APPTEC: COMPANY SNAPSHOT (2022)
10.1.6 EVONIK INDUSTRIES AG
TABLE 235 EVONIK INDUSTRIES AG: BUSINESS OVERVIEW
FIGURE 41 EVONIK INDUSTRIES AG: COMPANY SNAPSHOT (2022)
10.1.7 SAMSUNG BIOLOGICS
TABLE 236 SAMSUNG BIOLOGICS: BUSINESS OVERVIEW
FIGURE 42 SAMSUNG BIOLOGICS: COMPANY SNAPSHOT (2022)
10.1.8 BOEHRINGER INGELHEIM INTERNATIONAL GMBH
TABLE 237 BOEHRINGER INGELHEIM INTERNATIONAL GMBH: BUSINESS OVERVIEW
FIGURE 43 BOEHRINGER INGELHEIM INTERNATIONAL GMBH: COMPANY SNAPSHOT (2022)
10.1.9 SIEGFRIED HOLDING AG
TABLE 238 SIEGFRIED HOLDING AG: BUSINESS OVERVIEW
FIGURE 44 SIEGFRIED HOLDING AG: COMPANY SNAPSHOT (2022)
10.1.10 FUJIFILM HOLDINGS CORPORATION
TABLE 239 FUJIFILM HOLDINGS CORPORATION: BUSINESS OVERVIEW
FIGURE 45 FUJIFILM HOLDINGS CORPORATION: COMPANY SNAPSHOT (2022)
10.1.11 EUROFINS SCIENTIFIC
TABLE 240 EUROFINS SCIENTIFIC: BUSINESS OVERVIEW
FIGURE 46 EUROFINS SCIENTIFIC: COMPANY SNAPSHOT (2022)
10.1.12 PIRAMAL PHARMA SOLUTIONS
TABLE 241 PIRAMAL PHARMA SOLUTIONS: BUSINESS OVERVIEW
FIGURE 47 PIRAMAL PHARMA SOLUTIONS: COMPANY SNAPSHOT (2022)
10.1.13 RECIPHARM AB
TABLE 242 RECIPHARM AB: BUSINESS OVERVIEW
10.1.14 ALMAC GROUP
TABLE 243 ALMAC GROUP: BUSINESS OVERVIEW
10.1.15 VETTER PHARMA
TABLE 244 VETTER PHARMA: BUSINESS OVERVIEW
* Business Overview, Services Offered, Recent Developments, and MnM View might not be captured in case of unlisted companies.
10.2 OTHER PLAYERS
10.2.1 DELPHARM HOLDINGS
10.2.2 YUHAN CORPORATION
10.2.3 CURIA GLOBAL, INC.
10.2.4 CHARLES RIVER LABORATORIES
10.2.5 LANNETT COMPANY, INC.
10.2.6 CAMBREX CORPORATION
10.2.7 FAMAR HEALTHCARE SERVICES
10.2.8 SYNGENE INTERNATIONAL LIMITED (BIOCON LIMITED)
10.2.9 SAI LIFE SCIENCES LIMITED
10.2.10 PCI PHARMA SERVICES
11 APPENDIX (Page No. - 282)
11.1 DISCUSSION GUIDE
11.2 KNOWLEDGESTORE: MARKETSANDMARKETS’ SUBSCRIPTION PORTAL
11.3 CUSTOMIZATION OPTIONS
11.4 RELATED REPORTS
11.5 AUTHOR DETAILS


 Generating Response ...


Growth opportunities and latent adjacency in Pharmaceutical Contract Manufacturing Market
What will be the key challenges for business in the pharmaceutical contract manufacturing market in the near future?
Key players in pharmaceutical contract manufacturing industry for North America region include:
Who are the top key players in the pharmaceutical contract manufacturing market in North America?