Pipeline Integrity Market by Service (Testing, Inspection [Ultrasonic, Magnetic Flux, Caliper], Monitoring, Software), Application (Onshore, Offshore), Product (Oil, Gas, Refined Product), and Region: Global Forecast to 2024


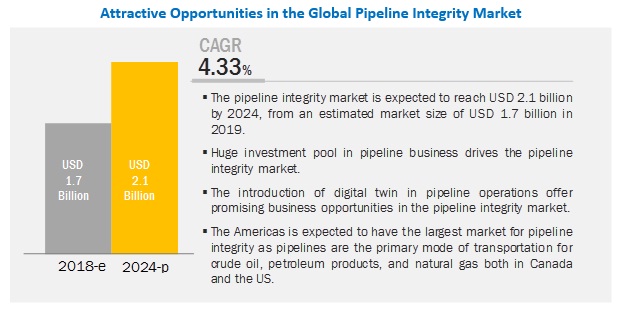
[128 Pages Report] The global pipeline integrity market is projected to reach USD 2.1 billion by 2024 from an estimated USD 1.7 billion in 2019, at a CAGR of 4.33% during the forecast period. This growth can be attributed to the huge investment pool in the pipeline business, increased government mandate and regulations for pipeline assessment, concern over environment impact, the safety of pipelines and energy infrastructure, and increased focus on the remote management of oil & gas pipeline for process optimization & automation.
To know about the assumptions considered for the study, download the pdf brochure
By product, the gas segment is expected to be the largest contributor to the pipeline integrity market during the forecast period.
The gas segment of the market is driven by an increase in demand for safe, economical, and reliable connectivity. The natural gas market is becoming more globalized, driven by the availability of shale gas and the rising supplies of liquefied natural gas. Natural gas, Natural Gas Liquids (NGL), shale gas, Coal Seam Gas (CSG), and Coal Bed Methane (CBM) have been considered under the gas segments. Gas pipelines are more prone to threats such as deformation and corrosion compared to liquid pipelines. Operators are laying more emphasis that the safety of pipelines complies with the environmental regulations.
The onshore segment is expected to be the largest and fastest growing contributor to the pipeline integrity market.
The onshore segment of the market is expected to be the largest and fastest growing segment. Increasing demand for oil & gas and rising environmental concerns related to its transportation are expected to drive the onshore segment during the forecast period. The onshore segment accounts for various assessments such as metal loss/corrosion, geometry deformation, and crack & leak detection. Metal loss/corrosion detection accounts for the largest share of the onshore pipeline applications.
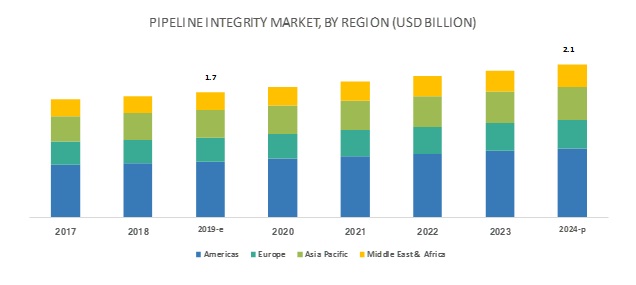
The Americas is expected to account for the largest market size during the forecast period.
The pipeline integrity market has been analyzed with respect to 4 regions, namely, the Americas, Europe, Asia Pacific, and the Middle East & Africa. The Americas is estimated to be the largest market from 2019 to 2024. The US and Canada are among the largest markets in the Americas. In the US, approximately 70% of the crude oil and petroleum products are shipped through pipelines; and in Canada, approximately 97% of natural gas and petroleum products are shipped through pipelines. As the demand for energy produced in the Americas continues to grow, the E&P activities would continue to move further toward harsh environments. For instance, most of recent oil & gas shale discoveries has been in remote areas. Transportation of these reserves from harsh environment till storage locations needs more attention, which is expected to increase demand for pipeline integrity services in the region.
Key Market Players
The major players in the global pipeline integrity market are Rosen (Switzerland), Baker Hughes, a GE Company (US), NDT Global (Germany), T.D. Williamson (US), SGS (Switzerland), Schneider Electric (France), Emerson (US), Applus (Spain), Altus Intervention (Malaysia), Enermech (UK), Intertek (UK), IKM Gruppen (Norway), and Lin Scan (UAE).
Rosen (Switzerland) is one of the key providers of pipeline integrity solutions in the oil & gas industry with a presence in more than 100 countries. The company has a strong focus on the vertical integration strategy and has achieved the same for over 85% of its products. This has helped the company achieve higher control and flexibility over its cost and supplier relationship. The company also adopted new product launches as a key organic growth strategy. For instance, in 2018, it launched a digital integrity management solution, NIMA, which helps make an accurate decision by keeping individual pipeline records traceable, complete, and verifiable, thereby helping the company make decisions more quickly and accurately.
BHGE (US) is one of the leading OFE and related services businesses. The company focuses on inorganic growth to expand its product base. It launched the ultrasonic phase�s array pipeline inspection tool in collaboration with Embridge, which would identify cracks with great details and accuracy. In July 2018, the company also signed an agreement with SGS for the development of predictive corrosion management solutions. Moreover, the company�s diversified business operations throughout the oil & gas value chain help mitigate the risks of oil price shocks.
Get online access to the report on the World's First Market Intelligence Cloud
- Easy to Download Historical Data & Forecast Numbers
- Company Analysis Dashboard for high growth potential opportunities
- Research Analyst Access for customization & queries
- Competitor Analysis with Interactive dashboard
- Latest News, Updates & Trend analysis
Request Sample Scope of the Report
Get online access to the report on the World's First Market Intelligence Cloud
- Easy to Download Historical Data & Forecast Numbers
- Company Analysis Dashboard for high growth potential opportunities
- Research Analyst Access for customization & queries
- Competitor Analysis with Interactive dashboard
- Latest News, Updates & Trend analysis

|
Report Metric |
Details |
|
Market size available for years |
2017�2024 |
|
Base year considered |
2018 |
|
Forecast period |
2019�2024 |
|
Forecast units |
Value (USD) |
|
Segments covered |
Service, application, product, and region |
|
Geographies covered |
Asia Pacific, Americas, Europe, and the Middle East & Africa |
|
Companies covered |
Rosen (Switzerland), Baker Hughes, a GE Company (US), NDT Global (Germany), T.D. Williamson (US), SGS (Switzerland), Schneider Electric (France), Emerson (US), Applus (Spain), Altus Intervention (Malaysia), Enermech (UK), Intertek (UK), IKM Gruppen (Norway), and Lin Scan (UAE) |
This research report categorizes the market on the basis of product, region, application and service.
On the basis of service, the pipeline integrity market has been segmented as follows:
- Testing
- Inspection
- Monitoring
- Software
On the basis of application, the pipeline integrity market has been segmented as follows:
- Onshore
- Metal Loss/Corrosion
- Geometry Measurement and Bend Detection
- Crack & Leak Detection
- Offshore
- Metal Loss/Corrosion
- Geometry Measurement and Bend Detection
- Crack & Leak Detection
On the basis of product, the pipeline integrity market has been segmented as follows:
- Oil
- Gas
- Refined products
On the basis of region, the pipeline integrity market has been segmented as follows:
- Asia Pacific
- Americas
- Europe
- Middle East & Africa
Recent Developments
- In February 2019, NDT Global introduced Evo Eclipse UCx technology, which can accurately identify size tilts and skewed cracks.
Key Questions Addressed by the Report
- The report identifies and addresses the key markets of pipeline integrity, which would help manufacturers review the growth in demand.
- The report helps the system providers understand the pulse of the market and provides insights into drivers, restraints, opportunities, and challenges.
- The report will help key players understand the strategies of their competitors better and make effective strategic decisions.
- The report addresses the market share analysis of the key players in the pipeline integrity market, and with the help of this, companies can enhance their revenues in the respective market.
- The report provides insights about emerging geographies for pipeline integrity, and hence the entire market ecosystem can gain a competitive advantage from such insights.
To speak to our analyst for a discussion on the above findings, click Speak to Analyst
Table of Contents
1 Introduction (Page No. - 15)
1.1 Objectives of the Study
1.2 Market Definition
1.3 Market Scope
1.3.1 Market Segmentation
1.3.2 Regional Scope
1.4 Years Considered for the Study
1.5 Currency
1.6 Limitations
1.7 Stakeholders
2 Research Methodology (Page No. - 19)
2.1 Market Size Estimation
2.1.1 Ideal Demand-Side Analysis
2.1.1.1 Assumptions
2.1.2 Supply-Side Analysis
2.1.2.1 Calculation
2.1.3 Forecast
2.2 Some of the Insights of Industry Experts
3 Executive Summary (Page No. - 22)
4 Premium Insights (Page No. - 26)
4.1 Global Pipeline Integrity Market, 2019�2024
4.2 Pipeline Integrity Market, By Service
4.3 Pipeline Integrity Market, By Product
4.4 Pipeline Integrity Market, By Application
4.5 Americas: Pipeline Integrity Market, By Country & Product
5 Market Overview (Page No. - 29)
5.1 Introduction
5.2 Market Dynamics
5.2.1 Drivers
5.2.1.1 Huge Investment Pool in the Pipeline Business
5.2.1.2 Increased Government Mandate and Regulations for Pipeline Assessment
5.2.1.3 Concern Over Environment Impact, the Safety of Pipelines and Energy Infrastructure
5.2.1.4 Increased Focus on the Remote Management of Oil & Gas Pipeline for Process Optimization & Automation
5.2.2 Restraints
5.2.2.1 Difficulty in Pipeline Assessment
5.2.2.2 Cross-Border Pipelines
5.2.3 Opportunities
5.2.3.1 Introduction of the Digital Twin Technology in Pipeline Operation
5.2.3.2 Offshore/Ultra-Deepwater Discoveries
5.2.3.3 Big Data Analytics Would Increase the Scope of Pipeline Monitoring Systems
5.2.4 Challenges
5.2.4.1 Delays in Issuing A Permit By Statutory Government Bodies
5.2.4.2 High Time Consumption in the Data Analytics Process
6 Pipeline Integrity Market, By Service (Page No. - 38)
6.1 Introduction
6.2 Testing Services
6.2.1 Americas is the Largest Market for Testing Segment
6.2.1.1 Hydrostatic Testing
6.2.1.2 Pneumatic Testing
6.2.1.3 Vacuum Testing
6.2.1.4 Testing Plugs
6.2.1.5 Petroleum Pipeline Testing
6.3 Inspection Services
6.3.1 Rising Government Regulations and Mandates Associated With the Inspection of Pipelines are Expected to Drive the Segment
6.3.1.1 Magnetic Flux
6.3.1.2 Ultrasonic
6.3.1.3 Caliper
6.4 Monitoring Services
6.4.1 Increased Focus on the Remote Management of Oil & Gas Pipeline for Process Optimization & Automation is Expected to Drive the Monitoring Segment.
6.5 Software Services
6.5.1 Americas is Expected to Dominate Software Services Segment
7 Pipeline Integrity Market, By Application (Page No. - 45)
7.1 Introduction
7.2 Onshore
7.2.1 Increasing Demand for Oil & Gas and Rising Environmental Concerns Related to Its Transportation is Expected to Drive the Onshore Segment
7.2.2 Metal Loss/Corrosion
7.2.3 Geometry Measurement & Bend Detection
7.2.4 Crack & Leak Detection
7.3 Offshore
7.3.1 Crude Oil Pipelines are the Basis of Liquid Energy Supply, and Natural Gas Offshore Pipelines Have Accounted for A Significant Share in the Offshore Pipeline Network
7.3.2 Metal Loss/Corrosion
7.3.3 Geometry Measurement & Bend Detection
7.3.4 Crack & Leak Detection
8 Pipeline Integrity Market, By Product (Page No. - 53)
8.1 Introduction
8.2 Oil
8.2.1 The Americas Oil Pipeline Product Segment is Expected to Add Approximately 1,000 Km of Pipeline Length Till 2023.
8.3 Gas
8.3.1 Increase in Demand for Safe, Economic, and Reliable Connectivity is Expected to Boost the Gas Pipeline Segment
8.4 Refined Products
8.4.1 Americas Held the Largest Share in Refined Product Segment
9 Pipeline Integrity Market, By Region (Page No. - 57)
9.1 Introduction
9.2 Americas
9.2.1 Key Projects
9.2.2 By Application
9.2.3 By Service
9.2.4 By Product
9.2.5 By Country
9.2.5.1 US
9.2.5.1.1 Increasing Shale Gas Activities are Likely to Foster the Market
9.2.5.2 Canada
9.2.5.2.1 Growing Oil & Gas Activities in the Atlantic Region is Expected to Boost the Market
9.2.5.3 Mexico
9.2.5.3.1 Increase in Pipeline Projects is Expected to Drive the Market
9.2.5.4 Brazil
9.2.5.4.1 Investments in Oil Reserves are Expected to Dominate the Pipeline Integrity Market in Brazil
9.2.5.5 Rest of the Americas
9.2.5.5.1 Demand for Energy is Expected to Dominate the Market
9.3 Europe
9.3.1 Key Projects
9.3.2 By Application
9.3.3 By Service
9.3.4 By Product
9.3.5 By Country
9.3.5.1 Germany
9.3.5.1.1 Increasing Imports of Gas are Expected to Drive the Pipeline Integrity Market
9.3.5.2 Russia
9.3.5.2.1 Increasing Coalbed Methane Production is Expected to Drive the Market
9.3.5.3 UK
9.3.5.3.1 Increasing Dependency on Imports to Meet the Country�s Oil & Gas Demand is Expected to Boost the Market
9.3.5.4 Rest of Europe
9.3.5.4.1 Expansions in Gas Pipeline Infrastructure are Expected to Drive the Market
9.4 Asia Pacific
9.4.1 Key Projects
9.4.2 By Application
9.4.3 By Service
9.4.4 By Product
9.4.5 By Country
9.4.5.1 China
9.4.5.1.1 Strong Investments in Pipeline Projects are Likely to Boost the Pipeline Integrity Market in China
9.4.5.2 India
9.4.5.2.1 Redevelopment of Oilfields and Modification of Existing Pipeline Systems are Expected to Boost the Market
9.4.5.3 Australia
9.4.5.3.1 Expansion of the Lng Industry in the Australian Gas Market is Expected to Drive the Market
9.4.5.4 Rest of Asia Pacific
9.4.5.4.1 Increasing Pipeline Infrastructure and Its Systems are Expected to Boost the Market
9.5 Middle East & Africa
9.5.1 Key Project
9.5.2 By Application
9.5.3 By Service
9.5.4 By Product
9.5.5 By Country
9.5.5.1 Saudi Arabia
9.5.5.1.1 Growing Investments and Projects in Offshore Activities are Expected to Foster the Market
9.5.5.2 UAE
9.5.5.2.1 Increasing Investments and Oil & Gas Activities in the Country are Likely to Boost the Pipeline Integrity Market
9.5.5.3 Iran
9.5.5.3.1 Upcoming Projects and Investments are Expected to Boost the Market
9.5.5.4 Nigeria
9.5.5.4.1 Increasing Focus on Deep- and Ultra-Deepwater Fields is A Major Factor Driving the Market
9.5.5.5 Rest of Middle East & Africa
9.5.5.5.1 Investments in the Oil & Gas Sector are Driving the Market for Pipeline Integrity
10 Competitive Landscape (Page No. - 84)
10.1 Introduction
10.2 Market Share Analysis
10.3 Competitive Scenario
10.3.1 New Product Launches
10.3.2 Contracts & Agreements
10.3.3 Mergers & Acquisitions
10.3.4 Investments & Expansions
10.3.5 Others
10.4 Competitive Leadership Mapping
10.4.1 Visionary Leaders
10.4.2 Innovators
10.4.3 Dynamic
10.4.4 Emerging
11 Company Prolfles (Page No. - 90)
(Business Overview, Products Offered, Recent Developments, MnM View)*
11.1 Rosen
11.2 Baker Hughes, A GE Company
11.3 NDT Global
11.4 T.D. Williamson
11.5 SGS
11.6 Applus
11.7 Altus Intervention
11.8 Enermech
11.9 Intertek
11.10 IKM Gruppen
11.11 Lin Scan
11.12 Quest Integrity Group
11.13 Dacon Inspection Technologies
11.14 Schneider Electric
11.15 Emerson
*Details on Business Overview, Products Offered, Recent Developments, MnM View Might Not Be Captured in Case of Unlisted Companies.
12 Appendix (Page No. - 120)
12.1 Insights of Industry Experts
12.2 Discussion Guide
12.3 Knowledge Store: Marketsandmarkets� Subscription Portal
12.4 Available Customizations
12.5 Related Reports
12.6 Author Details
List of Tables (68 Tables)
Table 1 Huge Investment Pool in the Pipeline Business are the Determining Factor for the Global Market
Table 2 Pipeline Integrity Market Snapshot
Table 3 Global Primary Energy Consumption, By Fuel Type, Million Toe, 1970�2040
Table 4 Pipeline Code and Standard Programs for Integrity in North America
Table 5 Pipeline Incidents, 2010�2018
Table 6 Key Concerns During Pipeline Assessment
Table 7 Trend of Offshore Discoveries.
Table 8 Pipeline Integrity Market Size, By Service, 2017�2024 (USD Million)
Table 9 Testing Service: Market Size, By Region, 2017�2024 (USD Million)
Table 10 Inspection Service: Market Size, By Region, 2017�2024 (USD Million)
Table 11 Inspection Service: Market Size, By Technology, 2017�2024 (USD Million)
Table 12 Monitoring Services: Market, By Region, 2017�2024 (USD Million)
Table 13 Software Services: Market Size, By Region, 2017�2024 (USD Million)
Table 14 Pipeline Integrity Market Size, By Application, 2017�2024 (USD Million)
Table 15 Onshore: Market Size, By Region, 2017�2024 (USD Million)
Table 16 Onshore: Market Size, By Assessment Type, 2017�2024 (USD Million)
Table 17 Metal Loss/Corrosion: Onshore Market Size, By Region, 2017�2024 (USD Million)
Table 18 Geometry Measurement & Bend Detection: Onshore Market Size, By Region, 2017�2024 (USD Million)
Table 19 Crack & Leak Detection: Onshore Market Size, By Region, 2017�2024 (USD Million)
Table 20 Offshore: Market Size, By Region, 2017�2024 (USD Million)
Table 21 Offshore: Market Size, By Assessment Type, 2017�2024 (USD Million)
Table 22 Metal Loss/Corrosion: Offshore Market Size, By Region, 2017�2024 (USD Million)
Table 23 Geometry Measurement & Bend Detection: Offshore Market Size, By Region, 2017�2024 (USD Million)
Table 24 Crack & Leak Detection: Offshore Market Size, By Region, 2017�2024 (USD Million)
Table 25 Pipeline Integrity Market Size, By Product, 2017�2024 (USD Million)
Table 26 Oil: Market Size, By Region, 2017�2024 (USD Million)
Table 27 Gas: Market Size, By Region, 2017�2024 (USD Million)
Table 28 Refined Products: Market Size, By Region, 2017�2024 (USD Million)
Table 29 Pipeline Integrity Market Size, By Region, 2017�2024 (USD Million)
Table 30 Americas: Key Pipeline Projects, 2019-2024
Table 31 Americas: Market Size, By Application, 2017�2024 (USD Million)
Table 32 Americas: Pipeline Integrity Market Size, By Service, 2017�2024 (USD Million)
Table 33 Americas: Market Size, By Product, 2017�2024 (USD Million)
Table 34 Americas: Market Size, By Country, 2017�2024 (USD Million)
Table 35 US: Pipeline Integrity Market Size, By Application, 2017�2024 (USD Million)
Table 36 Canada: Market Size, By Application, 2017�2024 (USD Million)
Table 37 Mexico: Market Size, By Application, 2017�2024 (USD Million)
Table 38 Brazil: Market Size, By Application, 2017�2024 (USD Million)
Table 39 Rest of Americas: Market Size, By Application, 2017�2024 (USD Million)
Table 40 Europe: Key Pipeline Projects, 2019�2024
Table 41 Europe: Pipeline Integrity Market Size, By Application, 2017�2024 (USD Million)
Table 42 Europe: Market Size, By Service, 2017�2024 (USD Million)
Table 43 Europe: Market Size, By Product, 2017�2024 (USD Million)
Table 44 Europe: Market Size, By Country, 2017�2024 (USD Million)
Table 45 Germany: Pipeline Integrity Market Size, By Application, 2017�2024 (USD Million)
Table 46 Russia: Market Size, By Application, 2017�2024 (USD Million)
Table 47 UK: Market Size, By Application, 2017�2024 (USD Million)
Table 48 Rest of Europe: Market Size, By Application, 2017�2024 (USD Million)
Table 49 Asia Pacific: Key Pipeline Projects, 2019�2024
Table 50 Asia Pacific: Pipeline Integrity Market Size, By Application, 2017�2024 (USD Million)
Table 51 Asia Pacific: Market Size, By Service, 2017�2024 (USD Million)
Table 52 Asia Pacific: Market Size, By Product, 2017�2024 (USD Million)
Table 53 Asia Pacific: Market Size, By Country, 2017�2024 (USD Million)
Table 54 China: Market Size, By Application, 2017�2024 (USD Million)
Table 55 India: Market Size, By Application, 2017�2024 (USD Million)
Table 56 Australia: Market Size, By Application, 2017�2024 (USD Million)
Table 57 Rest of Asia Pacific: Market Size, By Application, 2017�2024 (USD Million)
Table 58 Middle East & Africa: Key Pipeline Projects, 2019�2024
Table 59 Middle East & Africa: Pipeline Integrity Market Size, By Application, 2017�2024 (USD Million)
Table 60 Middle East & Africa: Market Size, By Service, 2017�2024 (USD Million)
Table 61 Middle East & Africa: Market Size, By Product, 2017�2024 (USD Million)
Table 62 Middle East & Africa: Market Size, By Country, 2017�2024 (USD Million)
Table 63 Saudi Arabia: Pipeline Integrity Market Size, By Application, 2017�2024 (USD Million)
Table 64 UAE: Market Size, By Application, 2017�2024 (USD Million)
Table 65 Iran: Market Size, By Application, 2017�2024 (USD Million)
Table 66 Nigeria: Market Size, By Application, 2017�2024 (USD Million)
Table 67 Rest of Middle East & Africa: Market Size, By Application, 2017�2024 (USD Million)
Table 68 Developments By Key Players in the Market, 2015�2019
List of Figures (27 Figures)
Figure 1 Pipeline Integrity Market, 2018
Figure 2 Gas Segment is Expected to Grow at the Highest Cagr During the Forecast Period
Figure 3 Inspection Services Segment is Expected to Lead the Market During the Forecast Period
Figure 4 Onshore Pipeline Segment is Expected to Lead the Market During the Forecast Period
Figure 5 Asia Pacific is Expected to Dominate the Pipeline Integrity Market During the Forecast Period
Figure 6 Huge Investment Pool in Pipeline Business is Expected to Drive the Market During the Forecast Period
Figure 7 Inspection Services Led the Market for Pipeline Integrity in 2018
Figure 8 Gas Segment is Expected to Grow Globally in the Market During the Forecast Period
Figure 9 Onshore Pipeline Segment is Expected to Grow Globally in the Market, 2018
Figure 10 US Was the Largest Market in the Americas
Figure 11 Market Dynamics of the Pipeline Integrity Market
Figure 12 Pipeline Integrity Market, By Service, 2019�2024 (USD Million)
Figure 13 Market, By Application, 2019�2024 (USD Million)
Figure 14 Market, By Product, 2019�2024 (USD Million)
Figure 15 Regional Snapshot: the Asia Pacific Market is Expected to Grow at the Highest Cagr During the Forecast Period
Figure 16 Market Share (Value), By Region, 2018
Figure 17 Americas: Regional Snapshot
Figure 18 Europe: Regional Snapshot
Figure 19 Key Developments in the Market During 2016�2019
Figure 20 Pipeline Integrity Market Share, 2018
Figure 21 Market (Global) Competitive Leadership Mapping, 2018
Figure 22 BHGE: Company Snapshot
Figure 23 SGS : Company Snapshot
Figure 24 Applus: Company Snapshot
Figure 25 Intertek: Company Snapshot
Figure 26 Schneider Electric: Company Snapshot
Figure 27 Emerson: Company Snapshot
This study involved 4 major activities in estimating the current size of the pipeline integrity market. Exhaustive secondary research was done to collect information on the market and peer market. The next step was to validate these findings, assumptions, and market sizing with industry experts across the value chain through primary research. Both top-down and bottom-up approaches were used to estimate the total market size. Thereafter, the market breakdown and data triangulation were done to estimate the market size of the segments and subsegments.
Secondary Research
This research study involved the use of extensive secondary sources, directories, and databases, such as Hoover�s, Bloomberg BusinessWeek, Factiva, and OneSource, to identify and collect information useful for a technical, market-oriented, and commercial study of the global pipeline integrity market. The other secondary sources included annual reports, press releases & investor presentations of companies, white papers, certified publications, articles by recognized authors, manufacturer associations, trade directories, and databases.
Primary Research
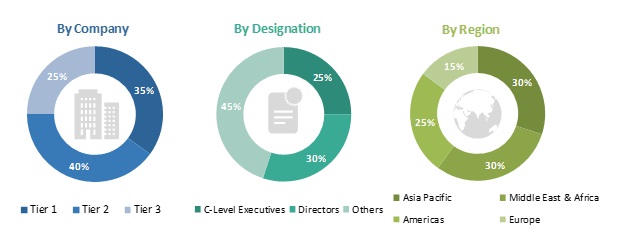
The market comprises several stakeholders such as service providers, pipeline operators, contractors, and third-party vendors. The demand side of this market is characterized by huge investment pool in the pipeline network by pipeline operators/contractors. The supply side is characterized by advancements in the inspection technologies in pipeline integrity services. Various primary sources from both the supply and demand sides of the market were interviewed to obtain qualitative and quantitative information. The breakdown of primary respondents is as follows:
To know about the assumptions considered for the study, download the pdf brochure
Market Size Estimation
Both top-down and bottom-up approaches have been used to estimate and validate the size of the global pipeline integrity market and its dependent submarkets. These methods were also used extensively to estimate the size of various subsegments in the market. The research methodology used to estimate the market size includes the following:
- The key players in the industry and market have been identified through extensive secondary research, and their market share in the respective regions have been determined through both primary and secondary research.
- The industry�s supply chain and market size, in terms of value, have been determined through primary and secondary research processes.
- All percentage shares, splits, and breakdowns have been determined using secondary sources and verified through primary sources.
Data Triangulation
After arriving at the overall market size-using the market size estimation processes as explained above-the market was split into segments and subsegments. To complete the overall market engineering process and arrive at the exact statistics of each market segment and subsegment, the data triangulation and market breakdown procedures were employed, wherever applicable. The data was triangulated by studying various factors and trends from both the demand and supply sides.
Report Objectives
- To define, describe, and forecast the global pipeline integrity market by service, application, product, and region
- To provide detailed information on the major factors influencing the growth of the market (drivers, restraints, opportunities, and industry-specific challenges)
- To strategically analyze the pipeline integrity market with respect to individual growth trends, prospects, and contribution of each segment to the market
- To analyze market opportunities for stakeholders and details of the competitive landscape for market leaders
- To forecast the growth of the pipeline integrity market with respect to the major regions (Asia Pacific, Europe, the Americas, and the Middle East and Africa)
- To strategically profile key players and comprehensively analyze their market share and core competencies
- To track and analyze competitive developments such as contracts & agreements, expansions, new product developments, mergers & acquisitions, and partnerships in the pipeline integrity market
Available Customizations:
With the given market data, MarketsandMarkets offers customizations as per the client�s specific needs. The following customization options are available for this report:
Regional Analysis
- Further breakdown of region or country-specific analysis
Company Information
- Detailed analyses and profiling of additional market players (up to 5)


Growth opportunities and latent adjacency in Pipeline Integrity Market