Pipeline Network Market by Offering (Solution and Services), Application (Pipeline Monitoring and Pipeline Operation Optimization), Content, End-User Industry (Crude & Refined Petroleum, Water & Wastewater), and Region - Global Forecast to 2024


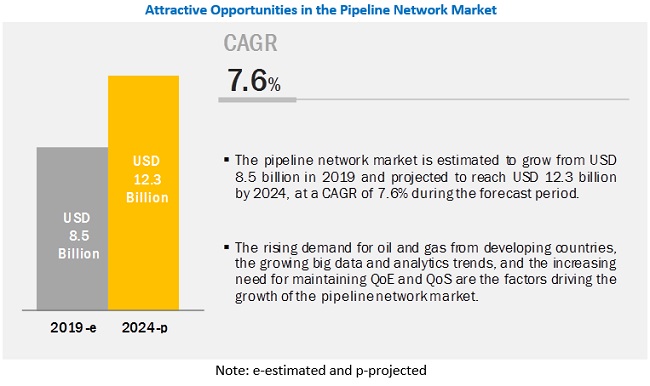
[178 Pages Report] The Pipeline Network Market size to grow from USD 8.5 billion in 2019 to USD 12.3 billion by 2024, at a Compound Annual Growth Rate (CAGR) of 7.6% during 2019�2024. Major growth drivers for the market include the rising demand for oil and gas from developing countries, growing demand for commercial off-the-shelf technology, rising big data and analytics trends, and need for maintaining Quality of Experience and Quality of Service of the overall pipeline transportation.
Based service, the training, support, and maintenance services segment to grow at the highest CAGR during forecast period
The training, support, and maintenance services continuously assist enterprises in solving deployment-related, performance-related, and non-technical issues, as well as deliver cost-effective support to enterprises for carrying out improvements in the overall pipeline operation performance. Timely support and maintenance reduce the chances of performance issues across the entire pipeline network. Training helps users and customers gain an operational working knowledge of pipeline network management solutions, which cannot be utilized to the optimum level unless employees are trained properly to leverage their benefits. Vendors that offer training, support, and maintenance services focus on improving the performance of the solutions, reducing Capital Expenditure (CAPEX) and Operational Expenditure (OPEX), and ensuring end-to-end pipeline network management solutions delivery and multi-vendor support. Hence, an increase in the adoption rate of pipeline network management solutions across the globe is expected to lead to an increased demand for training, support, and maintenance services.
By application, the pipeline monitoring segment to hold a larger market size in 2019
For pipeline monitoring application, pipeline network management solutions are constantly evolving toward implementing security measures that need to be deployed in case of potential threat alerts. Factors, such as increased number of oil and gas leaks in production, pipelines, and storage tanks, due to natural disasters and high pressure of pipeline content, stringent government regulations for pipeline safety and security, and expansion and upgradation of pipeline infrastructure are factors driving the growth of the pipeline monitoring segment in the market.
By end-user industry, crude and refined petroleum to hold the largest market size during forecast period
End-user industries that use pipeline network management solutions and services include crude and refined petroleum, water and wastewater, and others (healthcare and pharmaceutical, food and beverage, and hospitality). The crude and refined petroleum end-user industry is estimated to lead the pipeline network market in 2019. The growing consumption of crude oil and natural gas across the globe has encouraged the crude and refined petroleum industry to utilize pipelines as one of the cost-effective and mostly-used mediums for transportation of liquid/gas.
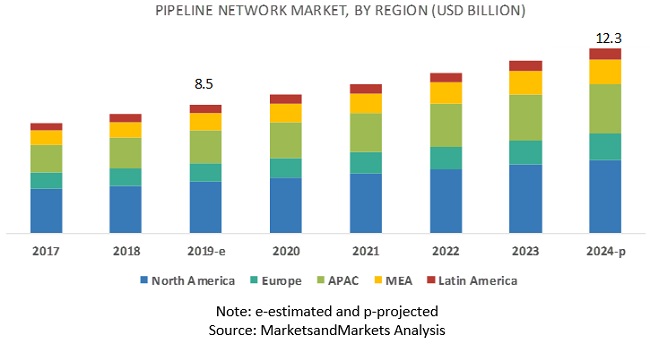
North America to hold the largest market size during forecast period
North America is estimated to hold the largest market size in the pipeline network market in 2019. Oil and gas companies, government bodies, and environmental agencies in the region are focused on preventing oil spills and gas leaks, which is one of the important addressable factors as the number of pipelines has increased in the US and Canada. This compels oil and gas companies to use pipeline network management solutions. Moreover, the presence of key vendors, such as Honeywell (US), GE (US), Emerson (US), Rockwell Automation (US), Cisco Systems (US), ORBCOMM (US), and Pure Technologies (Canada), in the region drives the growth of the pipeline network market in North America.
Key Pipeline network Market Players
Major vendors in the pipeline network market include Huawei (China), ABB (Switzerland), Siemens (Germany), Hitachi (Japan), Schneider Electric (France), PSI Software (Germany), Honeywell (US), GE (US), Wipro (India), Emerson (US), Cisco Systems (US), Rockwell Automation (US), Moxa (Taiwan), ORBCOMM (US), OptaSense (UK), Pure Technologies (Canada), Necon Group (Qatar), Sensornet (UK), Open Access Technology International (US), and KROHNE Group (Germany). These companies have adopted various strategies, such as mergers and acquisitions; expansions; new product launches and product enhancements; and partnerships, agreements, and collaborations to cater to the growing demand for pipeline network management solutions across the globe as well as to strengthen their position in the market.
Get online access to the report on the World's First Market Intelligence Cloud
- Easy to Download Historical Data & Forecast Numbers
- Company Analysis Dashboard for high growth potential opportunities
- Research Analyst Access for customization & queries
- Competitor Analysis with Interactive dashboard
- Latest News, Updates & Trend analysis
Request Sample Scope of the Report
Get online access to the report on the World's First Market Intelligence Cloud
- Easy to Download Historical Data & Forecast Numbers
- Company Analysis Dashboard for high growth potential opportunities
- Research Analyst Access for customization & queries
- Competitor Analysis with Interactive dashboard
- Latest News, Updates & Trend analysis

|
Report Metrics |
Details |
|
Market size available for years |
2017�2024 |
|
Base year considered |
2018 |
|
Forecast period |
2019�2024 |
|
Forecast units |
Value (USD) |
|
Segments covered |
By offering, application, content, end-user industry, and region |
|
Geographies covered |
North America, Europe, APAC, Latin America, and MEA |
|
Companies covered |
Huawei (China), ABB (Switzerland), Siemens (Germany), Hitachi (Japan), Schneider Electric (France), PSI Software (Germany), Honeywell (US), GE (US), Wipro (India), Emerson (US), Cisco Systems (US), Rockwell Automation (US), Moxa (Taiwan), ORBCOMM (US), OptaSense (UK), Pure Technologies (Canada), Necon Group (Qatar), Sensornet (UK), Open Access Technology International (US), and KROHNE Group (Germany). |
The research report categorizes the pipeline network market based on offering, application, content, end-user industry, and region.
Based on Offering, the pipeline network market has the following segments:
- Solutions
- Operation Management and Control
- Surveillance and Security
- Communication System
- Pipeline Geographic Information System (GIS) Software
- Services
- Consulting
- Integration and Deployment
- Training, Support, and Maintenance
Based on Application, the pipeline network market has the following segments:
- Pipeline Monitoring
- Leak Detection
- Pipeline Break Detection
- Operating Condition
- Others (Liquid/Material Identification)
- Pipeline Operation Optimization
Based on Content, the pipeline network market has the following segments:
- Liquid Pipeline
- Gas Pipeline
Based on End-user industry, the pipeline network market has the following segments:
- Crude and Refined Petroleum
- Oil
- Natural Gas
- Biofuel
- Water and Wastewater
- Others (Healthcare and Pharmaceutical, Food and Beverage (F&B), and Hospitality)
Based on Region, the pipeline network market has the following segments:
- North America
- United States (US)
- Canada
- Europe
- United Kingdom (UK)
- Russia
- Germany
- France
- Rest of Europe (Hungary, Ukraine, Slovakia, Italy, Netherlands, Poland, and Norway)
- APAC
- China
- India
- Australia
- Rest of APAC (Kazakhstan, Indonesia, Uzbekistan, Malaysia, Singapore, Taiwan, South Korea, and Japan)
- Latin America
- Brazil
- Mexico
- Rest of Latin America (includes Argentina, Colombia, Venezuela, Bolivia, Chile, Peru, and Ecuador)
- MEA
- Iran
- Iraq
- Saudi Arabia
- United Arab Emirates (UAE)
- Rest of MEA (includes Algeria, Nigeria, Libya, Egypt, Oman, South Africa, and Qatar)
Recent Developments
- In May 2019, Honeywell partnered with Venture Global LNG, where Honeywell UOP is helping Venture Global LNG build a facility that provides the lowest-cost supply of Liquefied Natural Gas (LNG) using large-scale high-performance equipment.
- In March 2019, ABB launched a cloud-based visualization system, Wellhead Manager, which can collaborate with remote workers using mobile devices.
- In June 2018, ABB acquired GE Industrial Solutions (GEIS), GE�s global electrification solutions business, worth USD 2.6 billion.
- In March 2018, Schneider Electric setup a new East Asia and Japan headquarters in Singapore.
- In March 2018, Schneider Electric completed the merger of Schneider Electric�s industrial software business with AVEVA (UK), a multinational Information Technology (IT) company.
Critical Questions Answered by the Report
- What are the current technology trends driving the pipeline network market?
- What are the various regulations directly impacting the adoption of pipeline network management solutions?
- Where will all these developments take the industry in the mid- to long-term?
- Which companies are top vendors in the market, and how is the competitive scenario of the market?
- What are the drivers and challenges of the market?
Frequently Asked Questions (FAQ):
What is pipeline network management?
Pipeline network management includes a set of solutions to plan, monitor, control, and manage pipeline operations with the help of location-based services. Solutions, such as pipe operation control, pipeline network monitoring, remote control room operation management, physical security, surveillance, Geographic Information System (GIS), and communication solutions, are required for the effective management of the entire pipeline network.
What is the projected market value of the global pipeline network market?
The pipeline network management market is expected to grow from USD 8.5 billion in 2019 to USD 12.3 billion by 2024.
What is the estimated growth rate of the global pipeline network market?
The global pipeline network management market is projected to register a moderate 7.6% CAGR in the forecast period.
Which end-user industry of the global pipeline network market expected to witness the highest growth?
Crude and refined petroleum is expected to grow as the fastest-growing end-user industry, during the forecast period.
Who are the key players operative in the global market?
Huawei (China), ABB (Switzerland), Siemens (Germany), Hitachi (Japan), Schneider Electric (France), PSI Software (Germany), Honeywell (US), GE (US), Wipro (India), Emerson (US), Cisco Systems (US), Rockwell Automation (US), Moxa (Taiwan), ORBCOMM (US), OptaSense (UK), Pure Technologies (Canada), Necon Group (Qatar), Sensornet (UK), Open Access Technology International (US), and KROHNE Group (Germany)
What are the top trends in pipeline network market?
The below are current market trends impacting sales intelligence market;
Driver:
- Imminent Need for Advanced Solutions to Improve Customer Targeting and Connect Rates
- Growing Demand for Data Enrichment Solutions to Improve Sales Conversions
Trends that are driving the growth of pipeline network market includes:
- Rising demand for oil and gas from developing countries
- Growing demand for commercial off-the-shelf technology
- Rising big data and analytics trends
Opportunities for the pipeline network market:
- Emergence of Internet of Things technology
- Digital transformation in oil and gas industry around the world
To speak to our analyst for a discussion on the above findings, click Speak to Analyst
Table of Contents
1 Introduction (Page No. - 20)
1.1 Objectives of the Study
1.2 Market Definition
1.2.1 Inclusions and Exclusions
1.3 Market Scope
1.3.1 Market Segmentation
1.3.2 Regions Covered
1.4 Years Considered for the Study
1.5 Currency Considered
1.6 Stakeholders
2 Research Methodology (Page No. - 24)
2.1 Research Data
2.1.1 Secondary Data
2.1.2 Primary Data
2.1.2.1 Breakup of Primary Profiles
2.1.2.2 Key Industry Insights
2.2 Market Breakup and Data Triangulation
2.3 Market Size Estimation
2.3.1 Top-Down Approach
2.3.2 Bottom-Up Approach
2.4 Market Forecast
2.5 Competitive Leadership Mapping Research Methodology
2.6 Assumptions for the Study
2.7 Limitations of the Study
3 Executive Summary (Page No. - 33)
4 Premium Insights (Page No. - 41)
4.1 Attractive Opportunities in the Pipeline Network Market
4.2 Pipeline Network Management in North America, By Offering and Country
4.3 Pipeline Network Management: Major Countries
5 Market Overview and Industry Trends (Page No. - 43)
5.1 Market Overview
5.1.1 Drivers
5.1.1.1 Rising Demand for Oil and Gas From Developing Countries
5.1.1.2 Growing Demand for Commercial Off-The-Shelf Technology
5.1.1.3 Rising Big Data and Analytics Trends
5.1.1.4 Need for Maintaining Quality of Experience and Quality of Service of Pipeline Transportation
5.1.2 Restraints
5.1.2.1 Political Instability Specifically in Middle Eastern and African Regions
5.1.3 Opportunities
5.1.3.1 Emergence of Internet of Things Technology
5.1.3.2 Digital Transformation in Oil and Gas Industry Around the World
5.1.3.3 Growing Security and Mandatory Regulations for Pipeline Network
5.1.4 Challenges
5.1.4.1 Increased Complexity of the Entire Pipeline System
5.1.4.2 Increasing Need to Comply With Changing Regulations
5.1.4.3 Rising Security Concerns Due to Multisite Facilities
5.2 Industry Trends
5.2.1 Regulatory Landscape
5.2.1.1 Occupational Safety and Health Administration
5.2.1.2 Bureau of Safety and Environmental Enforcement
5.2.1.3 Environmental Protection Agency
5.2.2 Case Studies
5.2.2.1 Use Case 1: Huawei
5.2.2.2 Use Case 2: ABB
5.2.2.3 Use Case 3: General Electric
5.2.2.4 Use Case 4: Rockwell Automation
5.2.2.5 Use Case 5: Moxa
6 Pipeline Network Management Market, By Offering (Page No. - 51)
6.1 Introduction
6.2 Solutions
6.2.1 Operation Management and Control
6.2.1.1 Growing Demand for a Real-Time View of a Complex Pipeline Operations to Drive the Demand for Operation Management and Control Segment
6.2.2 Surveillance and Security
6.2.2.1 Constant Risk of Terrorist Attacks, Unauthorized Intrusions, and Pipeline Content Thefts to Drive the Demand for Surveillance and Security Solutions
6.2.3 Communication System
6.2.3.1 Rising Demand for Secure and Cost-Effective Wireless Communication to Drive the Adoption of the Communication System Segment
6.2.4 Pipeline Gis Software
6.2.4.1 Demand for Simplification of Remote Monitoring of Pipeline Infrastructure to Drive the Adoption of the Pipeline Gis Software Segment
6.3 Services
6.3.1 Consulting
6.3.1.1 Need to Understand the Customer Needs for Tailor-Made Pipeline Network Management Solutions to Drive the Growth of Consulting Services in the Market
6.3.2 Integration and Deployment
6.3.2.1 Need to Deploy Pipeline Network Management Solutions Efficiently to Propel the Demand for Integration and Deployment Services in the Market
6.3.3 Training, Support, and Maintenance
6.3.3.1 Increase in the Adoption of Pipeline Network Management Solutions to Lead to the Growth of the Training, Support, and Maintenance Segment
7 Pipeline Network Management Market, By Application (Page No. - 64)
7.1 Introduction
7.2 Pipeline Monitoring
7.2.1 Leak Detection
7.2.1.1 Avoiding a Significant Amount of Loss of Crude Oil and Gas Due to Pipeline Leakage to Drive the Growth of the Leak Detection Segment
7.2.2 Pipeline Break Detection
7.2.2.1 Increased Instances of Terrorist and Militant Activities to Drive the Growth of the Pipeline Break Detection Segment
7.2.3 Operating Condition
7.2.3.1 Need to Monitor Proper Pipeline Functioning and the Demand to Avoid Disturbance in Operating Conditions to be the Factors Driving the Growth the Operating Condition Segment
7.2.4 Others
7.3 Pipeline Operation Optimization
7.3.1 Need to Reduce the Cost of Pipeline Operation and Maintenance to Drive the Growth of the Pipeline Operation Optimization Segment
8 Pipeline Network Management Market, By Content (Page No. - 74)
8.1 Introduction
8.2 Gas Pipeline
8.2.1 Increasing Consumption of Natural Gas Across the Globe to Drive the Growth of the Gas Pipeline Segment
8.3 Liquid Pipeline
8.3.1 Growing Export of Crude Oil Across the Globe to Drive the Growth of the Liquid Pipeline Segment
9 Pipeline Network Management Market, By End-User Industry (Page No. - 78)
9.1 Introduction
9.2 Crude and Refined Petroleum
9.2.1 Natural Gas
9.2.1.1 Growing Demand for Natural Gas Consumption for Power Generation to Drive the Demand for Pipeline Network Management Solutions in the Natural Gas End-User Industry
9.2.2 Oil
9.2.2.1 Rising Pipeline Development Projects to Drive the Demand for Pipeline Network Management Solutions in the Oil End-User Industry
9.2.3 Biofuel
9.2.3.1 High Crude Oil Prices and Rising Consumption of Biofuel to Drive the Demand for Pipeline Network Management Solutions in the Biofuel End-User Industry
9.3 Water and Wastewater
9.3.1 Rising Instances of Water Theft and Water Leakage During Water Transportation to Drive the Demand for Pipeline Network Management Solutions in the Water and Wastewater End-User Industry
9.4 Others
10 Pipeline Network Management Market, By Region (Page No. - 87)
10.1 Introduction
10.2 North America
10.2.1 United States
10.2.1.1 Increasing Need to Avoid Hazards and Preserve the Environment to Drive the Growth of the Pipeline Network Market in the Region
10.2.2 Canada
10.2.2.1 Rising Importance of Oil and Gas in Economic Development of Canada
10.3 Europe
10.3.1 Russia
10.3.1.1 Constant Developments in the Pipeline Network and Supportive Government Initiatives to Drive the Growth of the Pipeline Network Market in Russia
10.3.2 United Kingdom
10.3.2.1 Government Hydrocarbon Policies and Vast Pipeline Network Owned By Various Stakeholders Led to the Rising Need for Pipeline Network Management
10.3.3 Germany
10.3.3.1 Development of Pipeline Network Infrastructure to Import Oil and Gas to Drive the Market in Germany
10.3.4 France
10.3.4.1 Growing Demand for Natural Gas Met By Pipeline Imports and Liquefied Natural Gas to Create a Potential Market for Pipeline Network Management in France
10.3.5 Rest of Europe
10.4 Asia Pacific
10.4.1 China
10.4.1.1 Rising Expertise in Water Treatment and Production Efficiency Technologies to Create the Need for the Pipeline Network Market in China
10.4.2 India
10.4.2.1 Rising Energy Demand and Growing Concern for Pipeline Operation Optimization to Boost the Pipeline Network Management in India
10.4.3 Australia
10.4.3.1 Rising Liquefied Natural Gas Industry to Boost Pipeline Infrastructure in Australia
10.4.4 Rest of Asia Pacific
10.5 Middle East and Africa
10.5.1 Iran
10.5.1.1 Ongoing Pipeline Development to Lead to the Growth of the Pipeline Network Market
10.5.2 Saudi Arabia
10.5.2.1 Large Pipeline Export of Petroleum Liquid to Drive the Demand for Pipeline Network Management Solutions in Saudi Arabia
10.5.3 Iraq
10.5.3.1 Presence of Huge Oil and Gas Reserves to Boost Pipeline Infrastructure in Iraq
10.5.4 United Arab Emirates
10.5.4.1 Rising Import of Natural Gas to Fuel the Growth of the Pipeline Network Market in the United Arab Emirates
10.5.5 Rest of Middle East and Africa
10.6 Latin America
10.6.1 Mexico
10.6.1.1 Rise in Gas Imports Led to Growing Demand for Pipeline Network Monitoring
10.6.2 Brazil
10.6.2.1 Government Ambitions to Improve Production Resulting in Boosting the Growth of Pipeline Network Management
10.6.3 Rest of Latin America
11 Competitive Landscape (Page No. - 128)
11.1 Competitive Leadership Mapping
11.1.1 Visionary Leaders
11.1.2 Innovators
11.1.3 Dynamic Differentiators
11.1.4 Emerging Companies
11.2 Strength of Product Portfolio (20 Players)
11.3 Business Strategy Excellence (20 Players)
11.4 Ranking of Top Market Players in the Pipeline Network Market, 2019
12 Company Profiles (Page No. - 133)
12.1 Huawei
(Business Overview, Solutions, Products & Services, Key Insights, Recent Developments, SWOT Analysis, MnM View)*
12.2 ABB
12.3 Siemens
12.4 Hitachi
12.5 Schneider Electric
12.6 PSI Software
12.7 Honeywell
12.8 General Electric
12.9 Wipro
12.10 Emerson
12.11 Cisco Systems
12.12 Rockwell Automation
12.13 Moxa
12.14 ORBCOMM
12.15 OptaSense
12.16 Pure Technologies
12.17 Necon Group
12.18 Sensornet
12.19 Open Access Technology International
12.20 KROHNE Group
12.21 Right-to-Win
*Details on Business Overview, Solutions, Products & Services, Key Insights, Recent Developments, SWOT Analysis, MnM View Might Not be Captured in Case of Unlisted Companies.
13 Appendix (Page No. - 170)
13.1 Industry Excerpts
13.2 Discussion Guide
13.3 Knowledge Store: Marketsandmarkets� Subscription Portal
13.4 Available Customizations
13.5 Related Reports
13.6 Author Details
List of Tables (103 Tables)
Table 1 United States Dollar Exchange Rate, 2016�2018
Table 2 Factor Analysis
Table 3 Pipeline Network Market Size, By Offering, 2017�2024 (USD Million)
Table 4 Offering: Market Size, By Solution, 2017�2024 (USD Million)
Table 5 Solutions: Market Size, By Region, 2017�2024 (USD Million)
Table 6 Operation Management and Control: Market Size, By Region, 2017�2024 (USD Million)
Table 7 Surveillance and Security: Market Size, By Region, 2017�2024 (USD Million)
Table 8 Communication System: Pipeline Network Market Size, By Region, 2017�2024 (USD Million)
Table 9 Pipeline GIS Software: Market Size, By Region, 2017�2024 (USD Million)
Table 10 Offering: Market Size, By Service, 2017�2024 (USD Million)
Table 11 Services: Pipeline Network Market Size, By Region, 2017�2024 (USD Million)
Table 12 Consulting: Market Size, By Region, 2017�2024 (USD Million)
Table 13 Integration and Deployment: Market Size, By Region, 2017�2024 (USD Million)
Table 14 Training, Support, and Maintenance: Market Size, By Region, 2017�2024 (USD Million)
Table 15 Pipeline Network Market Size, By Application, 2017�2024 (USD Million)
Table 16 Application: Market Size, By Pipeline Monitoring, 2017�2024 (USD Million)
Table 17 Pipeline Monitoring: Market Size, By Region, 2017�2024 (USD Million)
Table 18 Leak Detection: Market Size, By Region, 2017�2024 (USD Million)
Table 19 Pipeline Break Detection: Pipeline Network Market Size, By Region, 2017�2024 (USD Million)
Table 20 Operating Condition: Market Size, By Region, 2017�2024 (USD Million)
Table 21 Other Pipeline Monitoring Applications: Market Size, By Region, 2017�2024 (USD Million)
Table 22 Pipeline Operation Optimization: Market Size, By Region, 2017�2024 (USD Million)
Table 23 Pipeline Network Market Size, By Content, 2017�2024 (USD Million)
Table 24 Gas Pipeline: Market Size, By Region, 2017�2024 (USD Million)
Table 25 Liquid Pipeline: Market Size, By Region, 2017�2024 (USD Million)
Table 26 Pipeline Network Market Size, By End-User Industry, 2017�2024 (USD Million)
Table 27 End-User Industry: Market Size, By Crude and Refined Petroleum, 2017�2024 (USD Million)
Table 28 Crude and Refined Petroleum: Market Size, By Region, 2017�2024 (USD Million)
Table 29 Natural Gas: Pipeline Network Market Size, By Region, 2017�2024 (USD Million)
Table 30 Oil: Market Size, By Region, 2017�2024 (USD Million)
Table 31 Biofuel: Market Size, By Region, 2017�2024 (USD Million)
Table 32 Water and Wastewater: Market, By Region, 2017�2024 (USD Million)
Table 33 Other End-User Industry: Pipeline Network Market Size, By Region, 2017�2024 (USD Million)
Table 34 Pipeline Network Market Size, By Region, 2017�2024 (USD Million)
Table 35 North America: Market Size, By Offering, 2017�2024 (USD Million)
Table 36 North America: Market Size, By Solution, 2017�2024 (USD Million)
Table 37 North America: Market Size, By Service, 2017�2024 (USD Million)
Table 38 North America: Pipeline Network Market Size, By Application, 2017�2024 (USD Million)
Table 39 North America: Market Size, By Pipeline Monitoring, 2017�2024 (USD Million)
Table 40 North America: Market Size, By Content, 2017�2024 (USD Million)
Table 41 North America: Market Size, By End-User Industry, 2017�2024 (USD Million)
Table 42 North America: Market Size, By Crude and Refined Petroleum, 2017�2024 (USD Million)
Table 43 North America: Pipeline Network Market Size, By Country, 2017�2024 (USD Million)
Table 44 United States: Pipeline Network Market Size, By Offering, 2017�2024 (USD Million)
Table 45 United States: Market Size, By Solution, 2017�2024 (USD Million)
Table 46 United States: Market Size, By Service, 2017�2024 (USD Million)
Table 47 United States: Market Size, By Application, 2017�2024 (USD Million)
Table 48 United States: Pipeline Network Market Size, By Pipeline Monitoring, 2017�2024 (USD Million)
Table 49 United States: Market Size, By Content, 2017�2024 (USD Million)
Table 50 United States: Market Size, By End-User Industry, 2017�2024 (USD Million)
Table 51 United States: Market Size, By Crude and Refined Petroleum, 2017�2024 (USD Million)
Table 52 Europe: Pipeline Network Market, By Offering, 2017�2024 (USD Million)
Table 53 Europe: Market Size, By Solution, 2017�2024 (USD Million)
Table 54 Europe: Market Size, By Service, 2017�2024 (USD Million)
Table 55 Europe: Market Size, By Application, 2017�2024 (USD Million)
Table 56 Europe: Pipeline Network Market Size, By Pipeline Monitoring, 2017�2024 (USD Million)
Table 57 Europe: Market Size, By Content, 2017�2024 (USD Million)
Table 58 Europe: Market Size, By End-User Industry, 2017�2024 (USD Million)
Table 59 Europe: Market Size, By Crude and Refined Petroleum, 2017�2024 (USD Million)
Table 60 Europe: Pipeline Network Market Size, By Country, 2017�2024 (USD Million)
Table 61 Russia: Pipeline Network Market Size, By Offering, 2017�2024 (USD Million)
Table 62 Russia: Market Size, By Solution, 2017�2024 (USD Million)
Table 63 Russia: Market Size, By Service, 2017�2024 (USD Million)
Table 64 Russia: Market Size, By Application, 2017�2024 (USD Million)
Table 65 Russia: Market Size, By Pipeline Monitoring, 2017�2024 (USD Million)
Table 66 Russia: Market Size, By Content, 2017�2024 (USD Million)
Table 67 Russia: Market Size, By End-User Industry, 2017�2024 (USD Million)
Table 68 Russia: Pipeline Network Market Size, By Crude and Refined Petroleum, 2017�2024 (USD Million)
Table 69 Asia Pacific: Pipeline Network Market Size, By Offering, 2017�2024 (USD Million)
Table 70 Asia Pacific: Market Size, By Solution, 2017�2024 (USD Million)
Table 71 Asia Pacific: Market Size, By Service, 2017�2024 (USD Million)
Table 72 Asia Pacific: Market Size, By Application, 2017�2024 (USD Million)
Table 73 Asia Pacific: Market Size, By Pipeline Monitoring, 2017�2024 (USD Million)
Table 74 Asia Pacific: Market Size, By Content, 2017�2024 (USD Million)
Table 75 Asia Pacific: Market Size, By End-User Industry, 2017�2024 (USD Million)
Table 76 Asia Pacific: Market Size, By Crude and Refined Petroleum, 2017�2024 (USD Million)
Table 77 Asia Pacific: Pipeline Network Market Size, By Country, 2017�2024 (USD Million)
Table 78 China: Pipeline Network Market Size, By Offering, 2017�2024 (USD Million)
Table 79 China: Market Size, By Solution, 2017�2024 (USD Million)
Table 80 China: Market Size, By Service, 2017�2024 (USD Million)
Table 81 China: Market Size, By Application, 2017�2024 (USD Million)
Table 82 China: Market Size By Pipeline Monitoring, 2017�2024 (USD Million)
Table 83 China: Market Size, By Content, 2017�2024 (USD Million)
Table 84 China: Market Size, By End-User Industry, 2017�2024 (USD Million)
Table 85 China: Pipeline Network Market Size By Crude and Refined Petroleum, 2017�2024 (USD Million)
Table 86 Middle East and Africa: Pipeline Network Market Size, By Offering, 2017�2024 (USD Million)
Table 87 Middle East and Africa: Market Size, By Solution, 2017�2024 (USD Million)
Table 88 Middle East and Africa: Market Size, By Service, 2017�2024 (USD Million)
Table 89 Middle East and Africa: Market Size, By Application, 2017�2024 (USD Million)
Table 90 Middle East and Africa: Pipeline Network Market Size, By Pipeline Monitoring, 2017�2024 (USD Million)
Table 91 Middle East and Africa: Market Size, By Content, 2017�2024 (USD Million)
Table 92 Middle East and Africa: Market Size, By End-User Industry, 2017�2024 (USD Million)
Table 93 Middle East and Africa: Market Size, By Crude and Refined Petroleum, 2017�2024 (USD Million)
Table 94 Middle East and Africa: Pipeline Network Market Size, By Country, 2017�2024 (USD Million)
Table 95 Latin America: Pipeline Network Market Size, By Offering, 2017�2024 (USD Million)
Table 96 Latin America: Market Size, By Solution, 2017�2024 (USD Million)
Table 97 Latin America: Market Size, By Service, 2017�2024 (USD Million)
Table 98 Latin America: Market Size, By Application, 2017�2024 (USD Million)
Table 99 Latin America: Pipeline Network Market Size, By Pipeline Monitoring, 2017�2024 (USD Million)
Table 100 Latin America: Market Size, By Content, 2017�2024 (USD Million)
Table 101 Latin America: Market Size, By End-User Industry, 2017�2024 (USD Million)
Table 102 Latin America: Market Size, By Crude and Refined Petroleum, 2017�2024 (USD Million)
Table 103 Latin America: Pipeline Network Market Size, By Country, 2017�2024 (USD Million)
List of Figures (46 Figures)
Figure 1 Global Pipeline Network Market: Research Design
Figure 2 Pipeline Network Market: Top-Down and Bottom-Up Approaches
Figure 3 Competitive Leadership Mapping: Criteria Weightage
Figure 4 Pipeline Network Market Size, 2017�2024
Figure 5 Solutions Segment to Lead the Pipeline Network Market in 2019
Figure 6 Operation Management and Control Segment to Account for the Largest Market Size in 2019
Figure 7 Training, Support, and Maintenance Segment to Lead the Pipeline Network Management From 2019 to 2024
Figure 8 Pipeline Monitoring Segment to Account for a Higher Market Share Compared to the Pipeline Operation Optimization Segment in 2019
Figure 9 Leak Detection Segment to Account for the Highest Market Share During the Forecast Period
Figure 10 Gas Pipeline Segment to Account for a Higher Market Share Compared to the Liquid Pipeline Segment in 2019
Figure 11 Crude and Refined Petroleum Segment to Lead the Pipeline Network Market During the Forecast Period
Figure 12 Pipeline Network Market: Regional Snapshot
Figure 13 Asia Pacific to Grow at the Highest CAGR From 2019 to 2024
Figure 14 Growing Security and Mandatory Regulations for Pipeline Network Solutions to Provide Growth Opportunity to the Market During the Forecast Period
Figure 15 Solutions Segment and United States Region to Lead North America Pipeline Network Market in 2019
Figure 16 Iran and China to Grow at the Highest CAGR During the Forecast Period
Figure 17 Pipeline Network Market: Drivers, Restraints, Opportunities, and Challenges
Figure 18 Number of Connections in Vertical Sectors By 2025
Figure 19 Services Segment to Grow at a Higher CAGR During the Forecast Period
Figure 20 Communication System Segment to Grow at the Highest CAGR During the Forecast Period
Figure 21 Training, Support, and Maintenance Segment to Grow at the Highest CAGR During the Forecast Period
Figure 22 Pipeline Operation Optimization Segment to Grow at a Higher CAGR During the Forecast Period
Figure 23 Leak Detection Segment to Grow at the Highest CAGR During the Forecast Period
Figure 24 Liquid Pipeline Segment to Register a Higher CAGR During the Forecast Period
Figure 25 Crude and Refined Petroleum End-User Industry to Grow at the Highest CAGR From 2019 to 2024
Figure 26 Oil End-User Industry to Register the Highest CAGR During the Forecast Period
Figure 27 Asia Pacific to Exhibit the Highest CAGR in the Pipeline Network Market During the Forecast Period
Figure 28 North America: Market Snapshot
Figure 29 Asia Pacific: Market Snapshot
Figure 30 Pipeline Network Market (Global), Competitive Leadership Mapping, 2019
Figure 31 Ranking of Top Market Players, 2019
Figure 32 Huawei: Company Snapshot
Figure 33 Huawei: SWOT Analysis
Figure 34 ABB: Company Snapshot
Figure 35 ABB: SWOT Analysis
Figure 36 Siemens: Company Snapshot
Figure 37 Siemens: SWOT Analysis
Figure 38 Hitachi: Company Snapshot
Figure 39 Hitachi: SWOT Analysis
Figure 40 Schneider Electric: Company Snapshot
Figure 41 Schneider Electric: SWOT Analysis
Figure 42 PSI Software: Company Snapshot
Figure 43 Honeywell: Company Snapshot
Figure 44 General Electric: Company Snapshot
Figure 45 Wipro: Company Snapshot
Figure 46 Emerson: Company Snapshot
The study consisted of 4 major activities to estimate the current market size of the pipeline network market. Extensive secondary research was done to collect information on the market, the peer market, and the parent market. The next step was to validate these findings, assumptions, and market sizing with industry experts across the value chain through primary research. Both top-down and bottom-up approaches were employed to estimate the complete market size. Thereafter, the market breakup and data triangulation procedures were used to estimate the market size of the segments and subsegments of the pipeline network market.
Secondary Research
In the secondary research process, various secondary sources such as D&B Hoovers and Bloomberg BusinessWeek were referred to for identifying and collecting information for the study. Secondary sources included annual reports, press releases, and investor presentations of companies; whitepapers, certified publications, and articles by recognized authors; gold standard and silver standard websites; Research and Development (R&D) organizations; regulatory bodies; and databases.
Primary research
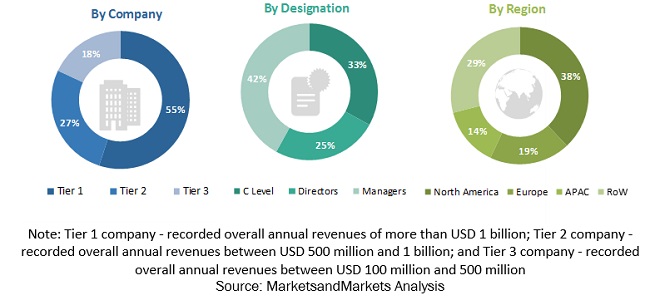
Various primary sources from both supply and demand sides of the pipeline network market were interviewed to obtain qualitative and quantitative information for the study. The primary sources from the supply side included industry experts, such as Chief Executive Officers (CEOs), Vice Presidents (VPs), marketing directors, technology and innovation directors, and related key executives from various vendors of pipeline network management solutions, associated service providers, and system integrators operating in the targeted regions. All possible parameters that affect the market covered in this research study have been accounted for, viewed in extensive detail, verified through primary research, and analyzed to get the final quantitative and qualitative data. Following is the profile breakup of primary respondents:
To know about the assumptions considered for the study, download the pdf brochure
Market Size Estimation
Both top-down and bottom-up approaches were used to estimate and validate the total size of the pipeline network market. The methods were also used extensively to estimate the size of various subsegments in the market. The research methodology used to estimate the market size includes the following:
- Key players in the market were identified through extensive secondary research.
- The market size, in terms of value, was determined through primary and secondary research processes.
- All percentage shares, splits, and breakups were determined using secondary sources and verified through primary sources.
Data Triangulation
With data triangulation and validation through primary interviews, the exact value of the overall parent market size was determined and confirmed using the study. The overall market size was then used in the top-down procedure to estimate the size of other individual markets via percentage splits of the market segmentation.
Report Objectives
- To determine and forecast the global pipeline network market by offering, application, content, end-user industry, and region, with respect to individual growth trends and contributions toward the overall market
- To forecast the size of the market segments with respect to 5 main regions, namely, North America, Europe, Asia Pacific (APAC), Latin America, and Middle East and Africa (MEA)
- To provide detailed information related to the major factors (drivers, restraints, opportunities, and challenges) influencing the growth of the pipeline network market
- To analyze each submarket with respect to individual growth trends, prospects, and contributions to the total pipeline network market
- To profile key market players comprising top vendors and startups, provide comparative analysis based on business overviews, regional presence, product offerings, business strategies, and key financials, and to illustrate the market�s competitive landscape
- To track and analyze competitive developments, such as Mergers and Acquisitions (M&A); new product launches and product enhancements; agreements, collaborations, and partnerships; expansions; and Research and Development (R&D) activities, in the pipeline network market
Available Customizations
With the given market data, MarketsandMarkets offers customizations as per the company�s specific needs. The following customization options are available for the report:
Geographic Analysis
- Further breakup of the Canadian Pipeline network market, by offering
- Further breakup of the UK market, by offering
- Further breakup of the Indian market, by offering
- Further breakup of the Iranian market, by offering
Company Information
- Detailed analysis and profiling of additional market players up to 5


Growth opportunities and latent adjacency in Pipeline Network Market
Hello! I am interested in the spot price of WTI / USD - Crude Oil WTI Spot US Dollar. Can I find it here