
Plant Activators Market by Crop Type (Fruits & Vegetables, Cereals & Grains, Oilseeds & Pulses, Turf & Ornamentals), Mode of Application (Foliar Spray, Soil Treatment), Source (Biological, Chemical), Form, and Region - Global Forecast to 2023
Market Segmentation
| Report Metrics | Details |
|
Market size available for years |
2018 - 2023 |
|
CAGR % |
6.6 |
Top 10 companies in Plant Activators Market
Plant Activators Market News


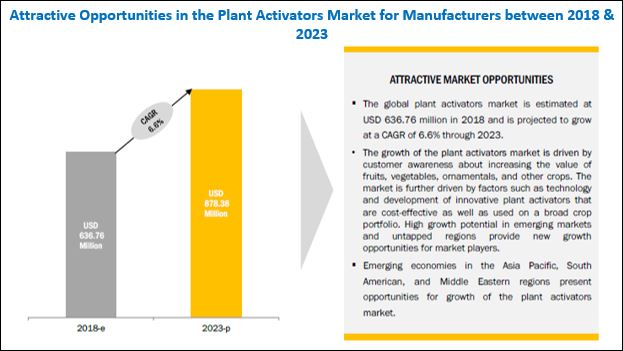
[144 Pages Report] The plant activators market stood at USD 597.14 Million in 2017; it is projected to grow at a CAGR of 6.6% from 2018, to reach USD 878.38 Million by 2023. The base year considered for the study is 2017 and the forecast period is from 2018 to 2023. The main objective of the report is to define, segment, and project the global market size for plant activators on the basis of crop type, source, form, mode of application, and region. It also helps to understand the structure of the market by identifying its various segments. The other objectives include analyzing the opportunities in the market for stakeholders and providing a competitive landscape of market trends, analyzing the macro and micro indicators of this market, and projecting the size of the plant activators market and its submarkets, in terms of value as well as volume.
For More details on this research, Request Free Sample Report
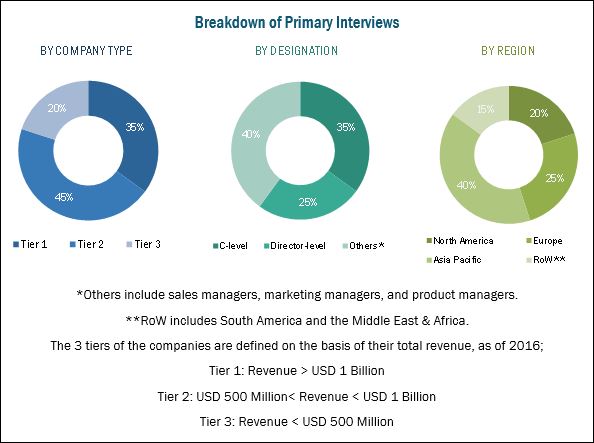
This report includes estimations of the market size in terms of value (USD million) and volume (KT). Both, the top-down and bottom-up approaches have been used to estimate and validate the size of the global market and to estimate the size of various other dependent submarkets in the overall market. The key players in the market have been identified through secondary research; some of these sources are press releases, paid databases such as Factiva and Bloomberg, annual reports, and financial journals; their market shares in respective regions have also been determined through primary and secondary research. All percentage shares, splits, and breakdowns have been determined using secondary sources and verified through primary sources. The figure below shows the breakdown of profiles of industry experts that participated in the primary discussions.
To know about the assumptions considered for the study, download the pdf brochure
Key participants in the plant activators market are manufacturers, irrigation system manufacturers & suppliers, end users, and retail channels/supermarkets. The key players that are profiled in the report include Syngenta (Switzerland), Isagro (Italy), Plant Health Care (US), Arysta LifeScience (US), Nihon Nohyaku Co., Ltd. (Japan), Meiji Seika (Japan), Certis (US), Gowan (US), Futureco Bioscience (Spain), NutriAg (Canada), and Eagle Plant Protect Pvt. Ltd. (India).
This report is targeted at the existing stakeholders in the industry, which include the following:
- Regulatory and research organizations
- Raw material producers, suppliers, and distributors
- Plant activators manufacturers, traders, distributors, and dealers
- Irrigation system manufacturers and suppliers
- Research and consulting firms
“The study answers several questions for stakeholders, primarily which market segments to focus on in the next two to five years for prioritizing efforts and investments.”
Get online access to the report on the World's First Market Intelligence Cloud
- Easy to Download Historical Data & Forecast Numbers
- Company Analysis Dashboard for high growth potential opportunities
- Research Analyst Access for customization & queries
- Competitor Analysis with Interactive dashboard
- Latest News, Updates & Trend analysis

Scope of the Report
The plant activators market has been segmented as follows:
On the basis of Crop Type,
- Fruits & vegetables
- Cereals & grains
- Oilseeds & pulses
- Turf & ornamentals
On the basis of Form,
- Water-dispersible & water-soluble granules
- Solutions
- Wettable powders
On the basis of Mode of Application,
- Foliar spray
- Soil treatment
- Others (Seed treatment, trunk injection, and soil drenching)
On the basis of Source,
- Biological
- Chemical
On the basis of Region,
- North America
- Europe
- Asia Pacific
- RoW (South America and the Middle East & Africa)
Available Customizations
With the given market data, MarketsandMarkets offers customizations according to the company’s specific needs.
The following customization options are available for the report:
Segment Analysis
- Product matrix, which gives a detailed comparison of the product portfolio of each company
Regional Analysis
- Further breakdown of the Rest of Asia Pacific market for plant activators , by country
- Further breakdown of the Rest of Europe market for plant activators, by country
- Further breakdown of the South American market for plant activators, by country
- Further breakdown of the Middle Eastern & African market for plant activators, by country
Company Information
- Detailed analysis and profiling of additional market players (up to five)
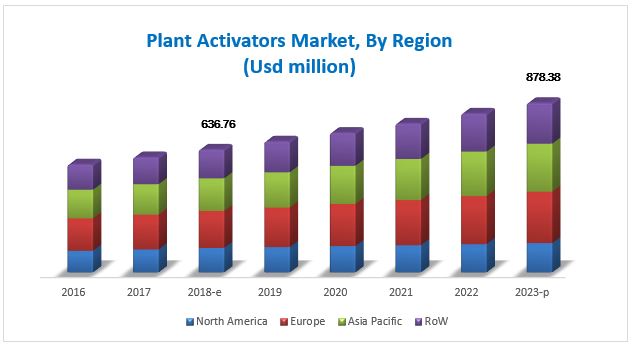
The plant activators market is projected to grow at a CAGR of 6.6%, to reach a value of USD 878.38 Million by 2023 from USD 636.76 Million in 2018. Plant activators are chemicals that induce plant defense responses to a broad spectrum of pathogens. They activate the defense genes in plants by providing signals via the signal transduction pathway mediated by salicylic acid. Since plant activators do not have any pesticide or antibiotic activity, their adverse effects on human health and the environment are minimal. In addition, since they do not interact directly with the pathogens, it is unlikely that plant pathogens develop resistance to these chemicals.
On the basis of source, the biological segment dominated the plant activators market in 2017. Biological plant activators play an important role in plant growth as they help improve nutrient use efficiency. Biological products are made from naturally occurring substances that can work alone as well as complement traditional methods of plant production and protection. Their benefits include improving crop nutrient, promoting growth & yield, and providing insect control and disease protection. The high cost of developing new chemical pesticides, increase in insect & weed resistance to chemical treatments, and high regulatory pressure to limit chemical usage with respect to ecosystem damage have contributed to the need for these biological products
On the basis of crop type, the fruits & vegetables segment accounted for the largest market share; this can be attributed to growing health-consciousness among consumers and rising incomes which result in increased consumption of a wide variety of products, particularly fruits & vegetables. The rise in the production of fruits & vegetables results in an increased demand for plant activators. The high export potential of these products has also led to an increase in production levels. In North America and Europe, health concerns are driving the demand for organic fruits & vegetables, as consumers prefer healthier and more nutritious options in their diet.
On the basis of form, the market was led by the solutions segment in 2017. Solution compositions, also known as flowable concentrates, are mainly in the form of emulsifiable suspensions or soluble liquid concentrates. Solution formulations are mainly preferred as they do not cause dust formation on spraying, do not cause toxicity or flammability, provide high efficiency due to smaller particle size, and low packaging volume. Moreover, foliar spray is the most widely used mode of application owing to its ease of application and high effectiveness.
Europe accounted for the largest market share for plant activators in 2017. Owing to the decreasing agricultural land in Europe, optimization of available arable land has gained increasing importance in the region, which, in turn, drives the demand for plant growth regulators. Plant activators have been receiving wide-scale acceptance as they are expected to increase long-term agricultural productivity and help realize the goal of food self-adequacy.
For more details on this research, Request Free Sample Report
The Asia Pacific region is an emerging market with investments from several multinational manufacturers, especially in countries such as China, New Zealand, and Japan.
The availability of plant activator products still remains limited in the market, due to different regulations being prevalent in different countries. Moreover, there is a high dependence on chemical products in developing regions. These factors are expected to restrain the growth of the plant activators market.
Companies such as Syngenta (Switzerland), Isagro (Italy), Plant Health Care (US), Arysta LifeScience (US), and Nihon Nohyaku Co., Ltd. (Japan) have acquired leading market positions in the market through the provision of a broad portfolio, catering to the varied requirements of the market, along with a focus on the diverse end-user segments. They are also focused on innovation and are geographically diversified.
To speak to our analyst for a discussion on the above findings, click Speak to Analyst
Table of Contents
1 Introduction (Page No. - 15)
1.1 Objectives of the Study
1.2 Market Definition
1.3 Market Scope
1.4 Periodization
1.5 Currency
1.6 Unit
1.7 Stakeholders
2 Research Methodology (Page No. - 19)
2.1 Research Data
2.1.1 Secondary Data
2.1.1.1 Key Data From Secondary Sources
2.1.2 Primary Data
2.1.2.1 Breakdown of Primaries, By Company Type, Designation, and Region
2.1.2.2 Key Industry Insights
2.2 Market Size Estimation
2.2.1 Bottom-Up Approach
2.2.2 Top-Down Approach
2.3 Market Breakdown & Data Triangulation
2.4 Research Assumptions & Limitations
2.4.1 Assumptions
2.4.2 Limitations
3 Executive Summary (Page No. - 28)
4 Premium Insights (Page No. - 33)
4.1 Market Opportunities for Plant Activator Manufacturers
4.2 Plant Activators Market Size Growth Trend, By Region (KT)
4.3 Europe: Plant Activators Market, By Country & Type
4.4 Plant Activators Market, By Source
5 Market Overview (Page No. - 37)
5.1 Introduction
5.2 Market Dynamics
5.2.1 Drivers
5.2.1.1 Increase in Farm Expenditure
5.2.1.2 Heavy Crop Loss Due to Pest Attacks
5.2.1.3 Pest Resistance and Integrated Pest Management (IPM) Measures
5.2.1.4 Evolution of Farming Practices & Technology
5.2.2 Restraints
5.2.2.1 Limited Product Availability
5.2.2.2 High Dependence on Chemical Products in Developing Regions
5.2.3 Opportunities
5.2.3.1 Rise in Investment in Agricultural Activities in Developing Countries
5.2.4 Challenges
5.2.4.1 Lack of Infrastructure
5.2.4.2 Limited Awareness Regarding Benefits of Plant Activators
5.3 Supply Chain Analysis
5.4 Plant Activators Market: Regulatory Framework
6 Plant Activators Market, By Crop Type (Page No. - 45)
6.1 Introduction
6.2 Fruits & Vegetables
6.2.1 Berries
6.2.2 Citrus Fruits
6.2.3 Pome Fruits
6.2.4 Root and Tuber Vegetables
6.2.5 Leafy Vegetables
6.2.6 Other Fruits & Vegetables
6.3 Cereals & Grains
6.3.1 Wheat
6.3.2 Rice
6.3.3 Corn
6.3.4 Others
6.4 Oilseeds & Pulses
6.4.1 Cotton Seed
6.4.2 Soybean
6.4.3 Sunflower & Rapeseed
6.4.4 Others
6.5 Turf & Ornamentals
7 Plant Activators Market, By Mode of Application (Page No. - 57)
7.1 Introduction
7.2 Foliar Spray
7.3 Soil Treatment
7.4 Other Modes of Application
8 Plant Activators Market, By Source (Page No. - 65)
8.1 Introduction
8.2 Biological
8.3 Chemical
9 Plant Activators Market, By Form (Page No. - 71)
9.1 Introduction
9.2 Solutions
9.3 Water-Dispersible & Water-Soluble Granules
9.4 Wettable Powders
10 Plant Activators Market, By Region (Page No. - 78)
10.1 Introduction
10.2 North America
10.2.1 US
10.2.2 Canada
10.2.3 Mexico
10.3 Europe
10.3.1 Germany
10.3.2 UK
10.3.3 France
10.3.4 Rest of Europe
10.4 Asia Pacific
10.4.1 China
10.4.2 India
10.4.3 Australia & New Zealand
10.4.4 Japan
10.4.5 Rest of Asia Pacific
10.5 RoW
10.5.1 South America
10.5.2 The Middle East & Africa
11 Competitive Landscape (Page No. - 105)
11.1 Overview
11.1.1 Key Market Strategies
11.2 Competitive Scenario
11.2.1 Expansions & Investments
11.2.2 Investments & Expansions, 2016-2017
11.2.3 Mergers & Acquisitions
11.2.4 Agreements, Partnerships, Collaborations, and Joint Ventures
11.2.5 New Product Launches
12 Company Profiles (Page No. - 109)
(Business Overview, Products Offered, Recent Developments, SWOT Analysis, MnM View)*
12.1 Introduction
12.2 Syngenta
12.3 Isagro S.P.A
12.4 BASF
12.5 Plant Health Care, Inc.
12.6 Arysta Lifescience
12.7 Nihon Nohyaku Co., Ltd
12.8 Meiji Seika Kaisha Ltd
12.9 Certis USA
12.10 Gowan Company, LLC
12.11 Futureco Bioscience
12.12 NutriAg Inc.
12.13 Eagle Plant Protect Pvt. Ltd.
*Details on Business Overview, Products Offered, Recent Developments, SWOT Analysis, MnM View Might Not Be Captured in Case of Unlisted Companies.
13 Appendix (Page No. - 137)
13.1 Discussion Guide
13.2 Knowledge Store: Marketsandmarkets’ Subscription Portal
13.3 Introducing RT: Real Time Market Intelligence
13.4 Available Customizations
13.5 Related Reports
13.6 Author Details
List of Tables (80 Tables)
Table 1 US Dollar Exchange Rate Considered for Study, 2014–2017
Table 2 US: Farm Expenditure, 2007 vs 2011 (USD Million)
Table 3 Regulatory Authorities for Plant Activators, By Key Country/Region
Table 4 Plant Activators Market Size, By Crop Type, 2016–2023 (USD Million)
Table 5 Market Size, By Crop Type, 2016–2023 (KT)
Table 6 Plant Activators Market Size in Fruits & Vegetables, By Region, 2016–2023 (USD Million)
Table 7 Market Size in Fruits & Vegetables, By Region, 2016–2023 (KT)
Table 8 Market Size in Fruits & Vegetables, By Crop Type, 2016–2023 (USD Million)
Table 9 Market Size in Cereals & Grains, By Region, 2016–2023 (USD Million)
Table 10 Market Size in Cereals & Grains, By Region, 2016–2023 (KT)
Table 11 Market Size in Cereals & Grains, By Crop, 2016–2023 (USD Million)
Table 12 Market Size in Oilseeds & Pulses, By Region, 2016–2023 (USD Million)
Table 13 Market Size in Oilseeds & Pulses, By Region, 2016–2023 (KT)
Table 14 Market Size in Oilseeds & Pulses, By Crop, 2016–2023 (USD Million)
Table 15 Plants Activators Market Size in Turf & Ornamentals, By Region, 2016–2023 (USD Million)
Table 16 Market Size in Turf & Ornamentals Plant Activators Market Size, By Region, 2016–2023 (KT)
Table 17 Market Size in Turf & Ornamentals, 2016–2023 (USD Million)
Table 18 Market Size, By Mode of Application, 2016–2023 (USD Million)
Table 19 Market Size, By Mode of Application, 2016–2023 (KT)
Table 20 Foliar Spray Market Size, By Region, 2016–2023 (USD Million)
Table 21 Foliar Spray Market Size, By Region, 2016–2023 (KT)
Table 22 Soil Treatment Market Size, By Region, 2016–2023 (USD Million)
Table 23 Soil Treatment Market Size, By Region, 2016–2023 (KT)
Table 24 Other Modes of Application Market Size, By Region, 2016–2023 (USD Million)
Table 25 Other Modes of Application Market Size, By Region, 2016–2023 (USD Million)
Table 26 Plant Activators Market Size, By Source, 2016–2023 (USD Million)
Table 27 Market Size, By Source, 2016–2023 (KT)
Table 28 Biological Plant Activators Market Size, By Region, 2016–2023 (USD Million)
Table 29 Biological Plant Activators Market Size, By Region, 2016–2023 (KT)
Table 30 Chemical Plant Activators Market Size, By Region, 2016–2023 (USD Million)
Table 31 Chemical Plant Activators Market Size, By Region, 2016–2023 (KT)
Table 32 Plant Activators Market Size, By Form, 2016–2023 (USD Million)
Table 33 Market Size, By Form, 2016–2023 (KT)
Table 34 Solutions Market Size, By Region, 2016–2023 (USD Million)
Table 35 Solutions Market Size, By Region, 2018–2023 (KT)
Table 36 Water-Dispersible & Water-Soluble Granules Market, By Region, 2016 - 2023 (USD Million)
Table 37 Water-Dispersible & Water-Soluble Granules Market, By Region, 2016–2023 (KT)
Table 38 Wettable Powder Market Size, By Region, 2016–2023 (USD Million)
Table 39 Wettable Powders Market Size, By Region, 2016-2023 (KT)
Table 40 Plant Activators Market Size, By Region, 2016–2023 (USD Million)
Table 41 Market Size, By Region, 2016–2023 (KT)
Table 42 North America: Market Size, By Country, 2016–2023 (USD Million)
Table 43 North America: Market Size, By Mode of Application, 2016–2023 (USD Million)
Table 44 North America: Market Size, By Mode of Application, 2016–2023 (KT)
Table 45 North America: Market Size, By Crop Type, 2016–2023 (USD Million)
Table 46 North America: Market Size, By Crop Type, 2016–2023 (KT)
Table 47 North America: Market Size, By Source, 2016–2023 (USD Million)
Table 48 North America: Market Size, By Source, 2016–2023 (KT)
Table 49 North America: Market Size, By Form, 2016–2023 (USD Million)
Table 50 North America: Market Size, By Form, 2016–2023 (KT)
Table 51 Europe: Plant Activators Market Size, By Country, 2016–2023 (USD Million)
Table 52 Europe: Market Size, By Mode of Application, 2016–2023 (USD Million)
Table 53 Europe: Market Size, By Mode of Application, 2016–2023 (KT)
Table 54 Europe: Market Size, By Crop Type, 2016–2023 (USD Million)
Table 55 Europe: Market Size, By Crop Type, 2016–2023 (KT)
Table 56 Europe: Market Size, By Source, 2016–2023 (USD Million)
Table 57 Europe: Market Size, By Source, 2016–2023 (KT)
Table 58 Europe: Market Size, By Form, 2016–2023 (USD Million)
Table 59 Europe: Market Size, By Form, 2016–2023 (KT)
Table 60 Asia Pacific: Market Size, By Country, 2016–2023 (USD Million)
Table 61 Asia Pacific: Market Size, By Crop Type, 2016–2023 (USD Million)
Table 62 Asia Pacific: Market Size, By Crop Type, 2016–2023 (KT)
Table 63 Asia Pacific: Market Size, By Form, 2016–2023 (USD Million)
Table 64 Asia Pacific: Market Size, By Form, 2016–2023 (KT)
Table 65 Asia Pacific: Market Size, By Mode of Application, 2016–2023 (USD Million)
Table 66 Asia Pacific: Market Size, By Mode of Application, 2016–2023 (KT)
Table 67 Asia Pacific: Market Size, By Source, 2016–2023 (USD Million)
Table 68 Asia Pacific: Market Size, By Source, 2016–2023 (KT)
Table 69 RoW: Market Size, By Region, 2016–2023 (USD Million)
Table 70 RoW: Market Size, By Crop Type, 2016–2023 (USD Million)
Table 71 RoW: Market Size, By Crop Type, 2016–2023 (KT)
Table 72 RoW: Market Size, By Form, 2016–2023 (USD Million)
Table 73 RoW: Market Size, By Form, 2016–2023 (KT)
Table 74 RoW: Market Size, By Mode of Application, 2016–2023 (USD Million)
Table 75 RoW: Market Size, By Mode of Application, 2016–2023 (KT)
Table 76 RoW: Market Size, By Source, 2016–2023 (USD Million)
Table 77 RoW: Plant Activators Market Size, By Source, 2016–2023 (KT)
Table 78 Mergers & Acquisitions, 2017–2018
Table 79 Agreements, Partnerships, Collaborations, and Joint Ventures, 2014–2018
Table 80 New Product Launches, 2013
List of Figures (43 Figures)
Figure 1 Market Segmentation: Plant Activators Market
Figure 2 Regional Segmentation
Figure 3 Plant Activators Market: Research Design
Figure 4 Market Size Estimation Methodology: Bottom-Up Approach
Figure 5 Market Size Estimation Methodology: Top-Down Approach
Figure 6 Data Triangulation
Figure 7 Assumptions of the Research Study
Figure 8 Limitations of the Research Study
Figure 9 Biological Plant Activators to Dominate the Market, By Source, 2018 vs 2023
Figure 10 Fruits & Vegetables Segment to Dominate the Plant Activators Market, 2018 vs 2023 (USD Million)
Figure 11 Solutions Segment to Dominate the Plant Activators Market through the Forecast Period (USD Million)
Figure 12 Plant Activators Regional Snapshot
Figure 13 Attractive Growth Opportunities in the Plant Activators Market for Manufacturers Between 2018 & 2023
Figure 14 Market Size of Plant Activators From 2016 to 2023 (KT)
Figure 15 Germany is Estimated to Account for the Largest Share of the European Plant Activators Market in 2018
Figure 16 Biological Plant Activators Dominated the Market in 2017 (USD Million)
Figure 17 Plant Activators Market: Drivers, Restraints, Opportunities, and Challenges
Figure 18 US: Farm Production Expenditure, 2002–2016 (USD)
Figure 19 Rising Global Trend of Setting Up Agricultural Investment Fund
Figure 20 Fruits & Vegetables Segment Projected to Dominate for the Next Five Years (USD Million)
Figure 21 Europe to Gain A Large Market Share for Fruits & Vegetables, 2018–2023 (USD Million)
Figure 22 Foliar Spray Segment is Projected to Dominate the Market Through 2023
Figure 23 Europe to Dominate the Foliar Spray Market Through 2023
Figure 24 Biological Segment Projected to Dominate the Market During the Forecast
Figure 25 Biological Plant Activators Market Size, By Region, 2018 vs 2023 (USD Million)
Figure 26 Market Size, By Form, 2018 vs 2023 (USD Million)
Figure 27 Geographic Snapshot (2018–2023): Rapidly Growing Markets are Emerging as New Hotspots
Figure 28 North America: Plant Activators Market Snapshot
Figure 29 Germany Held the Largest Share in the Plant Activators Market in Europe
Figure 30 Asia Pacific: Market Snapshot
Figure 31 Key Developments By Leading Players in the Plant Activators Market From 2013 to 2018
Figure 32 Plant Activators Market Developments, By Growth Strategy, 2013–2018
Figure 33 Syngenta: Company Snapshot
Figure 34 Syngenta: SWOT Analysis
Figure 35 Isagro: Company Snapshot
Figure 36 Isagro SpA: SWOT Analysis
Figure 37 BASF: Company Snapshot
Figure 38 BASF SE : SWOT Analysis
Figure 39 Plant Health Care, Inc.: Company Snapshot
Figure 40 Plant Health Care, Inc.: SWOT Analysis
Figure 41 Arysta LifeScience: SWOT Analysis
Figure 42 Nihon Nohyaku Co., Ltd: Company Snapshot
Figure 43 Nihon Nohyaku Co., Ltd: SWOT Analysis


Growth opportunities and latent adjacency in Plant Activators Market