
Plant Genomics Market by Objective (Extraction, Sequencing, Genotyping, Gene Expression, MAS, and GMO-trait Purity Testing), Type (Molecular Engineering and Genetic Engineering), Trait, Application, and Region - Global Forecast 2025
Market Segmentation
| Report Metrics | Details |
|
Market size available for years |
2019 - 2025 |
|
CAGR % |
8.3 |
Top 10 companies in Plant Genomics Market
Plant Genomics Market News


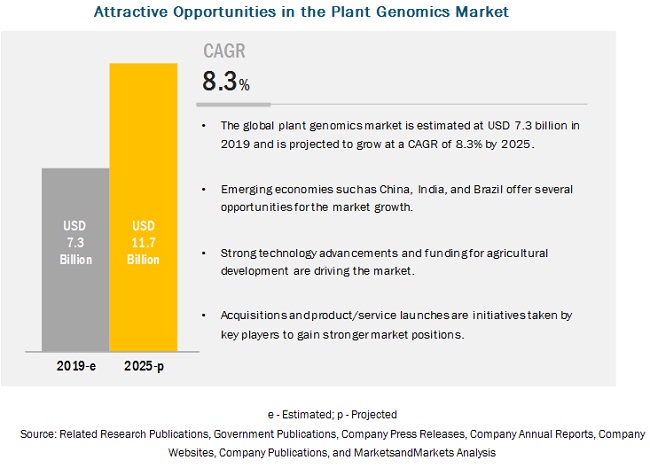
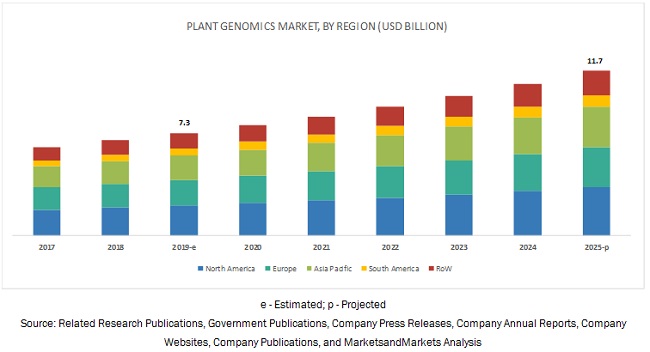
[267 Pages Report] The plant genomics market is estimated to account for a value of USD 7.3 billion in 2019 and is projected to grow at a CAGR of 8.3% from 2019, to reach a value of USD 11.7 billion by 2025. The increasing application of genomics in plant breeding and conservation of genetic resources are techniques that are gaining the attention of many researchers globally and are driving the growth of the market.
By type, the molecular engineering segment is projected to be the fastest-growing segment in the plant genomics market during the forecast period.
The molecular engineering segment in the market for plant genomics is projected to be the fastest-growing segment. Marker-assisted selection is the most widely adopted process in molecular breeding by key breeding entities, majorly for crop applications. Molecular plant engineering technologies have been rapidly adopted by developed countries such as the US, France, Germany, the Netherlands, and the UK, which jointly have a higher adoption rate. This means that this technology has immense growth potential on a commercial scale in developing economies.
By trait, the herbicide tolerance segment is projected to dominate the plant genomics market during the forecast period.
The herbicide tolerance segment is projected to hold the largest market share in the market during the forecast period, as according to industry experts from prominent seed manufacturers, disease resistance and herbicide tolerance are traits that have been on demand, owing to the increasing instances of early germination pest attacks and regulations against cop protection chemicals.
By application, the cereals & grains segment is projected to dominate the plant genomic market during the forecast period.
The adoption of modern plant sequencing techniques has been extensive in developed countries for crops such as corn and wheat; hence, cereals & grains formed the dominant application in 2018. The growth in the adoption of various molecular breeding types, such as molecular engineering and genetic engineering tools, would increase the performance of crops to gain better prices in the market. The plant genomic service companies are largely focusing on the development of major cereals & grains such as corn, wheat, rice, and other grains.
By objective, the DNA/RNA sequencing segment is projected to dominate the plant genomics market during the forecast period.
The DNA sequencing technologies used in plant genomics are Illumina HiSeq, next-generation sequencing, Pacific Biosciences long-read sequencing, 10x Genomics linked reads, Dovetail Hi-C, and BioNano Genomics optical maps. DNA sequencing is the process of determining the precise order of nucleotides within a DNA molecule. It includes any method or technology that is used to determine the order of the four bases�adenine, guanine, cytosine, and thymine�present in a strand of DNA.
The increasing demand for improved varieties in plants in the Asia Pacific region is driving the growth of the plant genomics market.
The key players in various countries of the Asia Pacific region are focusing on directing their investments toward biotechnology research on food crops and crops of high commercial value to cater to the increasing food requirements and to reduce poverty, particularly among resource-poor farming households. With the adoption of modern plant breeding techniques, new crop cultivars can be developed to ensure high crop productivity. Also, key strategies such as the adoption of advanced plant technology by the leading players in the Asia Pacific region ensure food security globally among the end-users. Also, the government in various countries of the region are encouraging companies to adopt these methods by investing in R&D of agricultural biotechnology.
Key Market Players
The key players in this market include Eurofins Scientific (Luxembourg), Illumina, Inc. (US), NRGene (Israel), and Agilent Technologies (US). The major players in this market are focusing on increasing their presence through expansions & investments, mergers & acquisitions, partnerships, joint ventures, and agreements. These companies have a strong presence in North America, Asia Pacific, and Europe. They also have manufacturing facilities along with strong distribution networks across these regions.
Get online access to the report on the World's First Market Intelligence Cloud
- Easy to Download Historical Data & Forecast Numbers
- Company Analysis Dashboard for high growth potential opportunities
- Research Analyst Access for customization & queries
- Competitor Analysis with Interactive dashboard
- Latest News, Updates & Trend analysis
Request Sample Scope of the Report
Get online access to the report on the World's First Market Intelligence Cloud
- Easy to Download Historical Data & Forecast Numbers
- Company Analysis Dashboard for high growth potential opportunities
- Research Analyst Access for customization & queries
- Competitor Analysis with Interactive dashboard
- Latest News, Updates & Trend analysis

|
Report Metric |
Details |
|
Market size available for years |
2017-2025 |
|
Base year considered |
2018 |
|
Forecast period |
2019-2025 |
|
Forecast units |
Value (USD) |
|
Segments covered |
Type, Objective, Application, and Trait |
|
Geographies covered |
North America, Europe, Asia Pacific, South America, & RoW |
|
Companies covered |
Eurofins Scientific (Luxembourg), Illumina, Inc. (US), NRGene (Israel), Neogen Corporation (US), Qiagen (Germany), Agilent Technologies (US), KeyGene (Netherlands), LC Sciences (US), Traitgenetics GmbH (Germany), Novogene Corporation (China), Oxford Nanopore Technologies (UK), Genewiz (US), BGI Genomics (China), Genotypic Technologies (India), and Floragenex (US). |
This research report categorizes the plant genomics market based on objective, type, trait, application, and region.
On the basis of Type, the market has been segmented as follows:
- Molecular engineering
- Genetic engineering
- Others (genome editing and among others)
On the basis of Trait, the market has been segmented as follows:
- Yield improvement
- Disease resistance
- Herbicide tolerance
- Others (insect resistance and abiotic stress tolerance)
On the basis of Objective, the market has been segmented as follows:
- DNA extraction & purification
- DNA/RNA sequencing
- Genotyping
- GENE expression profiling
- Marker-assisted selection
- GMO-trait purity testing
- Other objectives (hybrid purity testing, targeted resequencing, DNA parentage testing, QTL mapping, and genetic disease identification)
On the basis of Application, the market has been segmented as follows:
- Cereals & grains
- Oilseeds & pulses
- Fruits & vegetables
- Others (sugar crops, ornamentals, and alfalfa)
On the basis of Region, the market has been segmented as follows:
- North America
- Europe
- Asia Pacific
- South America
- Rest of World (RoW)*
*Rest of the World (RoW) includes Saudi Arabia, South Africa, Israel, and others in Rest of the World.
Recent Developments:
- In June 2019, NRGene (Israel) entered into a partnership agreement with BGI (Global Genomic Organization, China) for providing NRGene�s technology as a part of its wide range of genomic analysis services in agriculture research.
- In June 2019, NRGene (Israel) launched a complete genome coverage and high assembly De Novo reference genome-level analysis technology at a much lower cost to accelerate the growth of the agricultural research.
- In January 2019, NRGene (Israel) collaborated with Toyota (Japan) for decoding the commercial strawberry genome, a locally produced fruit for the Japanese market. This combination of NRGene�s assembly and Toyota�s GRAS-Di DNA analysis technology would help in enhancing the production of natural strawberry varieties for Japanese customers.
- In January 2019, NRGene and Macrogen Corporation (South Korea) launched ultra-high-density sequencing-based genotyping service�ArrayMAGIC. This technology provides ultra-high-density single nucleotide polymorphism (SNP) genotyping at a low cost per data point, which makes it more accessible for a wide range of agricultural applications.
Key questions addressed by the report:
- What are the new application areas that the companies are exploring for the market?
- Who are some of the key players operating in the market and how intense is the competition?
- What kind of competitors and stakeholders would be interested in this market? What will be their go-to-market strategy, and which emerging market will be of significant interest?
- How are the current R&D activities and M&A�s in the plant genomics market projected to create a disrupting environment in the coming years?
- What will be the level of impact of new product launches on the revenues of stakeholders, due to the benefits offered by plant genomics, in terms of revenue growth, environmental regulatory compliance, and sustainable profits for the suppliers?
Frequently Asked Questions (FAQ):
What are the new application areas that the companies are exploring for the market?
The adoption of modern plant sequencing techniques has been extensive in developed countries for crops such as corn and wheat; hence, cereals & grains formed the dominant application in 2018. The growth in the adoption of various molecular breeding types, such as molecular engineering and genetic engineering tools, would increase the performance of crops to gain better prices in the market. The plant genomic service companies are largely focusing on the development of major cereals & grains such as corn, wheat, rice, and other grains.
What are the factors that drive the growth of plant genomics market?
The increasing application of genomics in plant breeding and conservation of genetic resources are techniques that are gaining the attention of many researchers globally and are driving the growth of the market.
Who are some of the key players operating in the market and how intense is the competition?
The key players in this market include Eurofins Scientific (Luxembourg), Illumina, Inc. (US), NRGene (Israel), and Agilent Technologies (US). The major players in this market are focusing on increasing their presence through expansions & investments, mergers & acquisitions, partnerships, joint ventures, and agreements. These companies have a strong presence in North America, Asia Pacific, and Europe. They also have manufacturing facilities along with strong distribution networks across these regions.
Which is the fastest growing type for the plant genomics market?
The molecular engineering segment in the market for plant genomics is projected to be the fastest-growing segment. Marker-assisted selection is the most widely adopted process in molecular breeding by key breeding entities, majorly for crop applications. Molecular plant engineering technologies have been rapidly adopted by developed countries such as the US, France, Germany, the Netherlands, and the UK, which jointly have a higher adoption rate. This means that this technology has immense growth potential on a commercial scale in developing economies.
Which region is the fastest growing plant genomics market?
The increasing demand for improved varieties in plants in the Asia Pacific region is driving the growth of the plant genomics market. This region is focusing on directing their investments toward biotechnology research on food crops and crops of high commercial value to cater to the increasing food requirements and to reduce poverty, particularly among resource-poor farming households. .
To speak to our analyst for a discussion on the above findings, click Speak to Analyst
Table of Contents
1 Introduction (Page No. - 18)
1.1 Objectives of the Study
1.2 Market Definition
1.3 Study Scope
1.3.1 Markets Covered
1.4 Periodization Considered
1.5 Currency Considered
1.6 Stakeholders
1.7 Associations & Industry Bodies
2 Research Methodology (Page No. - 29)
2.1 Research Data
2.1.2 Breakdown of Primary Interviews
2.2 Market Size Estimation
2.3 Data Triangulation
2.4 Assumptions for the Study
2.5 Limitations of the Study
3 Executive Summary (Page No. - 39)
4 Premium Insights (Page No. - 48)
4.1 Opportunities in the Plant Genomics Market
4.2 North America: Plant Genomics Market, By Application & Country
4.3 Market, By Objective, 2019 vs 2025 (USD Billion)
4.4 Market, By Trait, 2019 vs 2025 (USD Billion)
4.5 Market, By Key Country
5 Market Overview (Page No. - 53)
5.1 Overview
5.2 Market Dynamics
5.3 Drivers
5.3.1 Technological Advancements Ensuring Strong Market Growth
5.3.2 Rise in Demand for Improved Crop Varieties
5.3.3 Cost-Effectiveness of Genomics
5.3.4 Rise in Plant Genome Funding Fueling the Adoption of Innovative Technologies
5.4 Restraints
5.4.1 Less Usage of Automated Instruments Due to High Cost
5.4.2 High Cost of Infrastructure
5.5 Opportunities
5.5.1 Growth in Emerging Economies Providing Huge Scope for Market Development
5.5.2 Rising Opportunities for Using Novel Dna Sequencing Technologies
5.6 Challenges
5.6.1 Lack of Awareness in Handling Modern Plant Genomic Technologies, in Developing Economies
5.6.2 Hazardous Effects of GMO�s Limiting Research Practices in Plant Genomics
6 Regulations (Page No. - 60)
6.1 Introduction
6.1.1 North America
6.1.1.1 US
6.1.1.2 Canada
6.1.1.3 Mexico
6.1.2 Europe
6.1.2.1 Germany
6.1.3 Asia Pacific
6.1.3.1 China
6.1.3.2 India
6.1.3.3 Australia
6.1.3.4 Japan
6.1.4 South Africa
7 Plant Genomics Market, By Objective (Page No. - 65)
7.1 Introduction
7.1.1 Dna/Rna Sequencing
7.1.1.1 The Dna/Rna Sequencing Segment Accounted for the Largest Share in the Plant Genomics Market
7.1.2 Genotyping
7.1.2.1 The Genotyping Segment Accounted for the Largest Share in North America Due to Its High Accuracy and Efficiency in the Plant Genomics Market
7.1.3 Marker-Assisted Selection (MAS)
7.1.3.1 The Use of MAS in Plant Genomics is Increasing Due to the Involvement of Marker Allele, Which Identifies Disease Resistance Traits Among Plants
7.1.4 Gene Expression Profiling
7.1.4.1 Next-Generation Technology Provides A Better Approach Toward Gene Expression Profiling, as It Helps in Identifying Various Biological Findings
7.1.5 GMO-Trait Purity Testing
7.1.5.1 Advancements in GMO Purity Testing Technology have Encouraged the Development of Enhanced Purification Kits for Plant Genomes in Various Developing Countries
7.1.6 Dna Extraction & Purification
7.1.6.1 Increase in the Production of Various Types of Dna Purification Kits is Projected to Drive the Plant Genomics Market in Developing Countries of Asia Pacific
7.1.7 Others
8 Plant Genomics Market, By Type (Page No. - 78)
8.1 Introduction
8.1.1 Molecular Engineering
8.1.1.1 Unregulated Environment for Molecular Engineering Techniques Positively Impacting Its Adoption Rate, Globally
8.1.2 Genetic Engineering
8.1.2.1 Rise in the Use of Innovative Techniques Fueling the Adoption of Genetic Engineering Methods in Developed Regions
8.1.3 Others
9 Plant Genomics Market, By Trait (Page No. - 87)
9.1 Introduction
9.1.1 Herbicide Tolerance
9.1.1.1 Herbicide-Tolerant Traits Dominated the Plant Genomics Market
9.1.2 Disease Resistance
9.1.2.1 Increase in Commercial Demand for High-Quality Field Crops has Heightened the Adoption of Molecular Techniques
9.1.3 Yield Improvement
9.1.3.1 Increase in Concerns Regarding Food Security has Triggered the Demand for High-Yielding Crop Lines
9.1.4 Others
10 Plant Genomics Market, By Application (Page No. - 98)
10.1 Introduction
10.1.1 Cereals & Grains
10.1.1.1 Growth in Importance of Corn as an Industrial Crop in Developed Economies is the Major Factor Driving the Cereals & Grains Segment
10.1.2 Oilseeds & Pulses
10.1.2.1 Increase in Usage of Various Molecular Engineering Techniques in Oilseeds is Fueling the Growth of the Market in Developing Economies
10.1.3 Fruits & Vegetables
10.1.3.1 Adoption of Molecular Engineering Techniques Would Be Rising in Fruit & Vegetable Cultivation Due to the Decreasing Costs of These Techniques
10.1.4 Other Crops
11 By Region (Page No. - 108)
11.1 Introduction
11.2 North America
11.2.1 US
11.2.1.1 Increasing R&D Investments By Key Players to Drive the Growth of the Plant Genomics Market in the Country
11.2.2 Canada
11.2.2.1 Increasing Government Funding for Advanced Plant Genomic Techniques to Drive the Growth of the Plant Genomics Market in the Country
11.2.3 Mexico
11.2.3.1 Untapped Opportunities in Advanced Biotechnological Plant Genomic Technologies
11.3 Europe
11.3.1 Germany
11.3.1.1 Increasing Investments By Domestic Seed Manufacturers for Plant Genomic Techniques Driving Market Growth
11.3.2 France
11.3.2.1 Increasing Support By the Government Sector for Plant Genomic Activities in France Leading to the Development of Better-Quality Crop Varieties
11.3.3 UK
11.3.3.1 Seed Companies in the UK are Adopting Advanced Plant Genomic Techniques, Such as MAS and Genotyping, for Better Crop Efficiency
11.3.4 The Netherlands
11.3.4.1 Rise in the Number of Agreements Between the Key Players for Providing Various Advanced Plant Genomic Techniques Expected to Fuel the Market in the Country
11.3.5 Spain
11.3.5.1 Huge Potential for Biotechnological Plant Genomic Techniques Expected to Fuel the Market in the Country
11.3.6 Italy
11.3.6.1 Rise in the Production of Cereals & Grains Due to the Use of Various Plant Genomic Techniques Projected to Fuel the Plant Genomics Market in the Country
11.3.7 Rest of Europe
11.4 Asia Pacific
11.4.1 China
11.4.1.1 The Rising Government Support and Funding Drive the Chinese Plant Genomics Market
11.4.2 Japan
11.4.2.1 Increasing Collaborative Activities in Plant Genomics Enhancing the Growth of the Market in Japan
11.4.3 India
11.4.3.1 Indian Plant Genomics Market Projected to Witness the Fastest Growth in the Coming Years
11.4.4 South Korea
11.4.4.1 New Product Developments in Plant Genomics Driving the Market in the Country
11.4.5 Australia & New Zealand
11.4.5.1 Australian Plant Genomic Companies Adopting Advanced Technological Methods for Plant Conservation
11.4.6 Rest of Asia Pacific
11.5 South America
11.5.1 Brazil
11.5.1.1 Brazil is Witnessing High Yield in Agricultural Production and is the Second-Largest Producer of Biotech Crops
11.5.2 Argentina
11.5.2.1 Argentina to Be One of the Largest Exporters of Genetically Engineered (Ge) Commodities
11.5.3 Rest of South America
11.6 Rest of the World
11.6.1 South Africa
11.6.1.1 Favorable Regulations in the Country to Drive the Growth of the Plant Genomic Market
11.6.2 Saudi Arabia
11.6.2.1 Rich Variety of Diverse Plant Genetic Resources Drives the Growth of the Plant Genomics Market in the Country
11.6.3 Israel
11.6.3.1 Untapped Opportunities in Biotechnological Plant Genomic Breeding Technologies
11.6.4 Others in RoW
12 Competitive Landscape (Page No. - 201)
12.1 Overview
12.2 Competitive Leadership Mapping
12.2.1 Visionary Leaders
12.2.2 Dynamic Differentiators
12.2.3 Emerging Companies
12.2.4 Innovators
12.3 Plant Genomics Market Ranking, By Key Player, 2018
12.4 Competitive Scenario
12.4.1 Acquisitions & Mergers
12.4.2 Expansions & Investments
12.4.3 New Product Launches
12.4.4 Agreements, Collaborations, Partnerships, and Joint Ventures
13 Company Profiles (Page No. - 216)
(Business Overview, Products Offered, Recent Developments, SWOT Analysis and MnM View; Please Note In-Depth Coverage in Various Sections is Subjected to Data Availability).
The Companies are Listed in No Particular Order, But as A Representation of the Market�s Ecosystem.
13.1 Eurofins Scientific
13.1.1 Business Overview
13.1.2 Products Offered
13.1.3 Recent Developments
13.1.4 SWOT Analysis
13.1.4.1 MnM View
13.2 Illumina, Inc.
13.2.1 Business Overview
13.2.2 Services Offered
13.2.3 Products Offered
13.2.4 Recent Developments
13.2.5 SWOT Analysis
13.2.5.1 MnM View
13.3 Agilent Technologies
13.3.1 Business Overview
13.3.2 Products Offered
13.3.3 SWOT Analysis
13.3.3.1 MnM View
13.4 Qiagen
13.4.1 Business Overview
13.4.2 Products Offered
13.4.3 Recent Developments
13.4.4 SWOT Analysis
13.4.4.1 MnM View
13.5 Nrgene
13.5.1 Business Overview
13.5.2 Products Offered
13.5.3 Recent Developments
13.5.4 SWOT Analysis
13.5.4.1 MnM View
13.6 Neogen Corporation
13.6.1 Business Overview
13.6.2 Products Offered
13.6.2.1 MnM View
13.7 Keygene
13.7.1 Business Overview
13.7.2 Products Offered
13.7.3 Recent Developments
13.7.3.1 MnM View
13.8 LC Sciences
13.8.1 Business Overview
13.8.2 Products Offered
13.8.2.1 MnM View
13.9 Traitgenetics GmbH
13.9.1 Business Overview
13.9.2 Products Offered
13.9.2.1 MnM View
13.10 Novogene Corporation
13.10.1 Business Overview
13.10.2 Technology Offered
13.10.3 Recent Developments
13.10.3.1 MnM View
13.11 Oxford Nanopore Technologies
13.11.1 Business Overview
13.11.2 Products Offered
13.11.2.1 MnM View
13.12 Genewiz
13.12.1 Business Overview
13.12.2 Products Offered
13.12.2.1 MnM View
13.13 BGI Genomics
13.13.1 Business Overview
13.13.2 Products Offered
13.13.3 Recent Developments
13.13.3.1 MnM View
13.14 Floragenex
13.14.1 Business Overview
13.14.2 Products Offered
13.14.3 Recent Developments
13.14.3.1 MnM View
13.15 Genotypic Technology Pvt. Ltd.
13.15.1 Business Overview
13.15.2 Services Offered
13.15.3 Products Offered
13.15.3.1 MnM View
14 Appendix (Page No. - 259)
14.1 Discussion Guide
14.2 Knowledge Store: Marketsandmarkets� Subscription Portal
14.3 Available Customizations
14.4 Related Reports
List of Tables (76 Tables)
Table 1 USD Exchange Rates Considered, 2014�2018
Table 2 Plant Genomics Market Size, By Objective, 2019�2025 (USD Million)
Table 3 Dna/Rna Sequencing Plant Genomics Market Size, By Region, 2019�2025 (USD Million)
Table 4 Plant Genotyping Market Size, By Region, 2019�2025 (USD Million)
Table 5 Plant Marker-Assisted Selection Market Size, By Region, 2019�2025 (USD Million)
Table 6 Plant Gene Expression Profiling Market Size, By Region, 2019�2025 (USD Million)
Table 7 Plant GMO/Trait Purity Market Size, By Region, 2019�2025 (USD Million)
Table 8 Plant Dna Extraction & Purification Market Size, By Region, 2019�2025 (USD Million)
Table 9 Other Objectives Market Size, By Region, 2019�2025 (USD Million)
Table 10 Plant Genomics Market Size, By Type, 2017�2025 (USD Million)
Table 11 Molecular Engineering: Plant Genomics Market Size, By Region, 2017�2025 (USD Million)
Table 12 Genetic Engineering: Market Size, By Region, 2017�2025 (USD Million)
Table 13 Others: Plant Genomics Market Size, By Region, 2017�2025 (USD Million)
Table 14 Plant Genomics Market Size, By Trait, 2017�2025 (USD Million)
Table 15 Plant Herbicide-Tolerant Genomics Market Size, By Region, 2017�2025 (USD Million)
Table 16 Plant Disease-Resistant Genomics Market Size, By Region, 2017�2025 (USD Million)
Table 17 Plant Yield Improvement Genomics Market Size, By Region, 2017�2025 (USD Million)
Table 18 Other Traits Market Size, By Region, 2017�2025 (USD Million)
Table 19 Plant Genomics Market Size, By Application, 2017�2025 (USD Million)
Table 20 Market Size in Cereals & Grains, By Region, 2017�2025 (USD Million)
Table 21 Market Size in Oilseeds & Pulses, By Region, 2017�2025 (USD Million)
Table 22 Market Size in Fruits & Vegetables, By Region, 2017�2025 (USD Million)
Table 23 Market Size in Other Crops, By Region, 2017�2025 (USD Million)
Table 24 Market Size, By Region, 2017�2025 (USD Million)
Table 25 North America: Plant Genomics Market Size, By Country, 2017�2025 (USD Million)
Table 26 North America: Market Size, By Trait, 2017�2025 (USD Million)
Table 27 North America: Market Size, By Type, 2017�2025 (USD Million)
Table 28 North America: Market Size, By Objective, 2017�2025 (USD Million)
Table 29 North America: Market Size, By Application, 2017�2025 (USD Million)
Table 30 US: Market Size, By Objective, 2017�2025 (USD Million)
Table 31 Canada: Market Size, By Objective, 2017�2025 (USD Million)
Table 32 Mexico: Market Size, By Objective, 2017�2025 (USD Million)
Table 33 Europe: Plant Genomics Market Size, By Country, 2017�2025 (USD Million)
Table 34 Europe: Market Size, By Trait, 2017�2025 (USD Million)
Table 35 Europe: Market Size, By Type, 2017�2025 (USD Million)
Table 36 Europe: Market Size, By Application, 2017�2025 (USD Million)
Table 37 Europe: Market Size, By Objective, 2017�2025 (USD Million)
Table 38 Germany: Market Size, By Objective, 2017�2025 (USD Million)
Table 39 France: Market Size, By Objective, 2017�2025 (USD Million)
Table 40 UK: Market Size, By Objective, 2017�2025 (USD Million)
Table 41 Netherlands: Market Size, By Objective, 2017�2025 (USD Million)
Table 42 Spain: Market Size, By Objective, 2017�2025 (USD Million)
Table 43 Italy: Market Size, By Objective, 2017�2025 (USD Million)
Table 44 Rest of Europe: Plant Genomics Market Size, By Objective, 2017�2025 (USD Million)
Table 45 Asia Pacific: Plant Genomics Market Size, By Country, 2017�2025 (USD Million)
Table 46 Asia Pacific: Market Size, By Trait, 2017�2025 (USD Million)
Table 47 Asia Pacific: Market Size, By Type, 2017�2025 (USD Million)
Table 48 Asia Pacific: Market Size, By Objective, 2017�2025 (USD Million)
Table 49 Asia Pacific: Market Size, By Application, 2017�2025 (USD Million)
Table 50 China: Market Size, By Objective, 2017�2025 (USD Million)
Table 51 Japan: Market Size, By Objective, 2017�2025 (USD Million)
Table 52 India: Market Size, By Objective, 2017�2025 (USD Million)
Table 53 South Korea: Plant Genomics Market Size, By Objective, 2017�2025 (USD Million)
Table 54 Australia & New Zealand: Market Size, By Objective, 2017�2025 (USD Million)
Table 55 Rest of Asia Pacific: Market Size, By Objective, 2017�2025 (USD Million)
Table 56 South America: Plant Genomics Market Size, By Country, 2017�2025 (USD Million)
Table 57 South America: Market Size, By Trait, 2017�2025 (USD Million)
Table 58 South America: Market Size, By Type, 2017�2025 (USD Million)
Table 59 South America: Market Size, By Application, 2017�2025 (USD Million)
Table 60 South America: Market Size, By Objective, 2017�2025 (USD Million)
Table 61 Brazil: Market Size, By Objective, 2017�2025 (USD Million)
Table 62 Argentina: Market Size, By Objective, 2017�2025 (USD Million)
Table 63 Rest of South America: Market Size, By Objective, 2017�2025 (USD Million)
Table 64 RoW: Plant Genomics Market Size, By Country, 2017�2025 (USD Million)
Table 65 RoW: Market Size, By Trait, 2017�2025 (USD Million)
Table 66 RoW: Market Size, By Type, 2017�2025 (USD Million)
Table 67 RoW: Market Size, By Objective, 2017�2025 (USD Million)
Table 68 RoW: Market Size, By Application, 2017�2025 (USD Million)
Table 69 South Africa: Plant Genomics Market Size, By Objective, 2017�2025 (USD Million)
Table 70 Saudi Arabia: Market Size, By Objective, 2017�2025 (USD Million)
Table 71 Israel: Market Size, By Objective, 2017�2025 (USD Million)
Table 72 Others in RoW: Market Size, By Objective, 2017�2025 (USD Million)
Table 73 Acquisitions & Mergers, 2015�2019
Table 74 Expansions & Investments, 2015�2019
Table 75 New Product Launches, 2015�2019
Table 76 Agreements, Collaborations, Partnerships, and Joint Ventures, 2015�2019
List of Figures (46 Figures)
Figure 1 Plant Genomics Market Segmentation
Figure 2 Regional Segmentation
Figure 3 Plant Genomics Market: Research Design
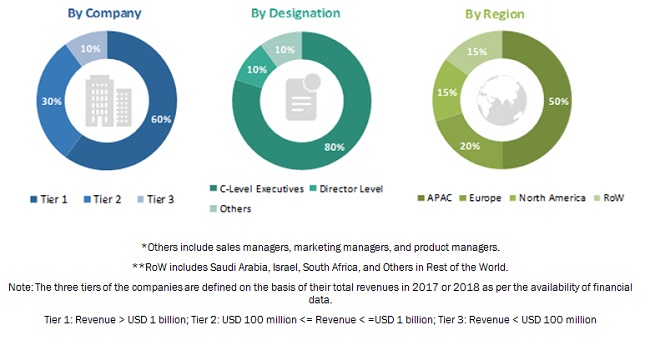
Figure 4 Breakdown of Primary Interviews: By Company Type, Designation, and Region
Figure 5 Market Size Estimation Methodology: Bottom-Up Approach
Figure 6 Market Size Estimation Methodology: Top-Down Approach
Figure 7 Data Triangulation Methodology
Figure 8 Plant Genomics Market Size, By Objective, 2019 Vs.2025 (USD Million)
Figure 9 Market Size, By Trait, 2019 vs 2025 (USD Million)
Figure 10 Plant Genomics Market Size, By Type, 2018 (USD Million)
Figure 11 Market Size, By Application, 2019 vs 2025 (USD Million)
Figure 12 Plant Genomics Market: Regional Snapshot
Figure 13 The Rise in Plant Genome Funding for Fueling the Adoption of Innovative Technologies Supports the Growth of the Plant Genomics Market
Figure 14 North America: the US Was the Largest Market for Plant Genomics in 2018
Figure 15 Genotyping Segment Estimated to Be the Dominant Segment in the Plant Genomics Market in 2019
Figure 16 Herbicide Tolerance Segment Estimated to Be the Dominant Segment in the Plant Genomics Market in 2019
Figure 17 India is Projected to Witness the Highest Growth During the Forecast Period
Figure 18 Plant Genomics: Market Dynamics
Figure 19 Sequencing Cost Per Genome, 2011-2019
Figure 20 Plant Genomics Market Size, By Objective, 2019 vs 2025 (USD Million)
Figure 21 Market Size, By Type, 2019 vs 2025 (USD Million)
Figure 22 Plant Genomics Market Size, By Trait, 2019 vs 2025 (USD Million)
Figure 23 Market Size, By Application, 2019 vs 2025 (USD Million)
Figure 24 North America Plant Genomics Snapshot
Figure 25 Asia Pacific: Plant Genomics Market Snapshot
Figure 26 Plant Genomics Market: Competitive Leadership Mapping, 2018
Figure 27 Key Developments of the Leading Players in the Plant Genomics Market, 2015�2019
Figure 28 Plant Genomics Market Ranking, 2018
Figure 29 Agreements, Partnerships, Collaborations & Joint Ventures is the Key Strategy Adopted By Leading Players
Figure 30 Annual Developments in the Plant Genomics Market, 2015�2019
Figure 31 Eurofins Scientific: Company Snapshot
Figure 32 Eurofins Scientific: SWOT Analysis
Figure 33 Illumina, Inc.: Company Snapshot
Figure 34 Agilent Technologies: Company Snapshot
Figure 35 Qiagen: Company Snapshot
Figure 36 Nrgene: Company Snapshot
Figure 37 Neogen Corporation: Company Snapshot
Figure 38 Keygene: Company Snapshot
Figure 39 LC Sciences: Company Snapshot
Figure 40 Traitgenetics GmbH: Company Snapshot
Figure 41 Novogene Corporation: Company Snapshot
Figure 42 Oxford Nanopore Technologies: Company Snapshot
Figure 43 Genewiz: Company Snapshot
Figure 44 BGI Genomics: Company Snapshot
Figure 45 Floragenex: Company Snapshot
Figure 46 Genotypic Technology Pvt. Ltd.: Company Snapshot
The study involves four major activities to estimate the current market size of the plant genomics market. Exhaustive secondary research was done to collect information on the market, peer market, and parent market. These findings, assumptions, and market sizes were validated with industry experts across the value chain through primary research. Both the top-down and bottom-up approaches were employed to estimate the complete market size. Thereafter, the market breakdown and data triangulation approaches were used to estimate the market size of segments and subsegments.
Secondary Research
In the secondary research process, various secondary sources such as Hoovers, Bloomberg BusinessWeek, and Dun & Bradstreet were referred to, to identify and collect information for this study. These secondary sources included annual reports, press releases & investor presentations of companies, white papers, certified publications, articles by recognized authors, gold standard & silver standard websites, food safety organizations, regulatory bodies, trade directories, and databases.
Primary Research
The plant genomics market comprises several stakeholders such as manufacturers, importers and exporters, traders, distributors, and suppliers of plant genomics, food processors & manufacturers, government & research organizations. It also includes manufacturers of pharmaceuticals and seed companies. The demand-side of this market is characterized by the rising demand for plant genomics in the food and seed industries. The supply-side is characterized by the supply of non-GMO plant genomics from various suppliers in the market. Various primary sources from both the supply and demand sides of the market were interviewed to obtain qualitative and quantitative information. Following is the breakdown of primary respondents:
To know about the assumptions considered for the study, download the pdf brochure
Market Size Estimation
Both the top-down and bottom-up approaches were used to estimate and validate the total size of the plant genomics market. These methods were also used extensively to estimate the size of various subsegments in the market. The research methodology used to estimate the market size includes the following:
- The key players in the industry and markets were identified through extensive secondary research.
- The industry�s supply chain and market size, in terms of value, was determined through primary and secondary research processes.
- All percentage shares, splits, and breakdowns were determined using secondary sources and verified through primary respondents
Data Triangulation
After arriving at the overall market size�using the market size estimation processes as explained above�the market was split into several segments and subsegments. In order to complete the overall market engineering process and arrive at the exact statistics of each market segment and subsegment, the data triangulation and market breakdown procedures were employed. The data was triangulated by studying various factors and trends from both the demand and supply sides in the plant genomics market.
Report Objectives
- To define, segment, and project the global market size of the plant genomics market
- To understand the plant genomics market by identifying its various subsegments
- To provide detailed information about the key factors influencing the growth of the market (drivers, restraints, opportunities, and industry-specific challenges)
- To analyze the micromarkets, concerning individual growth trends, prospects, and their contribution to the total market
- To project the size of the market and its submarkets, in terms of value, concerning the regions (along with their respective key countries)
- To profile key players and comprehensively analyze their core competencies
- To understand the competitive landscape and identify the major growth strategies adopted by players across key regions
- To analyze the competitive developments such as expansions & investments, mergers & acquisitions, new product launches, partnerships, joint ventures, and agreements
Available Customizations
With the given market data, MarketsandMarkets offers customizations according to the company�s specific scientific needs.
The following customization options are available for the report:
Product Analysis
� Product matrix, which gives a detailed comparison of the product portfolio of each company
Geographic Analysis
- Further breakdown of the Rest of Europe plant genomics market into Russia, Belgium, and other EU and non-EU countries
- Further breakdown of the Rest of Asia Pacific plant genomics market into Malaysia, Indonesia, the Philippines, Singapore, and Vietnam
- Further breakdown of the plant genomics market in the Middle Eastern and African countries
Company Information
- � Detailed analyses and profiling of additional market players (up to five)


Growth opportunities and latent adjacency in Plant Genomics Market