Plasma Feed Market by Source (Porcine, Bovine, and Others), Application (Swine Feed, Pet Food, Aquafeed, and Others (Includes Ruminant and Poultry Feed)), Region (North America, Europe, Asia Pacific, and Rest of the World) - Global Forecast to 2025


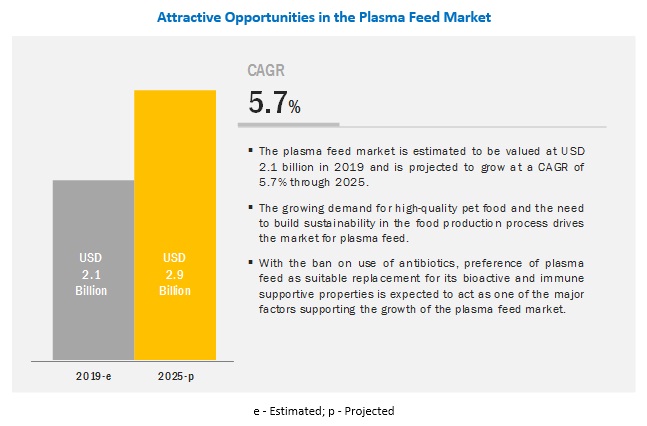
[183 Pages Report] The global plasma feed market is projected to grow from USD 2.1 billion in 2019 to USD 2.9 billion by 2025, at a CAGR of 5.7%. Plasma feed includes the feed products that involve animal-derived plasma proteins as the feed ingredient. The market for plasma feed has been growing at the global level due to the rise in demand for alternative protein sources in the feed industry. The market for plasma feed is consolidated in nature as the major share is occupied by a few players at the global level.
Based on the source, the porcine segment is projected to be the larger contributor to the plasma feed market during the forecast period
The plasma feed market has been segmented, based on source, into porcine, bovine, and others, which includes sheep, goat, and poultry. The market for porcine plasma feed is projected to record a higher market share between 2019 and 2025. Porcine blood meal offers various health benefits to animals and is used significantly in poultry and porcine feed. For instance, as per the National Center for Biotechnology Information (NCBI), “pigs fed diets containing porcine plasma had greater average daily feed intake (ADFI) and average daily growth (ADG).”
Plasma feed is projected to be used majorly in pet food during the forecast period
The major factor for the higher adoption of plasma feed in pet food is anticipated because the tendency of people to humanize pets and treat them like their family members has resulted in the high demand for better quality pet food. The trend for the use of natural and bioactive products is very prevalent in the pet food industry. This is attributed to factors such as the expansion of the pet population, customer attitudes toward their pets as companions or family. As per Darling Ingredients, one of the major brand engaged in the production of plasma feed products quoted that plasma protein is a natural and sustainable source for pet food. It has several advantages such as water binding capacity, emulsifying properties, and palatability, which in turn drives the market for plasma feed among pet food manufacturers.
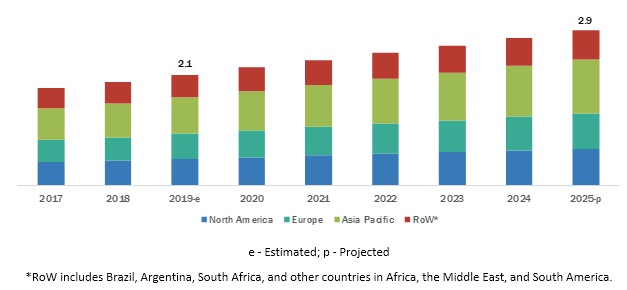
The Asia Pacific is projected to account for the largest market share during the forecast period
The Asia Pacific plasma feed market is projected to be the largest between 2019 and 2025 and is expected to grow at the highest CAGR during the same period. The steadily improving economy has been driving the overall meat food market in the region, which has, in turn, been boosting the plasma feed market as well. According to the Food and Agriculture Organization (FAO), the demand for livestock products has grown in this region in recent years. For instance, meat consumption has grown at a rate of 5 % and for dairy products at a rate of 3.5-4% per year. The increased demand for pork in the region, along with the rise in the consumption of beef in China is expected to increase the number of slaughters, which can eventually improve the market suppply need for plasma feed manufacturers.
Key Market Players
Key players in plasma feed market include Darling Ingredients Inc. (US), The Lauridsen Group Inc. (US), SARIA Group (Germany), Sera Scandia (Denmark), Lican Food (Chile), Puretein Agri LLC. (US), Veos Group (Belgium), Kraeber & Co Gmbh (Germany), Rocky Mountain Biologicals (US), Lihme Protein Solutions (Denmark), EcooFeed LLC (US), and FeedWorks (Australia).
These players are undertaking strategies such as new product launches and acquisitions to improve their market positions and extend their competitive advantage.
Get online access to the report on the World's First Market Intelligence Cloud
- Easy to Download Historical Data & Forecast Numbers
- Company Analysis Dashboard for high growth potential opportunities
- Research Analyst Access for customization & queries
- Competitor Analysis with Interactive dashboard
- Latest News, Updates & Trend analysis
Request Sample Scope of the Report
Get online access to the report on the World's First Market Intelligence Cloud
- Easy to Download Historical Data & Forecast Numbers
- Company Analysis Dashboard for high growth potential opportunities
- Research Analyst Access for customization & queries
- Competitor Analysis with Interactive dashboard
- Latest News, Updates & Trend analysis

|
Report Metric |
Details |
|
Market sizes available for years |
2017-2025 |
|
Market size estimation |
2017–2025 |
|
Base year considered |
2018 |
|
Forecast period considered |
2019–2025 |
|
Units considered |
Value (USD) , Volume (KT) |
|
Segments covered |
Source, Application, and Region |
|
Regions covered |
North America, Asia Pacific, Europe, and RoW |
|
Companies studied |
Darling Ingredients Inc. (US), The Lauridsen Group Inc. (US), SARIA Group (Germany), Sera Scandia (Denmark), Lican Food (Chile), Puretein Agri LLC. (US), Veos Group (Belgium), Kraeber & Co Gmbh (Germany), Rocky Mountain Biologicals (US), Lihme Protein Solutions (Denmark), EcooFeed LLC (US) and FeedWorks (Australia) |
This research report categorizes the plasma feed market based on source and application.
Target Audience
- Plasma feed manufacturers and suppliers
- Meat producers
- Plasma feed distributors importers and exporters
- Research institutions
- Government bodies
- Distributors
- End users (Farmers, farming organizations, feed additive companies, and users of animal feed for pets)
Report Scope
Source:
- Porcine
- Bovine
- Others (Poultry, sheep, and goat)
Application:
- Swine feed
- Pet food
- Aquafeed
- Others (Poultry and ruminant feed)
By Region
- North America
- Europe
- Asia Pacific
- Rest of the World (RoW)
Critical questions the report answers:
- Where will all these developments take the industry in the mid-to-long term?
- What are the upcoming commercial prospects for the plasma feed market?
- What is the impact of high capital investment on the plasma feed market?
- What are the new technologies introduced in the plasma feed market?
- What are the latest trends in the plasma feed market?
Frequently Asked Questions (FAQ):
What is the share of the key market players in the plasma feed market?
The key global players, i.e., SARIA Group (Daka Denmark A/S), Darling Ingredients Inc., Lauridsen Group Inc., and Kraeber & Co GmbH contributed to more than 50% of the revenues in 2018, SARIA Group and Darling Ingredients Inc. were the dominants players.
Why there is an increasing usage of plasma feed in pet food?
Compared to other texture-modifying ingredients, such as carrageenan, plasma can be used as a nutrient-rich ingredient to improve the overall texture of wet pet food. It has been found to have better water retention capabilities compared to other texture-modifying ingredients such as wheat gluten.
What are the challenges that can be faced by market players?
Stringent global regulatory framework for animal-based protein in ruminant feed and low standard livestock production practices causing disease outbreaks can affect plasma manufacturing are the key challenges faced by market players.
Which region is the fastest growing plasma feed market?
High consumption and production of meat in China drive the market for plasma feed in the Chinesse market.
What is the winning factor for plasma feed manufacturers?
The ban on Antimicrobial Growth Promoters (AMGP) and the reallowance of porcine blood plasma as a feed ingredient for pigs and poultry is proved be a good alternative for AMGP’s. Plasma has more effect on growth and feed intake when using feed without AMGP than it has with feed containing AMGP. .
To speak to our analyst for a discussion on the above findings, click Speak to Analyst
Table of Contents
1 Introduction (Page No. - 17)
1.1 Objectives of the Study
1.2 Market Definition
1.3 Study Scope
1.4 Regional Segmentation
1.5 Periodization Considered
1.6 Currency Considered
1.7 Units Considered
1.8 Stakeholders
2 Research Methodology (Page No. - 25)
2.1 Secondary Data & Primary Data
2.1.1 Breakdown of Primary Interviews
2.2 Market Size Estimation
2.3 Data Triangulation
2.4 Research Assumptions
2.5 Limitations
3 Executive Summary (Page No. - 34)
4 Premium Insights (Page No. - 41)
4.1 Opportunities in the Plasma Feed Market
4.2 North America Plasma Feed Market, By Application & Key Country
4.3 Plasma Feed Market, By Source
4.4 Plasma Feed Market, By Key Country
5 Market Overview (Page No. - 46)
5.1 Overview
5.2 Macroeconomic Indicators
5.2.1 Increase in Demand for Meat Products in Developing Countries
5.2.2 Growth in Feed Production
5.3 Plasma Feed: Market Dynamics
5.3.1 Drivers
5.3.1.1 Demand for Plasma Feed as A Replacement for Antibiotics
5.3.1.2 Strong Demand From the Aquafeed Industry
5.3.2 Restraints
5.3.2.1 Uncertainty in Acceptance of Blood-Based Products for Livestock Feed
5.3.2.2 High Investment in Refining Technology at A Commercial Scale
5.3.3 Opportunities
5.3.3.1 Growth in Demand for High-Quality Pet Food
5.3.3.2 Support From Sustainability Initiatives Across Feed, Livestock, and Food Industries
5.3.4 Challenges
5.3.4.1 Stringent Global Regulatory Framework for Animal-Based Protein in Ruminant Feed
5.3.4.2 Low Standard Livestock Production Practices Causing Disease Outbreaks Can Affect Plasma Manufacturing
5.4 Regulations
5.4.1 North America
5.4.1.1 Us
5.4.1.2 Canada
5.4.2 Europe
5.4.3 Asia Pacific
5.4.3.1 Australia
5.4.3.2 Japan
5.4.4 South Africa
5.5 Patent Analysis
6 Plasma Feed Market, By Source (Page No. - 66)
6.1 Introduction
6.2 Porcine
6.2.1 Increase in Number of Swine Slaughtered for Food Production Drives the Market for Porcine-Based Plasma Feed
6.3 Bovine
6.3.1 Dried Bovine Plasma in the Diet Helps in Improving the Weight of Livestock
6.4 Others
7 Plasma Feed Market, By Application (Page No. - 75)
7.1 Introduction
7.2 Swine Feed
7.2.1 Animal-Derived Proteins are Highly Digestible for Pigs
7.3 Pet Food
7.3.1 Most of the Industry Players Offer Plasma Protein Products for Pet Food Applications
7.4 Aquafeed
7.4.1 Falling Supply of Fish Meal and Fish Oil Drives the Plasma Feed Market for Aquafeed Application
7.5 Others
8 Plasma Feed Market Size, By Region (Page No. - 85)
8.1 Introduction
8.2 North America
8.2.1 US
8.2.1.1 Increase in Sustainable Feed Supply for Aquafeed and Pet Food Manufacturing Drives the Us Plasma Feed Market
8.2.2 Mexico
8.2.2.1 Increase in Demand for Meat and Meat Products in Mexico Drives the Livestock Industry and in Turn the Plasma Feed Market
8.2.3 Canada
8.2.3.1 Growth in Swine, Beef, and Dairy Industry is Expected to Boost Feed Protein Supplements Such as Plasma in Canada
8.3 Europe
8.3.1 Spain
8.3.1.1 Growing Pork Meat Exports Expected to Drive Plasma Feed Ingredients in Spain
8.3.2 Germany
8.3.2.1 Modernization in the German Feed Sector Supports the Acceptance of Plasma Feed
8.3.3 Russia
8.3.3.1 Increase in Pork Production to Drive the Porcine Plasma Feed Market in Russia
8.3.4 Rest of Europe
8.4 Asia Pacific
8.4.1 China
8.4.1.1 High Consumption and Production of Meat in China Drive the Market for Plasma Feed
8.4.2 Australia
8.4.2.1 Ovine Segment is the Potential Source for Plasma Feed in Australia
8.4.3 Japan
8.4.3.1 Japan, Being the Market for High-Quality and Premium Pet Food, Holds High Potential for the Acceptance of Plasma Feed
8.4.4 South Korea
8.4.4.1 Consumer Shift Toward High Meat Consumption Drives the Commercial Feed Industry
8.4.5 Rest of Asia Pacific
8.5 Rest of the World
8.5.1 Brazil
8.5.1.1 High Beef Consumption Supports the Growth of Plasma Feed in Brazil
8.5.2 Argentina
8.5.2.1 Domestic Beef Industry is Expected to Utilize Plasma Feed Ingredients to Imrpove Profit Margins
8.5.3 South Africa
8.5.3.1 Regulated Environment for Antibiotic Use May Restrict the Market Growth for Plasma Feed
8.5.4 Others in RoW
9 Impact Analysis of Plasma Feed on Adjacent Segments (Page No. - 154)
9.1 Introduction
9.1.1 Impact Analysis on Adjacent Applications
9.1.2 Impact Analysis of Plasma Feed on Key Countries and the Feed Application Segment
9.1.3 Impact Analysis of Plasma Feed on Key Raw Materials
10 Competitive Landscape (Page No. - 157)
10.1 Overview
10.2 Competitive Leadership Mapping
10.2.1 Progressive Companies
10.2.2 Starting Blocks
10.2.3 Emerging Companies
10.2.4 Dynamic Companies
10.3 Competitive Benchmarking
10.3.1 Strength of Product Portfolio
10.3.2 Business Strategy Excellence
10.4 Market Share of Key Players, 2018
10.5 Competitive Scenario
10.5.1 Acquisitions
10.5.2 Mergers
11 Company Profile (Page No. - 166)
11.1 SARIA Group (Daka Denmark A/S)
11.1.1 Business Overview
11.1.2 Company Financials
11.1.3 Product Portfolio
11.1.4 Recent Developments
11.1.5 SWOT Analysis
11.1.6 MnM View
11.2 Darling Ingredients Inc.
11.2.1 Business Overview
11.2.2 Company Financials
11.2.3 Product Portfolio
11.2.4 Recent Developments
11.2.5 SWOT Analysis
11.2.6 MnM View
11.3 Lauridsen Group Inc.
11.3.1 Business Overview
11.3.2 Company Financials
11.3.3 Product Portfolio
11.3.4 Recent Developments
11.3.5 SWOT Analysis
11.3.6 MnM View
11.4 Kraeber & Co GmbH
11.4.1 Business Overview
11.4.2 Company Financials
11.4.3 Product Portfolio
11.4.4 SWOT Analysis
11.4.5 MnM View
11.5 Sera Scandia A/S
11.5.1 Business Overview
11.5.2 Company Financials
11.5.3 Product Portfolio
11.5.4 SWOT Analysis
11.5.5 MnM View
11.6 Lican Food
11.6.1 Business Overview
11.6.2 Company Financials
11.6.3 Product Portfolio
11.6.4 MnM View
11.7 Puretein Agri LLC
11.7.1 Business Overview
11.7.2 Company Financials
11.7.3 Product Portfolio
11.7.4 MnM View
11.8 Veos Group
11.8.1 Business Overview
11.8.2 Company Financials
11.8.3 Product Portfolio
11.8.4 MnM View
11.9 Rocky Mountain Biologicals
11.9.1 Business Overview
11.9.2 Company Financials
11.9.3 Product Portfolio
11.9.4 MnM View
11.10 Lihme Protein Solutions
11.10.1 Business Overview
11.10.2 Company Financials
11.10.3 Product Portfolio
11.10.4 MnM View
11.11 Eccofeed LLC
11.11.1 Business Overview
11.11.2 Company Financials
11.11.3 Product Portfolio
11.11.4 MnM View
11.12 Feedworks Pty Ltd
11.12.1 Business Overview
11.12.2 Company Financials
11.12.3 Product Portfolio
11.12.4 MnM View
12 Appendix (Page No. - 199)
12.1 Discussion Guide
12.2 Knowledge Store
12.3 Available Customizations
12.4 Related Reports
List of Tables (90 Tables)
Table 1 USD Exchange Rates Considered, 2014–2018
Table 2 Asia: Estimated and Projected Demand of Aquafeed, 2003–2005 (Million Tonnes)
Table 3 Comparison Between Various Protein Types Under Pet Food
Table 4 List of Patents for Plasma Feed, 2016–2019
Table 5 List of Patents for Plasma Feed, 2014–2016
Table 6 Plasma Feed Market Size, By Source, 2017–2025 (Kt)
Table 7 Plasma Feed Market Size, By Source, 2017–2025 (USD Million)
Table 8 Porcine Plasma Feed Market Size, By Region, 2017–2025 (Kt)
Table 9 Porcine Plasma Feed Market Size, By Region, 2017–2025 (USD Million)
Table 10 Bovine Plasma Feed Market Size, By Region, 2017–2025 (Kt)
Table 11 Bovine Plasma Feed Market Size, By Region, 2017–2025 (USD Million)
Table 12 Plasma Feed Market Size From Other-Sources, By Region, 2017–2025 (Kt)
Table 13 Plasma Feed Market Size From Other Sources, By Region, 2017–2025 (USD Million)
Table 14 Plasma Feed Market Size, By Application, 2017–2025 (USD Million)
Table 15 Plasma Market Size in Swine Feed Application, By Region, 2017–2025 (USD Million)
Table 16 Plasma Market Size in Pet Food Application, By Region, 2017–2025 (USD Million)
Table 17 Plasma Market Size in Aquafeed Application, By Region, 2017–2025 (USD Million)
Table 18 Plasma Market Size in Other Feed Application, By Region, 2017–2025 (USD Million)
Table 19 Plasma Feed Market Size, By Region, 2017–2025 ( Kt)
Table 20 Plasma Feed Market Size, By Region, 2017–2025 (USD Million)
Table 21 North America: Plasma Feed Market Size, By Country, 2017–2025 (Kt)
Table 22 North America: Market Size, By Country, 2017–2025 (USD Million)
Table 23 North America: Market Size, By Source, 2017–2025 ( Kt)
Table 24 North America: Market Size, By Source, 2017–2025 (USD Million)
Table 25 North America: Market Size, By Application, 2017–2025 (USD Million)
Table 26 US: Plasma Feed Market Size, By Source, 2017–2025 (Kt)
Table 27 US: Market Size, By Source, 2017–2025 (USD Million)
Table 28 US: Market Size, By Application, 2017–2025 (USD Million)
Table 29 Mexico: Plasma Feed Market Size, By Source, 2017–2025 (Kt)
Table 30 Mexico: Market Size, By Source, 2017–2025 (USD Million)
Table 31 Mexico: Market Size, By Application, 2017–2025 (USD Million)
Table 32 Canada: Plasma Feed Market Size, By Source, 2017–2025 (Kt)
Table 33 Canada: Market Size, By Source, 2017–2025 (USD Million)
Table 34 Canada: Market Size, By Application, 2017–2025 (USD Million)
Table 35 Europe: Plasma Feed Market Size, By Country, 2017–2025 (Kt)
Table 36 Europe: Market Size, By Country, 2017–2025 (USD Million)
Table 37 Europe: Market Size, By Source, 2017–2025 (Kt)
Table 38 Europe: Market Size, By Source, 2017–2025 (USD Million)
Table 39 Europe: Market Size, By Application, 2017–2025 (USD Million)
Table 40 Spain: Plasma Feed Market Size, By Source, 2017–2025 (Kt)
Table 41 Spain: Market Size, By Source, 2017–2025 (USD Million)
Table 42 Spain: Market Size, By Application, 2017–2025 (USD Million)
Table 43 Germany: Plasma Feed Market Size, By Source, 2017–2025 (Kt)
Table 44 Germany: Market Size, By Source, 2017–2025 (USD Million)
Table 45 Germany: Market Size, By Application, 2017–2025 (USD Million)
Table 46 Russia: Plasma Feed Market Size, By Source, 2017–2025 (Kt)
Table 47 Russia: Market Size, By Source, 2017–2025 (USD Million)
Table 48 Russia: Market Size, By Application, 2017–2025 (USD Million)
Table 49 Rest of Europe: Plasma Feed Market Size, By Source, 2017–2025 (Kt)
Table 50 Rest of Europe: Market Size, By Source, 2017–2025 (USD Million)
Table 51 Rest of Europe: Market Size, By Application, 2017–2025 (USD Million)
Table 52 Asia Pacific: Plasma Feed Market Size, By Country, 2017–2025 (Kt)
Table 53 Asia Pacific: Market Size, By Country, 2017–2025 (USD Million)
Table 54 Asia Pacific: Market Size, By Source, 2017–2025 (Kt)
Table 55 Asia Pacific: Market Size, By Source, 2017–2025 (USD Million)
Table 56 Asia Pacific: Market Size, By Application, 2017–2025 (USD Million)
Table 57 China: Plasma Feed Market Size, By Source, 2017–2025 (Kt)
Table 58 China: Market Size, By Source, 2017–2025 (USD Million)
Table 59 China: Market Size, By Application, 2017–2025 (USD Million)
Table 60 Australia: Plasma Feed Market Size, By Source, 2017–2025 (Kt)
Table 61 Australia: Plasma Feed Market Size, By Source, 2017–2025 (USD Million)
Table 62 Australia: Market Size, By Application, 2017–2025 (USD Million)
Table 63 Japan: Plasma Feed Market Size, By Source, 2017–2025 (Kt)
Table 64 Japan: Market Size, By Source, 2017–2025 (USD Million)
Table 65 Japan: Market Size, By Application, 2017–2025 (USD Million)
Table 66 South Korea: Plasma Feed Market Size, By Source, 2017–2025 (Kt)
Table 67 South Korea: Market Size, By Source, 2017–2025 (USD Million)
Table 68 South Korea: Market Size, By Application, 2017–2025 (USD Million)
Table 69 Rest of Asia Pacific: Plasma Feed Market Size, By Source, 2017–2025 (Kt)
Table 70 Rest of Asia Pacific: Market Size, By Source, 2017–2025 (USD Million)
Table 71 Rest of Asia Pacific: Market Size, By Application, 2017–2025 (USD Million)
Table 72 RoW: Plasma Feed Market Size, By Country, 2017–2025 (Kt)
Table 73 RoW: Market Size, By Country, 2017–2025 (USD Million)
Table 74 RoW: Market Size, By Source, 2017–2025 (Kt)
Table 75 RoW: Market Size, By Source, 2017–2025 (USD Million)
Table 76 RoW: Market Size, By Application, 2017–2025 (USD Million)
Table 77 Brazil: Plasma Feed Market Size, By Source, 2017–2025 (Kt)
Table 78 Brazil: Market Size, By Source, 2017–2025 (USD Million)
Table 79 Brazil: Market Size, By Application, 2017–2025 (USD Million)
Table 80 Argentina: Plasma Feed Market Size, By Source, 2017–2025 (Kt)
Table 81 Argentina: Market Size, By Source, 2017–2025 (USD Million)
Table 82 Argentina: Market Size, By Application, 2017–2025 (USD Million)
Table 83 South Africa: Plasma Feed Market Size, By Source, 2017–2025 (Kt)
Table 84 South Africa: Market Size, By Source, 2017–2025 (USD Million)
Table 85 South Africa: Market Size, By Application, 2017–2025 (USD Million)
Table 86 Others in RoW: Plasma Feed Market Size, By Source, 2017–2025 (Kt)
Table 87 Others in RoW: Market Size, By Source, 2017–2025 (USD Million)
Table 88 Others in RoW: Market Size, By Application, 2017–2025 (USD Million)
Table 89 Acquisitions, 2017–2018
Table 90 Acquisitions, 2017
List of Figures (26 Figures)
Figure 1 Plasma Feed Market: Research Design
Figure 2 Breakdown of Primary Interviews: By Company Type, Designation, and Region
Figure 3 Market Size Estimation Methodology: Bottom-Up Approach
Figure 4 Market Size Estimation Methodology: Top-Down Approach
Figure 5 Data Triangulation Methodology
Figure 6 Plasma Feed Market Size, By Source, 2019 vs. 2025 (USD Million)
Figure 7 Plasma Feed Market Size, By Application, 2019 vs. 2025 (USD Million)
Figure 8 Plasma Feed Market: Regional Snapshot
Figure 9 Growth in Demand for High-Quality Pet Food in Developed Countries Supports the Growth of the Plasma Feed Market
Figure 10 North America: the Us Was the Largest Market for Plasma Feed in 2018
Figure 11 Porcine-Based Plasma Was the Dominant Segment in the Plasma Feed Market in 2018
Figure 12 China is Projected to Witness Highest Growth During the Forecast Period
Figure 13 Countries With the Greatest Share of Additional Meat Production, By Meat Type, 2018
Figure 14 Feed Production Trend, 2012–2017 (Ton)
Figure 15 Plasma Feed: Market Dynamics
Figure 16 Annual Number of Patents Approved for Plasma Feed (2014–2019)
Figure 17 Patent Approval for Plasma Feed, By Region, 2014–2019
Figure 18 Plasma Feed Market Size, By Source, 2019 vs. 2025 (USD Million)
Figure 19 Plasma Feed Market Size, By Source, 2019 vs. 2025 (Kt)
Figure 20 Plasma Feed Market Size, By Application, 2019 vs. 2025 (USD Million)
Figure 21 China Accounted for the Largest Market Share in the Plasma Feed in 2018
Figure 22 North America: Regional Snapshot
Figure 23 Asia Pacific: Regional Snapshot
Figure 24 Plasma Feed Market: Competitive Leadership Mapping, 2018
Figure 25 Key Developments of the Leading Players in the Plasma Feed Market, 2014–2018
Figure 26 APC and Darling Ingredients Lead the Plasma Feed Market in 2018
The study involved four major activities in estimating the market size for plasma feed. Exhaustive secondary research was conducted to collect information on the market, peer market, and parent market. The next step was to validate these findings, assumptions, and sizing with industry experts across the value chain through primary research. Both the top-down and bottom-up approaches were employed to estimate the complete market size. After that, market breakdown and data triangulation were used to estimate the market size of segments and subsegments.
Secondary Research
In the secondary research process, various secondary sources such as Hoovers, Bloomberg BusinessWeek, and Dun & Bradstreet have been referred to, to identify and collect information for this study. These secondary sources included annual reports, press releases & investor presentations of companies, white papers, certified publications, articles by recognized authors, gold & silver standard websites, food safety organizations, regulatory bodies, trade directories, and databases.
Primary Research
The market comprises several stakeholders, such as raw material suppliers, processors, end-product manufacturers, and regulatory organizations in the supply chain. The supply side of this market is characterized by the development of plasma proteins extracted by varied animal sources such as porcine and bovine. The demand side is characterized by advancements in technology and diverse application industries such as animal feed industry. Various primary sources from both the supply and demand sides of the market were interviewed to obtain qualitative and quantitative information. Given below is the breakdown of the primary respondents.
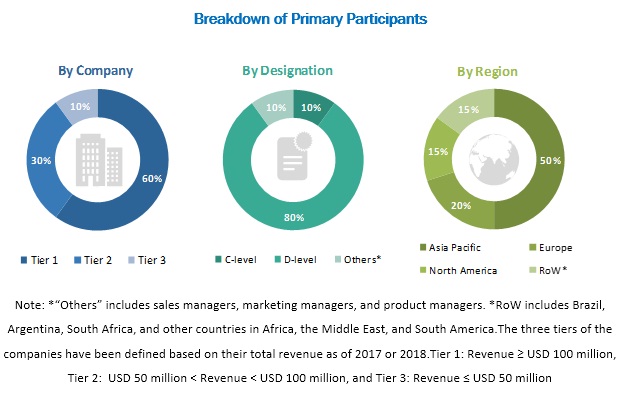
To know about the assumptions considered for the study, download the pdf brochure
Market Size Estimation
Both the top-down and bottom-up approaches were used to estimate and validate the total size of the plasma feed market. These methods were also used extensively to estimate the size of various subsegments in the market. The research methodology used to estimate the market size includes the following:
- The key players in the industry and markets have been identified through extensive secondary research.
- The industry’s supply chain and market size, in terms of value, have been determined through primary and secondary research processes.
- All percentage shares, splits, and breakdowns have been determined using secondary sources and verified through primary sources.
Data Triangulation
After arriving at the overall market size-using the market size estimation processes as explained above-the market was split into several segments and subsegments. To complete the whole market engineering process and arrive at the exact statistics of each market segment and subsegment, the data triangulation, and market breakdown procedures were employed, wherever applicable. The data was triangulated by studying various factors and trends from both the demand and supply sides in the related industries.
Report Objectives
- To describe and forecast the plasma feed market, in terms of source, application, and region
- To describe and forecast the plasma feed market, in terms of value, by region–Asia Pacific, Europe, North America, and the Rest of the World-along with their respective countries
- To provide detailed information regarding the major factors influencing market growth (drivers, restraints, opportunities, and challenges)
- To strategically analyze micro-markets with respect to individual growth trends, prospects, and contributions to the overall market
- To study the complete value chain of the plasma feed market
- To analyze opportunities in the market for stakeholders by identifying the high-growth segments of the plasma feed ecosystem
- To strategically profile the key players and comprehensively analyze their market position in terms of ranking and core competencies, along with detailing the competitive landscape for market leaders
- To analyze strategic approaches, such as acquisitions & divestments, expansions, product launches & approvals, and agreements in the plasma feed market
Available Customizations
Based on the given market data, MarketsandMarkets offers customizations in the reports according to client-specific requirements. The available customization options are as follows:
Product Analysis
- Product matrix, which provides a detailed comparison of the product portfolio of each company
Regional Analysis
- Further country-wise breakdown of the market in Asia Pacific and Europe
Company Information
- Detailed analysis and profiling of additional market players (Up to 5)


Growth opportunities and latent adjacency in Plasma Feed Market