Power Over Ethernet Solutions Market by Type (PSE Controllers & ICs, PD Controllers & ICs), Device Type (Power Sourcing Equipment, Powered Devices), Application (Connectivity, LED Lighting Control), Vertical, and Geography - Global Forecast to 2022


The power over Ethernet (PoE) solutions market was valued at USD 451.1 Million in 2015 and is estimated to reach USD 1,048.3 Million by 2022, at a CAGR of 12.56% during the forecast period. The base year used for this study is 2015, and the forecast period considered is between 2016 and 2022.
The objectives of the study are as follows:
- To define, describe, and forecast the PoE solutions market, segmented on the basis of type, device type, application, vertical, and geography
- To forecast the size of the PoE solutions market, in terms of value, and its market segments with respect to four main regions—North America, Europe, Asia-Pacific (APAC), and Rest of the World (RoW)
- To identify the major market trends and factors driving or inhibiting the growth of the PoE solutions market and its submarkets
- To analyze the market with the help of the Porter’s five forces framework, along with the value chain analysis of the PoE solutions market
- To strategically analyze the submarkets with respect to individual growth trends and contribution to the overall PoE solutions market
- To analyze the opportunities in the market for stakeholders by identifying the high-growth segments of the PoE solutions market
- To profile the key players operating in the PoE solutions market and comprehensively analyze their market ranking and core competencies
- To track and analyze the strategic developments such as new product launches, alliances, joint ventures, and mergers & acquisitions in the global PoE solutions market
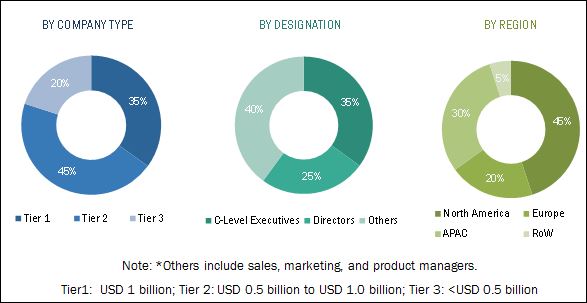
The research methodology used to estimate and forecast the power over Ethernet solutions market begins with obtaining data on key vendor revenues through secondary research. Some of the secondary sources used in this research include information from various journals and databases such as IEEE journals, Factiva, Hoover’s, and OneSource. The vendor offerings have also been taken into consideration to determine the market segmentation. The bottom-up procedure has been employed to arrive at the overall size of the global power over Ethernet solutions market from the revenues of the key players in the market. After arriving at the overall market size, the total market has been split into several segments and subsegments, which have then been verified through primary research by conducting extensive interviews of people holding key positions in the industry such as CEOs, VPs, directors, and executives. The market breakdown and data triangulation procedures have been employed to complete the overall market engineering process and arrive at the exact statistics for all segments and subsegments. The breakdown of the profiles of primaries has been depicted in the figure below:
To know about the assumptions considered for the study, download the pdf brochure
The power over Ethernet solutions ecosystem comprises PoE power sourcing equipment controller & IC and PoE powered device controller & IC vendors such as Maxim Integrated Products Inc. (U.S.), Microsemi Corp. (U.S.), Texas Instruments Inc. (U.S.), STMicroelectronics N.V. (Switzerland), Linear Technology Corp. (U.S.), Axis Communications AB (Sweden), Microsemi Corp. (U.S.), MSTronic Co., Ltd. (Taiwan), and Cisco Systems, Inc. (U.S.). PoE powered device controllers & ICs are used by PoE compatible powered device providers such as Toshiba Corp. (Japan), Axis Communications AB (Sweden), Panasonic Corp. (Japan), D-Link Corp. (Taiwan), Cisco Systems, Inc. (U.S.), Cree, Inc. (U.S.), and Koninklijke Philips N.V. (Netherlands). The end users of these PoE technology-based products are from a wide range of verticals such as residential, commercial, and industrial.
The Target Audience:
- Communication network providers
- PoE controller & IC manufacturers and vendors
- PoE device manufacturers (OEMs)
- Distributors and traders
- Research organizations and consulting companies
- Power over Ethernet-related associations, organizations, forums, and alliances
- Government bodies such as regulating authorities and policy makers
- Venture capitalists, private equity firms, and startup companies
“The study answers several questions for the target audiences, primarily which market segments to focus on in next two to five years for prioritizing the efforts and investments.”
Report Scope:
In this report, the power over Ethernet solutions market has been segmented into the following categories, which have been detailed below:
Power over Ethernet Solutions Market, by Type:
- Power Sourcing Equipment Controllers & ICs
- Powered Device Controllers & ICs
Power over Ethernet Solutions Market, by Device Type:
- Power Sourcing Equipment
- Powered Devices
Power over Ethernet Solutions Market, by Application:
- Connectivity
- Security & Access Control
- Infotainment
- LED Lighting & Control
- Others
Power over Ethernet Solutions Market, by Vertical:
- Residential
- Commercial
- Industrial
Power over Ethernet Solutions Market, by Geography:
- North America (U.S., Canada, and Mexico)
- Europe (U.K., Germany, France, and Others)
- Asia-Pacific (China, Japan, India, and Others)
- Rest of the World
Competitive Landscape: Market share analysis
Company Profiles: Detailed analysis of the major companies present in the PoE solutions market
Available Customizations:
With the given market data, MarketsandMarkets offers customizations according to the company’s specific needs. The following customization options are available for the report:
Company Information
Detailed analysis and profiling of additional market players (up to five)
The power over Ethernet solutions market was valued at USD 451.1 Million in 2015 and is expected to reach USD 1,048.3 Million by 2022, at a CAGR of 12.56% during the forecast period. The growth of this market is being propelled by the growing demand for PoE-based products, especially in the commercial vertical; continuous rise in the adoption of PoE-compatible VoIP phones and wireless access points; and increasing use of PoE power sourcing equipment for powering such devices.
The scope of this report covers the power over Ethernet solutions market on the basis of type, device type, application, vertical, and geography. Connectivity applications accounted for the largest share of the overall power over Ethernet solutions market. The power over Ethernet solutions market for connectivity applications is expected to grow at a high rate between 2016 and 2022. The benefits of VoIP phones such as low cost of communication, ease of installation, and maintenance, among others, have led to the increase in deployment of VoIP phones. Besides this, the growing IoT industry is fueling the demand for wireless access points. Currently, most of the VoIP phones and wireless access points are PoE compatible and are being powered using the PoE technology; this factor is also driving the growth of the power over Ethernet solutions market for connectivity applications.
The power over Ethernet solutions market for the commercial vertical is expected to be the fastest-growing market by 2022. The increasing demand for power over Ethernet technology-based products from office buildings, especially for connectivity and security & access control applications, is one of the major factors driving the growth of the market. Besides this, the growing popularity of the PoE technology-based lighting solutions due to their advantages has led to the growth in the power over Ethernet solutions market for the commercial vertical.
North America held the largest share of the power over Ethernet solutions market in 2015. The high growth of the market in this region can be attributed to the increasing demand for PoE controllers & ICs due to the presence of a large number of PoE power sourcing equipment as well as powered device manufacturers in North America.
The key restraining factor for the growth of the power over Ethernet solutions market is the limitation on the amount of power delivered to the end devices by the use of PoE-based power sourcing equipment. This report describes the drivers, restraints, opportunities, and challenges pertaining to the power over Ethernet solutions market. In addition, it analyzes the current scenario and forecasts the market till 2022, including the market segmentation based on type, device type, application, vertical, and geography.
Some of the major companies operating in the power over Ethernet solutions market are Texas Instruments, Inc. (U.S.), Maxim Integrated Products, Inc. (U.S.), Linear Technology Corp. (U.S.), Microsemi Corp. (U.S.), and STMicroelectronics N.V. (Switzerland).
To speak to our analyst for a discussion on the above findings, click Speak to Analyst
Table of Contents
1 Introduction (Page No. - 14)
1.1 Objectives of the Study
1.2 Market Definition
1.3 Study Scope
1.3.1 Markets Covered
1.3.2 Years Considered for the Study
1.4 Currency
1.5 Limitations
1.6 Stakeholders
2 Research Methodology (Page No. - 18)
2.1 Introduction
2.1.1 Secondary Data
2.1.2 Key Data From Secondary Sources
2.1.3 Primary Data
2.1.3.1 Key Data From Primary Sources: Power Over Ethernet Solutions
2.1.3.2 Key Industry Insights
2.2 Market Size Estimation
2.3 Market Breakdown and Data Triangulation
2.3.1 Assumptions
3 Executive Summary (Page No. - 27)
4 Premium Insights (Page No. - 31)
4.1 Power Over Ethernet Solutions Market Expected to Have A Huge Growth Opportunity in APAC
4.2 Power Over Ethernet Solutions Market, By Type (2016–2022)
4.3 Power Over Ethernet Solutions Market, By Region and Vertical
4.4 Power Over Ethernet Solutions Market, By Application
5 Market Overview (Page No. - 33)
5.1 Introduction
5.2 Market Segmentation
5.2.1 By Type
5.2.2 By Device Type
5.2.3 By Application
5.2.4 By Vertical
5.3 Market Dynamics
5.3.1 Drivers
5.3.1.1 Growing Adoption of Voice Over Internet Protocol (VoIP)Phones and Wireless Networking
5.3.1.2 Simple and Cost-Effective Installation
5.3.1.3 High Level of Reliability
5.3.2 Restraints
5.3.2.1 Limitation on the Amount of Power Delivered to End Devices
5.3.2.2 High Cost of POE Switches
5.3.3 Opportunities
5.3.3.1 Introduction of A New POE Standard
5.3.3.2 Increasing Adoption of Led Lighting
5.3.4 Challenges
5.3.4.1 Limited Range of POE
6 Industry Trends (Page No. - 40)
6.1 Introduction
6.2 Value Chain Analysis
6.3 Porter’s Five Forces Model
6.3.1 Threat of New Entrants
6.3.2 Threat of Substitutes
6.3.3 Bargaining Power of Suppliers
6.3.4 Bargaining Power of Buyers
6.3.5 Intensity of Competitive Rivalry
7 Power Over Ethernet Standards (Page No. - 46)
7.1 Introduction
7.2 IEEE 802.3AF (POE)
7.3 IEEE 802.3AT (POE+)
7.4 IEEE 802.3BT
8 Power Over Ethernet Solutions Market, By Type (Page No. - 48)
8.1 Introduction
8.2 POE Power Sourcing Equipment (PSE) Controllers & ICS
8.3 POE Powered Device (PD) Controllers & ICS
9 Power Over Ethernet Solutions Market, By Device Type (Page No. - 54)
9.1 Introduction
9.2 Power Sourcing Equipment
9.2.1 Endspan Power Sourcing Equipment (POE Switch)
9.2.2 Midspan Power Sourcing Equipment (POE Injector)
9.3 Powered Devices
9.3.1 VoIP Phones
9.3.2 Wireless Access Points
9.3.3 Ip Cameras
9.3.4 Other Powered Devices
10 Power Over Ethernet Solutions Market, By Application (Page No. - 60)
10.1 Introduction
10.2 Connectivity
10.3 Security & Access Control
10.4 Infotainment
10.5 Led Lighting Control
10.6 Others
11 Power Over Ethernet Solutions Market, By Vertical (Page No. - 70)
11.1 Introduction
11.2 Commercial
11.2.1 Office Buildings
11.2.2 Healthcare
11.2.3 Retail
11.2.4 Others
11.3 Residential
11.4 Industrial
11.4.1 Oil & Gas
11.4.2 Transportation
11.4.3 Telecommunication
11.4.4 Power
11.4.5 Others
12 Power Over Ethernet Solutions Market, By Geography (Page No. - 78)
12.1 Introduction
12.2 North America
12.2.1 U.S.
12.2.2 Canada
12.2.3 Mexico
12.3 Europe
12.3.1 U.K.
12.3.2 Germany
12.3.3 France
12.3.4 Rest of Europe
12.4 Asia-Pacific
12.4.1 Japan
12.4.2 China
12.4.3 India
12.4.4 Rest of APAC
12.5 Rest of the World (RoW)
12.5.1 Latin America
12.5.2 Middle East & Africa
13 Competitive Landscape (Page No. - 108)
13.1 Overview
13.2 Ranking of Key Players in the Power Over Ethernet Solutions Market
13.3 Competitive Situation
13.3.1 New Product Launches
13.3.2 Agreements, Collaborations, & Expansions
13.3.3 Acquisitions
14 Company Profiles (Page No. - 114)
14.1 Introduction
(Business Overview, Products & Services, Key Insights, Recent Developments, SWOT Analysis, Ratio Analysis, MnM View)*
14.2 Maxim Integrated Products, Inc.
14.3 Texas Instruments Inc.
14.4 Linear Technology Corp.
14.5 Microsemi Corp.
14.6 Stmicroelectronics N.V.
14.7 Broadcom Ltd.
14.8 Monolithic Power Systems, Inc.
14.9 On Semiconductor Corp.
14.10 Cisco Systems, Inc.
14.11 Silicon Laboratories Inc.
14.12 Akros Silicon, Inc.
*Details on Business Overview, Products & Services, Key Insights, Recent Developments, SWOT Analysis, MnM View Might Not Be Captured in Case of Unlisted Companies.
15 Appendix (Page No. - 143)
15.1 Insights of Industry Experts
15.2 Discussion Guide
15.3 Knowledge Store: Marketsandmarkets’ Subscription Portal
15.4 Introducing RT: Real-Time Market Intelligence
15.5 Available Customizations
15.6 Related Reports
List of Tables (64 Tables)
Table 1 Power Over Ethernet Solutions Market, By Type, 2013–2022 (USD Million)
Table 2 Power Over Ethernet Solutions Market, By Type, 2013–2022 (Million Units)
Table 3 Power Over Ethernet Solutions Market for Power Sourcing Equipment Controllers & ICS, By Application, 2013–2022 (USD Million)
Table 4 Power Over Ethernet Solutions Market for Powered Device Controllers & ICS, By Application, 2013–2022 (USD Million)
Table 5 Power Over Ethernet Solutions Market for Power Sourcing Equipment Controllers & ICS Market, By Device Type, 2013–2022 (USD Million)
Table 6 Power Over Ethernet Solutions Market for Powered Device Controllers & ICS Market, By Device Type, 2013–2022 (USD Million)
Table 7 Power Over Ethernet Solutions Market, By Application, 2013–2022 (USD Million)
Table 8 Power Over Ethernet Solutions Market for Connectivity Applications, By Vertical, 2013–2022 (USD Million)
Table 9 Power Over Ethernet Solutions Market for Connectivity Applications, By Region, 2013–2022 (USD Million)
Table 10 Power Over Ethernet Solutions Market for Security & Access Control Applications, By Vertical, 2013–2022 (USD Million)
Table 11 Power Over Ethernet Solutions Market for Security & Access Control Applications, By Region, 2013–2022 (USD Million)
Table 12 Power Over Ethernet Solutions Market for Infotainment Applications, By Vertical, 2013–2022 (USD Million)
Table 13 Power Over Ethernet Solutions Market for Infotainment Applications, By Region, 2013–2022 (USD Million)
Table 14 Power Over Ethernet Solutions for Led Lighting Control Applications, By Vertical, 2013–2022 (USD Million)
Table 15 Market for Led Lighting Control Applications, By Region, 2013–2022 (USD Million)
Table 16 Power Over Ethernet Solutions for Other Applications, By Vertical, 2013–2022 (USD Million)
Table 17 Market for Other Applications, By Region, 2013–2022 (USD Million)
Table 18 Market, By Vertical, 2013–2022 (USD Million)
Table 19 Power Over Ethernet Solutions Market for Commercial Vertical, By Application, 2013–2022 (USD Million)
Table 20 Market for Commercial Vertical, By Type, 2013–2022 (USD Million)
Table 21 Market for Residential Vertical, By Application, 2013–2022 (USD Million)
Table 22 Market for Industrial Vertical, By Application, 2013–2022 (USD Million)
Table 23 Power Over Ethernet Solutions Market for Industrial Vertical, By Type 2013–2022 (USD Million)
Table 24 Market, By Region, 2013–2022 (USD Million)
Table 25 Power Over Ethernet Solutions Market in North America, By Country, 2013–2022 (USD Million)
Table 26 Market in North America, By Application, 2013–2022 (USD Million)
Table 27 Market for Connectivity Application in North America, By Country, 2013–2022 (USD Million)
Table 28 Power Over Ethernet Solutions Market for Security & Access Control Application in North America, By Country, 2013–2022 (USD Million)
Table 29 Power Over Ethernet Solutions Market for Infotainment Application in North America, By Country, 2013–2022 (USD Million)
Table 30 Market for Led Lighting Control Application in North America, By Country, 2013–2022 (USD Million)
Table 31 Power Over Ethernet Solutions Market in U.S., By Application, 2013–2022 (USD Million)
Table 32 Market in Canada, By Application, 2013–2022 (USD Million)
Table 33 Power Over Ethernet Solutions Market in Mexico, By Application, 2013–2022 (USD Million)
Table 34 Market in Europe, By Country, 2013–2022 (USD Million)
Table 35 Power Over Ethernet Solutions Market in Europe, By Application, 2013–2022 (USD Million)
Table 36 Market for Connectivity Application in Europe, By Country, 2013–2022 (USD Million)
Table 37 Power Over Ethernet Solutions Market for Security & Access Control Application in Europe , By Country, 2013–2022 (USD Million)
Table 38 Power Over Ethernet Solutions Market for Infotainment Application in Europe, By Country, 2013–2022 (USD Million)
Table 39 Power Over Ethernet Solutions Market for Led Lighting Control Application in Europe, By Country, 2013–2022 (USD Million)
Table 40 Power Over Ethernet Solutions Market in U.K., By Application, 2013–2022 (USD Million)
Table 41 Power Over Ethernet Solutions Market in Germany, By Application, 2013–2022 (USD Million)
Table 42 Market in France, By Application, 2013–2022 (USD Million)
Table 43 Power Over Ethernet Solutions Market in Rest of Europe, By Application, 2013–2022 (USD Million)
Table 44 Market in APAC, By Country, 2013–2022 (USD Million)
Table 45 Power Over Ethernet Solutions Market in APAC, By Application, 2013–2022 (USD Million)
Table 46 Market for Connectivity Application in APAC, By Country, 2013–2022 (USD Million)
Table 47 Power Over Ethernet Solutions Market for Security & Access Control Application in APAC, By Country, 2013–2022 (USD Million)
Table 48 Market for Infotainment Application in APAC, By Country, 2013–2022 (USD Million)
Table 49 Power Over Ethernet Solutions Market for Led Lighting Control Application in APAC, By Country, 2013–2022 (USD Million)
Table 50 Market in Japan, By Application, 2013–2022 (USD Million)
Table 51 Power Over Ethernet Solutions Market in China, By Application, 2013–2022 (USD Million)
Table 52 Market in India, By Application, 2013–2022 (USD Million)
Table 53 Power Over Ethernet Solutions Market in Rest of APAC, By Application, 2013–2022 (USD Million)
Table 54 Market in RoW, By Application, 2013–2022 (USD Million)
Table 55 Market for Connectivity Application in RoW, By Region, 2013–2022 (USD Million)
Table 56 Power Over Ethernet Solutions Market for Security & Access Control Application in RoW, By Region, 2013–2022 (USD Million)
Table 57 Market for Infotainment Application in RoW, By Region, 2013–2022 (USD Million)
Table 58 Market for Led Lighting Control Application in RoW, By Region, 2013–2022 (USD Million)
Table 59 Market in Latin America, By Application, 2013–2022 (USD Million)
Table 60 Power Over Ethernet Solutions Market in Middle East & Africa, By Application, 2013–2022 (USD Million)
Table 61 Ranking of Key Players in the Power Over Ethernet Solutions Market
Table 62 New Product Launches, 2014–2016
Table 63 Agreements, Collaborations, & Expansions, 2014–2016
Table 64 Acquisitions, 2015–2016
List of Figures (62 Figures)
Figure 1 Markets Covered: Power Over Ethernet Solutions
Figure 2 Power Over Ethernet Solutions Market: Research Design
Figure 3 Breakdown of Primaries
Figure 4 Power Over Ethernet Solutions Market Size Estimation Methodology: Bottom-Up Approach
Figure 5 Power Over Ethernet Solutions Market Size Estimation Methodology: Top-Down Approach
Figure 6 Data Triangulation
Figure 7 Power Over Ethernet Solutions: Market Size Analysis
Figure 8 Power Over Ethernet Solutions Market Snapshot (2016 vs 2022): Connectivity Application Segment Expected to Dominate During the Forecast Period
Figure 9 North America Held the Largest Share of the Power Over Ethernet Solutions Market in 2015
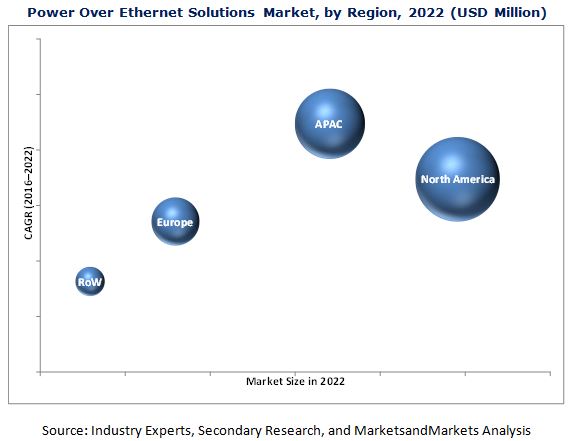
Figure 10 Attractive Growth Opportunities in the Power Over Ethernet Solutions Market
Figure 11 Powered Device Controllers & ICS to Hold the Largest Market Share During the Forecast Period (2016–2022)
Figure 12 North America to Hold the Largest Share of the Power Over Ethernet Solutions Market in 2016
Figure 13 Market for Connectivity Application to Grow at the Highest Rate Between 2016 and 2022
Figure 14 Power Over Ethernet Solutions Market, By Geography
Figure 15 Growing Demand for VoIP Phones and Wireless Access Points to Drive the Power Over Ethernet Solutions Market During the Forecast Period
Figure 16 Value Chain Analysis: Major Value Addition Takes Place During the Manufacturing & Assembly Phase
Figure 17 Porter’s Five Forces Analysis
Figure 18 Porter’s Analysis: Power Over Ethernet Solutions Market, 2015
Figure 19 Impact Analysis of Threat of New Entrants
Figure 20 Impact Analysis of Threat of Substitutes
Figure 21 Impact Analysis of Bargaining Power of Suppliers
Figure 22 Impact Analysis of Bargaining Power of Buyers
Figure 23 Impact Analysis of Intensity of Competitive Rivalry
Figure 24 Power Over Ethernet Standards
Figure 25 Segmentation of the Power Over Ethernet Solutions Market, By Type
Figure 26 PD Controllers & ICS Expected to Lead the Power Over Ethernet Solutions Market During the Forecast Period
Figure 27 Connectivity Application Expected to Dominate the Market for POE PD Controllers & ICS During the Forecast Period
Figure 28 Segmentation of the Power Over Ethernet Solutions Market, By Device Type
Figure 29 Market for VoIP Phones to Grow at the Highest Rate During the Forecast Period
Figure 30 Segmentation of the Power Over Ethernet Solutions Market, By Application
Figure 31 Connectivity Applications to Dominate the Power Over Ethernet Solutions Market During the Forecast Period
Figure 32 Commercial Vertical Expected to Dominate the Power Over Ethernet Solutions Market for Security & Access Control Application During the Forecast Period
Figure 33 North America to Hold the Largest Size of the Power Over Ethernet Solutions Market for Led Lighting Control Applications During the Forecast Period
Figure 34 Commercial Vertical Expected to Dominate the Power Over Ethernet Solutions Market During the Forecast Period
Figure 35 Office Buildings Segment Expected to Hold the Largest Size of the Power Over Ethernet Solutions Market for Commercial Vertical During the Forecast Period
Figure 36 Transportation Sector Expected to Lead the Power Over Ethernet Solutions Market for Industrial Vertical During the Forecast Period
Figure 37 Geographic Snapshot (2015): APAC Countries Such as China and Japan Expected to Witness Significant Growth During the Forecast Period
Figure 38 North American Power Over Ethernet Solutions Market Snapshot: Connectivitity Application Expected to Witness A High Growth Rate Between 2016 and 2022
Figure 39 Connectivity Applications to Lead the Power Over Ethernet Solutions Market in Canada During the Forecast Period
Figure 40 European Market Snapshot: France Expected to Lead the Power Over Ethernet Solutions Market During the Forecast Period
Figure 41 Connectivity Application to Lead the Power Over Ethernet Solutions Market in U.K. During the Forecast Period
Figure 42 APAC Market Snapshot: Connectivity Application to Drive the Power Over Ethernet Solutions Market During the Forecast Period
Figure 43 Latin America Expected to Lead the Power Over Ethernet Solutions Market for Connectivity Application in RoW During the Forecast Period
Figure 44 Companies Adopted New Product Launches as the Key Growth Strategy (2014–2016)
Figure 45 Market Evaluation Framework: New Product Launches Fueled Growth and Innovation Between 2014 and 2016
Figure 46 Battle for Market Share: New Product Launches - Key Strategy in 2015 and 2016
Figure 47 Geographic Revenue Mix of Top Five Market Players
Figure 48 Maxim Integrated Products, Inc.: Company Snapshot
Figure 49 Maxim Integrated Products, Inc.: SWOT Analysis
Figure 50 Texas Instruments Inc.: Company Snapshot
Figure 51 Texas Instruments Inc.: SWOT Analysis
Figure 52 Linear Technology Corp.: Company Snapshot
Figure 53 Linear Technology Corporation: SWOT Analysis
Figure 54 Microsemi Corp.: Company Snapshot
Figure 55 Microsemi Corporation: SWOT Analysis
Figure 56 Stmicroelectronics N.V.: Company Snapshot
Figure 57 Stmicroelectronics N.V.: SWOT Analysis
Figure 58 Broadcom Ltd.: Company Snapshot
Figure 59 Monolithic Power Systems, Inc.: Company Snapshot
Figure 60 on Semiconductor Corp.: Company Snapshot
Figure 61 Cisco Systems, Inc.: Company Snapshot
Figure 62 Silicon Laboratories, Inc.: Company Snapshot


Growth opportunities and latent adjacency in Power Over Ethernet Solutions Market